Confidence limits for motorcycle speed
from slide distance
D P Wood1*, R Alliot1
, C Glynn1, C K Simms2,andD G Walsh3
1
Denis Wood Associates, Dublin, Ireland
2
Centre for Bioengineering, Trinity College, Dunlin, Ireland
3
Dr JH Burguyne & Partners LLP, Stevenage, Herts, UK
The manuscript was received on 24 September 2007 and was accepted after revision for publication on 7 March 2008.
DOI: 10.1243/09544070JAUTO731
Abstract: In many motorcycle accidents, the motorcycle falls to the ground and slides to rest following impact or loss of control. The determination of the motorcycle speed just prior to ‘fall-over’ is important for biomechanics research and for litigation. This paper presents a new model of motorcycle fall-over and slide, which accounts for the loss of horizontal momentum resulting from the initial motorcycle-to-ground impact and the subsequent slide to rest. The model includes cases involving motorcycle fall-over owing to loss of control as well as impact. The models represent both the mean and variation present in the available experimental data for dry roads very well and are used to develop confidence limits for accident reconstruction purposes, in cases where only the motorcycle slide distance along the ground is known. Previously proposed confidence limit criteria are applied to predicting motorcycle speed ranges from slide distance, and it is shown that the level of prediction uncertainty can be substantially reduced in cases where additional information specific to the vehicle and road configurations is available.
Keywords: motorcycle, fall-over, slide distance, velocity, side impact, confidence limits
1 INTRODUCTION
The determination of collision impact speed is important for biomechanics research and for litiga-tion. Motorcycles falling over, following a collision with another vehicle or loss of control, frequently leave marks which allow identification of the points of first contact with the ground and measurement of the overall slide distances to rest. These slide distances can be used to estimate motorcycle speed. In many such collisions, the motorcycle is caused to rotate about the tyre-to-road contact points, fall over, and impact the ground. This is followed by bouncing and sliding to rest. Two fall-over config-urations predominate. The first one is fall-over at right angles to the direction of travel as a result of weave, wobble, or capsize instability [1] after a side-swipe collision, avoidance manoeuvre, or other loss of control (‘inline’ fall-over). The second one is due to fall-over after the motorcycle and rider are side
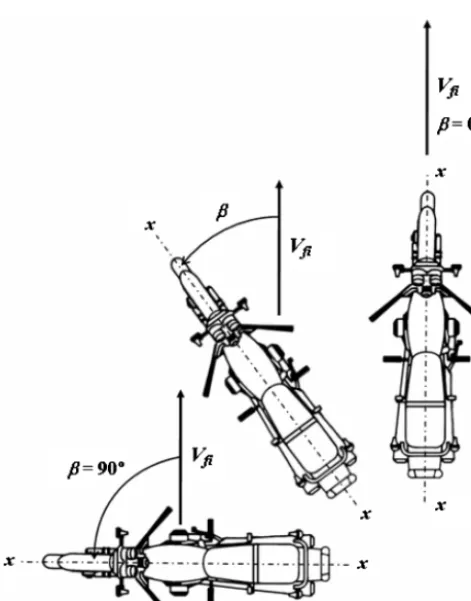
struck by the front of a vehicle (90 degree or ‘normal’ over). Figure 1 illustrates the two limiting fall-over conditions: ‘inline’ fall-fall-over where the horizon-tal velocity direction of the motorcycle is in line with the longitudinal axis of the motorcycle (attitude angleb50u) and ‘normal’ fall-over where the long-itudinal velocity direction of the motorcycle is normal to the axis (attitude angle b590u). In some motorcycle collisions, the post impact attitude angle of the motorcycle will be at an intermediate angle, as shown in Fig. 1.
Various researchers [2–7] have proposed that the slide distance and the coefficient of retardation during slide be used to estimate the speed of the motorcycle at fall-over, using the simple slide equation
S~ V 2 fi 2mappg
ð1Þ
It has been found that the apparent coefficient of retardation mapp, obtained using equation (1) from tests where the slide distance S and the fall-over *Corresponding author: Denis Wood Associates, Isoldes Tower, 1
velocityVfiwere measured, reduces with increasing velocity of the motorcycle [2, 5–7]. Lambourn [7] and Hague [6] have suggested that this reduction is owing to the high decelerations experienced on initial impact of the motorcycle with the ground. Tests by McNally and Bartlett [8] confirm that higher decelerations are imposed during initial ground contact by comparison with the rest of the motor-cycle movement.
1.1 Motorcycle fall-over
When a motorcycle falls over and impacts the ground, various parts of the vehicle can penetrate the surface and form ‘gouges’ while other parts deform as a result of the impact. Figure 2 illustrates the three main phases: fall-over to side; initial ground impact; bounce and slide to rest. The vehicle parts in contact with the ground become scored and abraded as the motorcycle slides and bounces to rest. While there is some evidence that lighter motorcycles have higher coefficients of retardation than heavier vehicles, this trend is effectively masked by the range of variability in the reported coefficient of retardation values [9]. The same researchers [9] also show that there is no correlation between the motorcycle retardation coefficient and the nominal dry road surface tyre-to-road friction.
Various researchers [2, 5–7, 9] have reported a clear speed dependence of the coefficient of retarda-tion. However, low-level drop tests [3,7] performed to minimize the effect of the initial ground impact have shown that the coefficient of retardation is substantially independent of the initial speed and broadly similar to results obtained in drag tests [4,
7]. The features of individual motorcycles, such as crash bars, fairings, and panniers, etc., all influence the coefficient of retardation. Fully faired motor-cycles and those fitted with crash bars generally have lower coefficients [6], but this is subject to signifi-cant overlap of the data.
1.2 Objectives
This paper proposes a theoretical model relating motorcycle speed at fall-over to slide distance. The paper accounts for the initial road impact of the
Fig. 1 Position of the motorcycle prior to fall-over with respect to the direction of the travelling velocity at fall-over,Vfi
[image:2.613.41.277.80.381.2] [image:2.613.57.524.568.739.2]motorcycle and the resulting loss of horizontal momentum. This impact phenomenon has not been included in previous studies. The coefficient of retardation m remains constant throughout, with the apparent higher retardation on initial ground impact being the result of loss of horizontal mom-entum caused by the ground impact. Comparison with staged fall-over tests on dry road surfaces shows that this model explains the observed phe-nomenon. Confidence limits are then derived for motorcycle speed estimation from slide distances on roads after ‘inline’ fall-over and ‘normal’ fall-over respectively.
2 THEORETICAL MODEL
As shown in Fig. 2, there are three principal phases in motorcycle fall-over: fall-over to side, initial ground impact, and slide/bounce to rest. The initial travel speed of the motorcycle is the sum of the speed loss in each of the three phases
Vfi~DVfzDVizDVs ð2Þ
2.1 ‘Inline’ fall-over
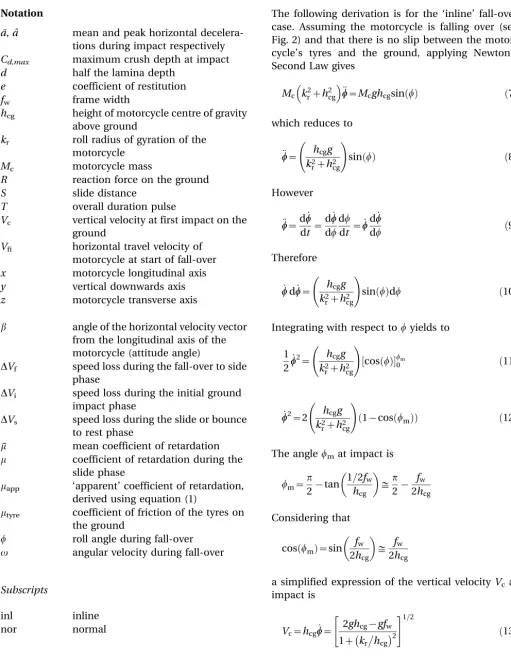
‘Inline’ fall-over results from weave, wobble, or capsize instability, a side-swipe collision, an avoid-ance manoeuvre, or rider loss of control. The motorcycle is treated as a rigid body and the interactive effects of the motorcyclist are ignored. The fall-over is at right angles to the line of travel of the motorcycle. The rotational velocity about thex–x axis,v, increases with roll anglewunder the effect of gravity, and the motorcycle contacts the ground with a vertical velocity, Vc. Here there is negligible loss in travel speed during the fall and DVf50. The reduction in forward momentum on ground contact is (mMcVc) and the corresponding loss of forward velocity on impact isDVi5(mVc). The vertical impact velocityVcof the motorcycle centre of gravity is
Vc~ 2ghcg{gfw 1z kr
hcg
2 2
6 4
3 7 5
1 2
ð3Þ
refer to Appendix 2.
Searle [10], in an elegant analysis, has shown that DVs5(2mgS)1/2, and that this relation applies to tumbling, bouncing, and sliding together, as well as to pure slide, when m is the average coefficient of
retardation. Therefore, for ‘inline’ fall-over
Vfi~mVczð2mgSÞ1=2 ð4Þ
2.2 Side-struck fall-over
In many collisions where the motorcycle is in the path of the colliding ‘bullet’ vehicle the motorcycle is caused to ‘square up’ in the course of the impact and is projected in the travel direction of the colliding vehicle. This is the second limiting case of fall-over. In this case, if the centre of gravity of the motorcycle is within the impact zone with the colliding vehicle, the motorcycle will initially slide sideways with its tyres remaining in contact with the road. Note that this does not occur in all motorcycle side-struck collisions.
In this case, the motorcycle experiences a retard-ing force equal tomtyreR, wheremtyreis the coefficient of friction of the motorcycle tyres to the road and R is the vertical reaction force. This results in an additional reduction in motorcycle horizontal travel velocity during fall-over, DVf. Wood and Walsh [11] have previously analysed this type of fall-over mechanism in relation to forward projection pedes-trian accidents. Appendix 3 details the relationships for the resulting fall-over rotation and acceleration, which, using numerical integration, yieldsDVf.
2.3 Motorcycle parameters
The motorcycle parameters which influence the vertical ground contact velocity Vc are centre of gravity height hcg, motorcycle frame width fw, and roll radius of gyration kr. Figure 3 shows the distribution of hcg reported by Foale [12] for 39 motorcycles. The range of hcg is from 295 mm to 620 mm with a 50 percentile of 518 mm. Measure-ments of the nominal frame width of 42 motorcycles show a normal distribution with a 50 percentile width of 305 mm and a standard deviation of 42 mm. Measurements of the maximum width of 104 motorcycles, across the ends of the handlebars, shows a normal distribution with a mean of 766 mm and a standard deviation of 81 mm.
Vermaet al.[16] have reported akr/hcgof 0.477 for a standard machine. Figure 4 shows the representa-tion of a motorcycle in cross-secrepresenta-tion as a lamina of uniform density. Here the radius of gyrationkrisd/ !3 where dis half the lamina depth. Application of
this model to Cossalter et al.[15] and Verma et al. [16] data yieldsd/hcgvalues of 0.533, 0.616, and 0.825 respectively. On this basis, it is proposed that the range of motorcycles types can be considered as being bounded byd/hcgvalues from 0.5 to 1.0.
2.4 Coefficient of retardation
The preponderance of reported data is for the apparent coefficient derived from ‘inline’ fall-over tests on dry road surfaces at various speeds, by using the standard slide equation (1). Carter et al. [3] carried out low-level drop tests of motorcycles suspended 50 mm above ground level. Lambourn [7] carried out similar low-level tests. However, even this low drop height has a significant influence on the value of the coefficient of retardation. Table 1 shows the difference between the apparent and actual coefficients, when the initial ground impact is accounted for, equation (4). The actual value of the coefficient is less than the apparent value, particu-larly for the higher levels of retardation and at the lower fall-over speeds.
The drop test data from Carter et al. [3] and Lambourn [7] were corrected for the above effect and combined with drag test data from Day and Smith [4] and Lambourn [7], yielding 120 test results. The data are normally distributed with a mean of 0.44 and a standard deviation of 0.10.
2.5 Motorcycle tyre-to-road sliding friction
Collins [17] compiled 143 braking tests on dry roads where both wheels were locked. These data give the maximum sliding friction for motorcycle tyres on dry roads and show a normal distribution, with a mean of 0.93 and a standard deviation of 0.10.
3 COMPARISON WITH ‘INLINE’ FALL-OVER
TESTS
3.1 McNally and Bartlett tests
McNally and Bartlett [8] reported the results of three fall-over tests where they separately measured the
Fig. 4 Lamina representation of the motorcycle
[image:4.613.40.279.83.270.2]Fig. 3 Cumulative distribution of the centre of gravity heighthcgof motorcycles [12]
Table 1 Difference between apparent and actual coefficient of retardation for a drop height of 50 mm and velocities of 5 m/s (18 km/h), 10 m/s (36 km/h), and 15 m/s (54 km/h)
Apparent value of coefficient
Actual value of coefficient
Vfi55 m/s Vfi510 m/s Vfi515 m/s
0.25 0.228 0.238 0.242
0.45 0.384 0.414 0.425
[image:4.613.41.278.319.554.2] [image:4.613.81.501.689.754.2]coefficient of retardation during and after the initial ground impact. Table 2 compares the measured slide distances with those calculated from equation (4) and from the simple slide equation (1) where the initial ground impact is ignored, while using the coefficients of retardation measured during the slide phase. Values of fw50.3 m, hcg50.52, and kr/ hcg50.48 were used forVc, equation (3).
Table 2 shows that the calculated slide distances ignoring the loss of momentum during the initial impact are all substantially greater than the mea-sured values while those calculated using equation (4) bound the measured values with an average difference of 0.45 per cent. This suggests that the model represents the actual fall-over and slide behaviour.
3.2 Other ‘inline’ fall-over tests
While many researchers have carried out fall-over tests, evaluation of the data shows that 36 tests carried out by Lambourn [7] and Donohue [18] can be grouped together in five speed range groups from 11 m/s to 26 m/s. Lambourn’s tests [7] involved four motorcycle types, the Honda C-90, Honda CG 125, Suzuki 125 ER, and Yamaha TZR 125 and were carried out on two road surfaces, fine-textured asphalt and coarse asphaltic concrete. Donohue’s six tests [18] were on asphaltic concrete and using a 1982 Kawasaki KZ 1000 Police Special.
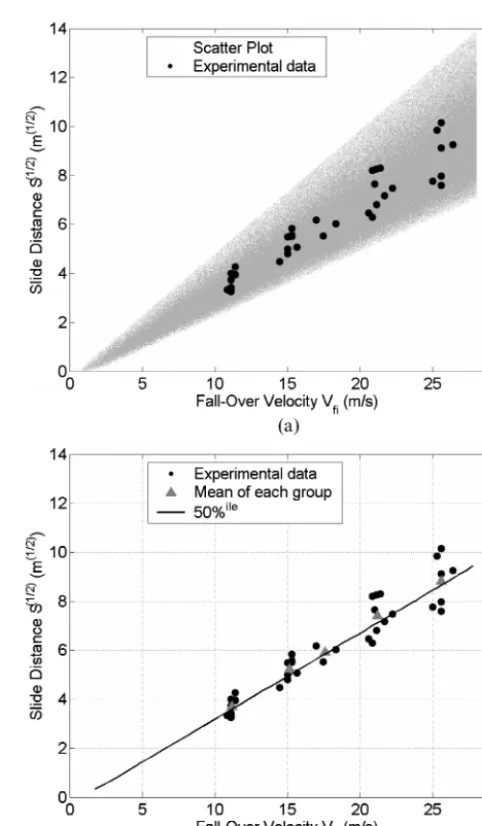
A Monte Carlo simulation was carried out using equations (3) and (4) for the range of motor-cycle parameters previously detailed. Figure 5(a) shows the scatter plot of data obtained from the Monte Carlo simulation with the square root of slide distance S1/2 plotted as a function of motorcycle speed at fall-over, Vfi. Also shown are the 36 tests results for Lambourn [7] and Donohue [18]. The test data are bounded by the scatter plot data and the range ofS1/2values for the tests increases with fall-over speedVfiin a similar manner to the scatter plot. Figure 5(b) shows the test data, the mean values of S1/2for each test speed group, and the 50 percentile relation for the Monte Carlo simulation.
[image:5.613.77.528.111.169.2]Null hypothesis tests were carried out for each of the five sets of test data using the standard deviation values obtained from the Monte Carlo simulation data distributions ofSandS1/2for each speed. Each of these distributions was shown to be log normal. The t-tests were carried out using the standard deviation values forS,S1/2, and ln(S1/2) respectively. The t values are detailed in Table 3. The highest t value is 0.63.
Table 2 Comparison of measured [8] to calculated slide distances (using equation (4) (subscript ‘eq4’) and the simple slide equation (1) (subscript ‘eq1’))
Test Motorcycle Vfo(m/s) mmeasured
Smeasured
(m) Seq4(m) Seq1(m)
Seq4{Smeas Smeas
Seq1{Smeas Smeas
2 Honda CBR 360 12.19 0.38 16.03 17.03 19.93 6.2% 24.3% 3 Honda CBR 360 17.37 0.36 39.93 38.52 42.72 23.5% 7.0% 4 Suzuki GSX 750 14.33 0.35 26.82 26.46 29.90 21.3% 11.5%
[image:5.613.315.556.189.602.2]The linear regression coefficients for S1/2 versus fall-over velocity Vfi for the test data and Monte Carlo simulation respectively are detailed in Table 4. The values of the slope are 0.351 and 0.357 for the Monte Carlo simulation and test data respectively, a 1.79 per cent difference, while the standard error of the slope value for the test data is 0.02. It can therefore be considered that the model provides a very good fit to the test data.
4 INFERENCES FROM MODEL
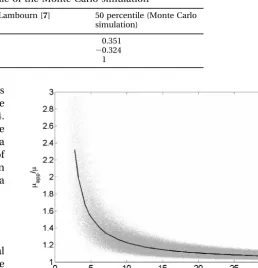
Equation (4) shows that the effect of the initial ground impact is a reduction in subsequent slide distance. Because of this, the apparent coefficient of retardation from the simple slide equation (1) will be greater than the true values. Thus, the apparent coefficient of retardation is high at low speeds and decreases with increasing fall-over speed. Figure 6 shows the scatter plot of the ratio of apparent to actual coefficients of retardation as a function of fall-over speed. At 2.5 m/s (9 km/h) this ratio is 2.40 to 1, reducing to 1.23 to 1 at 10 m/s (36 km/h), while still 1.08 to 1 for a fall-over speed of 25 m/s (90 km/h).
4.1 Deceleration during initial ground impact (and slide)
Further insight into the effect of the initial ground impact can be obtained by considering the vertical acceleration pulse during impact and the conse-quent horizontal deceleration pulse. A half sine pulse has been shown to be a satisfactory represen-tation of impact acceleration pulse in many vehicle applications; refer, for example, to Varat and Husher
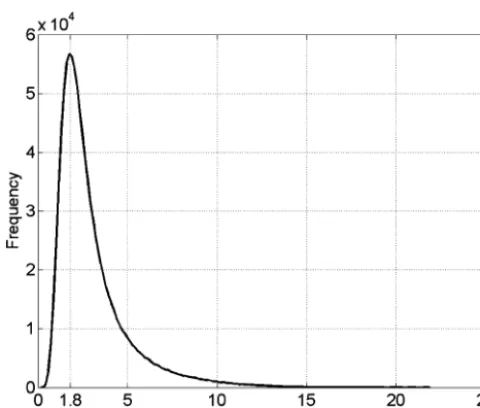
[image:6.613.82.502.120.203.2][19]. Wood and Doody [20] derived the relationships between impact velocity, coefficient of restitution, maximum dynamic deflection, and mean and peak deceleration; refer to Appendix 4. Monte Carlo simulation was carried out using a maximum deflec-tion Cd,max, range from 0.02 to 0.333 m (range of measured distances between tip of handlebars to side of motorcycle, represented as a normal distribution with a mean of 0.177 m and a standard deviation of 0.052 m) and a coefficient of restitutione, range from 0 to 0.3 (represented as a uniform distribution). The simulation shows that the deceleration during initial ground impact is typically 2.57 times the subsequent slide deceleration (mode) and the 95 percentile range is 1.48 to 12.22 to 1. Figure 7 shows the frequency
Table 3 Comparison of the Lambourn [7] and Donohue [18] fall-over tests with the calculated data. Subscript 0 is related to the experimental measures while subscript c is related to the calculated data
Group N V0
(m/s) S¯0(m) S¯c(m) Difference (%)
S S0{SSc
S Sc
tvalues
Using ln(S1/2) UsingS1/2 UsingS
[image:6.613.283.541.241.508.2]1 9 11.17 13.80 13.92 20.85 0.26 0.12 20.02 2 8 15.12 27.41 26.62 2.96 0.63 0.49 0.34 3 3 17.58 34.97 36.49 24.18 20.01 20.11 20.21 4 9 21.19 55.32 54.25 1.98 0.44 0.34 0.22 5 7 25.56 78.60 79.90 21.62 20.03 20.09 20.15
Table 4 Comparison of the regression coefficients performed on the experimental tests and on the 50 percentile of the Monte Carlo simulation
Experimental measures (Lambourn [7] and Donohue [18])
50 percentile (Monte Carlo simulation)
Slope 0.357 0.351
Constant 20.241 20.324
R2 0.906 1
distribution of the peak horizontal deceleration during initial ground impact. The mode is 1.8gwhile the 95 percentile range is 0.87–8.7g.
4.2 ‘Normal’ fall-over – velocity reduction during fall-over,DVf
In many oblique collisions with the fronts of vehicles, the motorcycle is forced into a right angular attitude across the front of the collision partner, similar to a ‘T’-bone collision. Here, as the impacted motorcycle is caused to slide sideways with its tyres remaining in contact with the road, there is a loss of velocity during the fall-over. This loss of velocity,DVf, is attributable to the retarding effect of the friction of the sliding tyres and the vertical reaction force between the tyres and the ground; refer to equation (14) in Appendix 3. Monte Carlo simulation of the fall-over equations was carried out, using a normal motorcycle tyre-to-road friction distribution with a mean of 0.93 and a standard deviation of 0.10 [17]. Figure 8 shows the manner in which this speed loss increases with roll angle. The rapid reduction of the normalized vertical reaction force R/(Mcg) with increasing roll angle is also shown. The 95 percentile range of theDVfspeed loss is 0.22 m/s (0.79 km/h) to 0.80 m/s (2.9 km/h) with a mean speed loss of 0.46 m/s (1.66 km/h).
5 CONFIDENCE LIMITS
5.1 Confidence limit criteria
The degree of certainty needed for speed at fall-over varies since the applications for speed estimates
range from injury research and crashworthiness design to personal injury litigation and criminal prosecution. Simms et al. [21] have previously proposed confidence limit criteria for pedestrian protection distance, and these are adopted in the current paper for motorcycle slide distances.
1. The ‘probable’ range: the 50 percentile range between the lower 25 percentile and the upper 25 percentile limits. There is a 50 per cent likelihood that the motorcycle speed at fall-over is bounded by these limits and a 25 per cent likelihood that the speed would be above or below these values respectively. This range is of value in general injury and traffic safety studies and for civil law where the speed estimate is required to be known ‘on the balance of probability’.
Fig. 7 Frequency distribution of the maximum hor-izontal decelerationaˆhorizontal
[image:7.613.321.553.81.475.2] [image:7.613.54.294.83.287.2]2. The ‘normal’ range: this is the 95 percentile confidence range between the lower and upper 2.5 percentile limits. This range corresponds to the speed range for the majority of cases with only 1 in 40 being either above or below this range respectively.
3. The ‘overall’ range: this is the 99.8 percentile range from the lower 0.1 percentile and the upper 0.1 percentile limits. Here the likelihood of the speed being less than or more than the con-fidence range is 1 in 1000 respectively. The lower limit can be considered to correspond to the stringent requirement of ‘beyond reasonable doubt’ required in criminal law cases.
5.2 Overall values
The Monte Carlo simulation data (1 million runs) for slide distances up to 200 m was divided into slide distance bins, each of width 0.5 m, with data in each bin being statistically analysed and the resulting 0.1, 2.5, 25 percent values of velocity being regressed as a function ofS1/2. The results are detailed in Table 5, for regressions based on the form of equation (4)
Vfiðin m=sÞ~constantzslopeS1=2 ð5Þ
Table 5 details two sets of values for the constant in equation (5). ‘Constant(inl)’ is for ‘inline’ fall-over while ‘constant(nor)’ is for ‘normal’ fall-over.
5.3 Scene tests
An alternative to using the overall coefficient of retardation data is to carry out drag tests of the specific motorcycle on the road where the collision occurred. Lambourn [7] carried out drag tests under various conditions. The difference m2m¯ for indivi-dual results within each test condition was calcu-lated and the overall distribution of m2m¯ was also calculated. The data have a normal distribution with standard deviation of 0.058. Thus, when drag tests are carried out and the meanmvalue calculated from the specific test data, the values shown in Table 6 should be used for the m range. Alternatively the m
range can be computed from the test results using the statistics of small samples.
6 DISCUSSION
6.1 Model development and significance
Many researchers have commented on the manner in which the apparent coefficient of retardation of motorcycles in fall-over and slide (also bounce, tumble, etc.) events increases with reducing motor-cycle velocity at fall-over. Lambourn [7] and Hague [6] proposed that this effect is owing to the initial ground impact, while McNally and Bartlett [8] have estimated the peak horizontal deceleration during their fall-over tests of up to 1.55g. McNally and Bartlett [8] proposed, when using the standard slide equation (1), that higher values of coefficient of retardation be used as slide distance reduces, but do not suggest a rational method for such estimation.
The present paper proposes models where the coefficient of retardation between the motorcycle and road surface depends on the particular motor-cycle and road surface configuration and remains constant from ground contact, including initial contact, to rest. The model explicitly includes the horizontal momentum loss during initial ground impact. The parameters which influence the vertical impact velocity of the motorcycle are centre of gravity heighthcg, roll radius of gyrationkr, width of motorcycle frame/structurefw, and whether the fall-over is the consequence of ‘inline’ fall-fall-over or ‘normal’ fall-over.
[image:8.613.302.542.108.169.2]Application of the model to three tests carried out by McNally and Bartlett [8] shows that the predicted slide distances closely match the experimental values. Further comparison based on Monte Carlo
Table 5 0.1, 2.5 and 25 percentile regression values of velocities regressed as a function ofS1/2
Slope Constant (inl) Constant (nor)
Probable lower range 2.69 0.88 1.50 Probable upper range 3.14 1.23 1.92 Normal lower range 2.22 0.58 1.16 Normal upper range 3.51 1.56 2.45 Overall lower range 2.00 0.44 0.84 Overall upper range 3.67 1.80 2.91
Table 6 Confidence ranges when measuring the coef-ficient of retardation
[image:8.613.78.504.679.754.2]simulation using the statistical distributions of the various motorcycle parameters with 36 fall-over tests at speeds between 11 m/s and 26 m/s, carried out by Lambourn [7] and Donohue [19], and involving three different surface types and five different motor-cycles, shows a high degree of agreement.
Analysis confirms that the apparent coefficient of retardation found using the simple slide model increases with decreasing fall-over speed, initially slowly then rapidly at low fall-over speed, with ratio of apparent to actual coefficient of 1.08 at 25 m/s (90 km/h) and 2.40 at 2.5 m/s (9 km/h). Bartlettet al. [9] reported on 186 fall-over tests involving 58 different motorcycles, which represent typical ‘inline’ fall-over incidents. These tests were carried out for fall-over speeds between 8.9 m/s (32 km/h) and 30 m/s (108 km/h). The reported overall mean value of the coefficient of retardation (i.e. the apparent coeffi-cient from the simple slide equation (1)) was 0.521 with a standard deviation of 0.14. Here, the ratio of
mapp/m is 1.13, yielding a value of 0.46 for the mean ‘actual’ coefficient with a standard error of the mean of 0.01. This compares with the mean value of the coefficient derived in this paper based on analysis of data for Lambourn [7], Carter et al. [3], and Day and Smith [4] of 0.44 with a standard error of mean of 0.009. Null hypothesis analysis shows that there is no significant difference between the two mean values (t51.49).
The dynamics of the initial ground impact were modelled using a half sine pulse and the range of motorcycle parameters based on initial ground impact being the tip of the motorcycle handlebars. Computation of the peak deceleration during initial ground impact yielded a 95 percentile range of 0.87– 8.7gwith a mode of 1.8g. These compare with values reported by McNally and Bartlett [8] of 0.78g, 1.25g, and 1.55g in those tests.
‘Normal’ fall-over occurs when side-struck motor-cycles ‘square up’ to the front of the impacting vehicle and, after impact, have a travel velocity direction ‘normal’ to their longitudinal x–x axis (attitude angleb590u). Analysis of the influence of sideways sliding of the motorcycle shows (see Fig. 8) that 80 per cent of the initial speed loss DVfoccurs within the first 15uof the fall-over, over which range the vertical reaction force at ground contact R reduces to 8 per cent of the static reaction Mcg. Thus the key requirement is tyre-to-ground contact during the initial stages of the fall-over phase.
In this regard, analysis of the fall-over phase indicates that the normalized vertical reaction force at the ground contact can be considered as
decreasing linearly with time over the first 100 ms of fall-over (the overall time to ground contact is typically 350 ms). This approximation yields a cal-culated mean speed loss during fall-over DVf of 0.456 m/s, which compares with the mean speed loss of 0.46 m/s from the Monte Carlo simulation.
The data are for fall-over on dry roads. Golder and Becke [2,5] have carried out tests on both wet and dry roads. They report apparent coefficient of retardation values of broadly similar magnitudes for both surface conditions. However, their minimum values for wet roads are lower than for dry roads.
6.2 Confidence limit values
6.2.1 Intermediate directions
Monte Carlo simulations were used to derive con-fidence limits for motorcycle speed at fall-over for both ‘inline’ fall-over and ‘normal’ fall-over. These form the limits of motorcycle fall-over. For intermediate direc-tions of fall-over relative to the velocity direction of the motorcycle during fall-over, the motorcycle velocity at start of fall-over will be of intermediate magnitude between the two limits. Hence the appropriate values of the ‘constant’ in Table 5 is
ConstantðdiagonalÞ~constantðinlÞ
z constantðnorÞ{constantðinlÞsinð Þb ð6Þ
where b is the attitude angle from the longitudinal axis of the motorcycle.
6.2.2 Scene tests
Research has shown that the coefficient of retarda-tion varies with specific impact configuraretarda-tions and therefore tests at incident scenes using the incident motorcycle may yield more accurate estimates of speed. Analysis of drag tests carried out with specific motorbikes and road surfaces shows that the standard deviation of the coefficient about the corresponding mean value is roughly halved (0.058) compared with the overall data (0.1). Table 6 details the ranges of coefficient values about the mean result obtained for specific tests that should be used for the appropriate confidence limits. When this approach is used, the speed losses during the first two phases of fall-over, DVf and DVi, must also be included. Alternatively, the relevant values of the ‘constants’ detailed in Table 5 can be used.
Here the ‘normal’ limits of uncertainty, i.e. the 95 percentile range, are¡22.5 per cent. By comparison, if the coefficient of retardation is known, for large slide distances the 95 percentile confidence range of the speed estimate is only¡13.3 per cent (based on a mean value of coefficient of retardation 0.44). There-fore, when tests are carried out at incident scenes the resulting speed uncertainty can be reduced by 41 per cent at large slide distances. These benefits diminish with reducing slide distances owing to the influence of the initial ground contact on speed reduction.
7 CONCLUSION
This paper details a new model which represents the motorcycle fall-over and slide event by accounting for the initial motorcycle-to-ground impact and associated horizontal momentum loss in addition to the subsequent slide. The inclusion of the ground impact element has not been previously reported in the literature.
The results using equation (4) match those from experimental tests [7,8,18] and thus indicate that the model can be applied to determine the motorcycle speed at fall-over from the slide distance, obtained in practice from the marks left on the ground. This applies for ‘inline’ fall-over, when the motorcycle falls over at right angles to the direction of travel, and is extended to ‘normal’ fall-over, when the motorcycle and rider are side-struck by the front of a vehicle. All attitudes of the motorcycle between these limits are included. This model explains the loss of velocity by a combination of the loss of momentum during impact with the ground (and during fall-over for the ‘normal’ case) and by the retardation of the motorcycle on the ground when it slides or bounces. Monte Carlo simulations were run using a single range of coeffi-cient of retardation for motorcycles on dry road surfaces, and using typical ranges of values for the motorcycle parameters, confidence limits were de-rived for ‘inline’ and ‘normal’ fall-over. It is shown that the uncertainty range can be reduced in particular cases by taking measurements of hcg and kr on the specific motorcycle and by measuring the actual coefficient of retardation at the scene.
REFERENCES
1 Limebeer, D. J. N. and Sharp, R. S. Single-track vehicle modelling and control – bicycles, motorcycles and models. IEEE Control Systems Magazine, 2006,26(5), 34–61.
2 Becke, M. and Golder, U. Rutschversuche mit Zweira¨dern auf nasser Fahrbahn und auf Gras.
Verkehrsunfall und Fahrzeugtechnik, April 1986, 91–97.
3 Carter, T. J., Enderle, B. E., Gambardella, C. B.,
andTrester, R. J.Measurement of motorcycle slide coefficients. SAE paper 961017, 1996.
4 Day, T. D. and Smith, J. R. Friction factors for motorcycle sliding on various surfaces. SAE paper 840250, 1984.
5 Golder, M. and Becke, M. Rutschverzo¨gerungen von vollverkleideten Motorra¨dern. Verkehrsunfall und Fahrzeugtechnik, September 1990, 237–240.
6 Hague, D.Calculation of speed from motorcycle slide marks – estimation of deceleration rate from pub-lished data.Impact, J. ITAI, Spring 2004,13(1), 10–16.
7 Lambourn, R. F. The calculation of motorcycle speeds from sliding distances. SAE paper 910125, 1991.
8 McNally, B. F.andBartlett, W.Motorcycle sliding coefficient of friction tests.Accid. Reconstr. J., 2007,
17(2), 47–49.
9 Bartlett, W., Baxter, A.,andRobar, N.Motorcycle slide-to-stop tests: I.P.T.M. Data through 2006. Accid. Invest. Q., 2007,46, 18–20.
10 Searle, J.The physics of throw distance in accident reconstruction. SAE paper 930659, 1993.
11 Wood, D. P.andWalsh, D. G.Pedestrian forward projection impact. Int. J. Crashworthiness, 2002,
7(3), 285–306.
12 Foale, T.Motorcycle handling and chassis design – the art and science,2nd edition, 2006 (Tony Foale Designs, Spain).
13 Weir, D. H. Motorcycle handling dynamics and rider control and the effect of design configuration on response and performance. Doctoral Thesis, University of California, Los Angeles, 1977.
14 Sharp, R. S. The stability and control of motor-cycles.Proc. Instn Mech. Engrs, Part C: J. Mechan-ical Engineering Science, 1971,13(5), 316–329.
15 Cossalter, V., Doria, A.,andMitolo, L.Inertial and mechanical properties of racing motorcycles. SAE paper 2002-01-3347, 2002.
16 Verma, M. K., Segel, L., Sayers, M., Winkler, C. B.,
and Watanabe, Y. A study of the free-control dynamics of single-track vehicles. Report UM-HSRI-77-47, University of Michigan, 1977.
17 Collins, J. C.Accident reconstruction, 1979 (Charles C. Thomas, Springfield, Illinois).
18 Donohue, M. D.Motorcycle skidding and sideways sliding tests.Accid. Reconstr. J., 1991,3(4), 43.
19 Varat, M. S. and Husher, S. E. Vehicle impact response analysis through the use of accelerometer data. SAE paper 2000-01-0850, 2000.
20 Wood, D. P.andDoody, M.Improving the safety of small cars. In Proceedings of the International Sym-posium on Measurement Technology and Intelligent Instruments, China, 29 October–5 November 1993.
21 Simms, C. K., Wood, D. P., and Walsh, D. G.
APPENDIX 1
Notation
a¯,aˆ mean and peak horizontal decelera-tions during impact respectively Cd,max maximum crush depth at impact
d half the lamina depth
e coefficient of restitution
fw frame width
hcg height of motorcycle centre of gravity above ground
kr roll radius of gyration of the motorcycle
Mc motorcycle mass
R reaction force on the ground
S slide distance
T overall duration pulse
Vc vertical velocity at first impact on the ground
Vfi horizontal travel velocity of motorcycle at start of fall-over x motorcycle longitudinal axis
y vertical downwards axis
z motorcycle transverse axis
b angle of the horizontal velocity vector from the longitudinal axis of the motorcycle (attitude angle)
DVf speed loss during the fall-over to side phase
DVi speed loss during the initial ground impact phase
DVs speed loss during the slide or bounce to rest phase
m¯ mean coefficient of retardation
m coefficient of retardation during the slide phase
mapp ‘apparent’ coefficient of retardation, derived using equation (1)
mtyre coefficient of friction of the tyres on the ground
w roll angle during fall-over
v angular velocity during fall-over
Subscripts
inl inline
nor normal
APPENDIX 2
The following derivation is for the ‘inline’ fall-over case. Assuming the motorcycle is falling over (see Fig. 2) and that there is no slip between the motor-cycle’s tyres and the ground, applying Newton’s Second Law gives
Mc k2rzh2cg
€ w
w~Mcghcgsinð Þw ð7Þ
which reduces to
€ w
w~ hcgg
k2 rzh2cg
!
sinð Þw ð8Þ
However
€ w w~d
_ w w
dt~ dww_
dw
dw
dt~
_ w wd _ w w
dw ð9Þ
Therefore
_ w
wdww_~ hcgg k2
rzh2cg !
sinð Þw dw ð10Þ
Integrating with respect tow yields to
1 2
_ w
w2~ hcgg k2
rzh2cg !
cosð Þw
½ wm
0 ð11Þ
_ w
w2~2 hcgg k2
rzh2cg !
1{cosðwmÞ
ð Þ ð12Þ
The anglewm at impact is
wm~
p
2{tan 1=2fw
hcg %p 2{ fw 2hcg Considering that
cosðwmÞ~sin fw 2hcg
% fw
2hcg
a simplified expression of the vertical velocity Vcat impact is
Vc~hcgww_~ 2ghcg{gfw 1z krhcg2 " #1=2
[image:11.613.55.566.106.765.2]APPENDIX 3
The analysis performed by Wood and Walsh [11] on a pedestrian is similar to the following one for a motorcycle impacted on its side (‘normal’ fall-over). Applying Newton’s Second Law in the horizontal direction yields
€
x
x~{mtyre R Mc
_
x
x{ww_hcgcosð Þw
_
x
x{ww_hcgcosð Þw 0
@
1
A ð14Þ
The bracketed term is included to account for the direction in which the friction force acts. The friction force can, under some circumstances, change direc-tion as the motorcycle falls over. This will only occur at low speeds and low values ofmtyre.
Applying Newton’s Second Law in the vertical direction yields
€
yy~g{ R
Mc ð15Þ
Application of the analogous rotational version of Newton’s Second Law reveals
€ w w~ R
Mc hcg
k2 r
sinð Þw zm tyre
R Mc
hcg k2
r
cosð Þw ð16Þ
It should be noted that R, the reaction force on the ground, is a function of the angle of inclination of the rod,w.
Applying a constraint on the motion of the motorcycle such that the base of same must remain in contact with the ground yields the following constraint equation
€
yy~€wwhcgsinð Þw zww_2hcgcosð Þw ð17Þ
This allows the rotational acceleration to be ex-pressed as
€ w w~
h2 cg
. k2
r g
hcg{ww_2cosð Þw
h i
sinð Þw zm
tyrecosð Þw
h i
h2 cg
. k2
rsinð Þw sinð Þw zmtyrecosð Þw
h i
z1
n o
ð18Þ
This equation is highly non-linear and was solved using numerical analysis methods.
APPENDIX 4
Using a half-sine deceleration pulse model, it has been shown [20] that the crush depth Cd,max, pulse duration T, and deceleration a, during impact are related by the following relations
Cd,max~ VcT
2p 2e
1=2zð1{eÞcos{1 e{1 ez1
ð19Þ
which leads to
T~ 2pCd,max
Vcf2e1=2zð1{eÞcos{1½ðe{1Þ=ðez1Þg ð20Þ
while the mean decelerationa¯during impact is
a
a~ð1zeÞVc
T ð21Þ
The peak decelerationaˆ is related toa¯ by
^
a a~p
2aa ð22Þ