PLEASE SCROLL DOWN FOR ARTICLE
This article was downloaded by: [University of Southampton]
On: 26 May 2010
Access details: Access Details: [subscription number 908420906]
Publisher Taylor & Francis
Informa Ltd Registered in England and Wales Registered Number: 1072954 Registered office: Mortimer House,
37-41 Mortimer Street, London W1T 3JH, UK
Combustion Theory and Modelling
Publication details, including instructions for authors and subscription information:
http://www.informaworld.com/smpp/title~content=t713665226
The effect of oxygen starvation on ignition phenomena in a reactive solid
containing a hot-spot
A. Shahab; A. Mcintoshb; J. Brindleya; J. Griffithsc; M. Pourkashanianb
a Department of Applied Mathematics, University of Leeds, Leeds, UK b Department of Fuel and
Energy, University of Leeds, Leeds, UK c Department of Chemistry, University of Leeds, Leeds, UK
Online publication date: 17 July 2003
To cite this Article Shah, A. , Mcintosh, A. , Brindley, J. , Griffiths, J. and Pourkashanian, M.(2003) 'The effect of oxygen
starvation on ignition phenomena in a reactive solid containing a hot-spot', Combustion Theory and Modelling, 7: 3, 509 — 523
To link to this Article: DOI: 10.1088/1364-7830/7/3/304
URL: http://dx.doi.org/10.1088/1364-7830/7/3/304
Full terms and conditions of use: http://www.informaworld.com/terms-and-conditions-of-access.pdf
This article may be used for research, teaching and private study purposes. Any substantial or systematic reproduction, re-distribution, re-selling, loan or sub-licensing, systematic supply or distribution in any form to anyone is expressly forbidden.
Combust. Theory Modelling7(2003) 509–523 PII: S1364-7830(03)57258-8
The effect of oxygen starvation on ignition phenomena
in a reactive solid containing a hot-spot
A Shah1,2, A Mcintosh2, J Brindley1, J Griffiths3and M Pourkashanian2
1Department of Applied Mathematics, University of Leeds, Leeds LS2 9JT, UK
2Department of Fuel and Energy, University of Leeds, Leeds LS2 9JT, UK
3Department of Chemistry, University of Leeds, Leeds LS2 9JT, UK
Received 6 December 2002, in final form 23 April 2003 Published 17 July 2003
Online atstacks.iop.org/CTM/7/509
Abstract
In this paper, we explore the effect of oxygen supply on the conditions necessary to sustain a self-propagating front from a spherical source of heat embedded in a much larger volume of solid. The ignition characteristics for a spherical hot-spot are investigated, where the reaction is limited by oxygen, that is, reactant + oxygen→ product. It is found that over a wide range of realistic oxygen supply levels, constant heating of the solid by the hot-spot results in a self-propagating combustion front above a certain critical hot-spot power; this is clearly an important issue for industries in which hazard prevention is important. The ignition event leading to the formation of this combustion wave involves an extremely sensitive balance between the heat generated by the chemical reaction and the depletion of the reactant. As a result, for small hot-spot radii and infinite oxygen supply, not only is there a critical power above which a self-sustained combustion front is initiated there also exists a power beyond which no front is formed, before a second higher critical power is found. The plot of critical power against hot-spot radius thus takes on a
Z-shape appearance. The corresponding shape for the oxygen-limited reaction is qualitatively the same when the ratio of solid thermal diffusion to oxygen mass diffusion (N) is small and we establish critical conditions for the initiation of a self-sustained combustion front in that case. AsN gets larger, while still below unity, we show that theZ-shape flattens out. At still larger values of N, the supercritical behaviour becomes increasingly difficult to define and is supplanted by burning that depends more uniformly on power. In other words, the transition from slow burning to complete combustion seen at small values ofNfor some critical power disappears. Even higher values ofN lead to less solid burning at fixed values of power.
1364-7830/03/030509+15$30.00 © 2003 IOP Publishing Ltd Printed in the UK 509
1. Introduction
Recent works, reported by Brindleyet al[1–3], have studied the effect of a constant source of heat on a reactive solid X, where the reaction was assumed to be of the form
X→product. (1)
In this paper, we extend this work by introducing an oxidant O into the reaction scheme
X + O→product, (2)
which is required to diffuse into the porous matrix of the solid X. The background and partly the motivation for this, as in the original studies [1–3], is the exothermic degradation and subsequent ignition of combustible solids such as bulk powders and coal dust (occurring, e.g. in many operations in the process control industry) if they are inadvertently exposed to thermal energy. Equipment such as blenders, mills and screw feeders can develop localized heat sources from mechanical impact or failure of a component such as a bearing. Power cables that have suffered local damage may also be a source. The source of heat, or ‘hot-spot’, would almost invariably cause local destruction through slow local combustion, and one issue is the extent to which the degradation penetrates the surrounding material. Alternatively, it may initiate a self-propagating combustion wave (which implies virtually total loss of the product) and possibly lead to some greater catastrophe such as fire or explosion. Clearly, an understanding of the conditions under which thermal decomposition occurs and the extent of the decomposition are crucial in hazard prevention. More generally, we are interested in understanding the ignition, intended or otherwise, of reactive solids by nearby heating sources and its dependence on a limited oxygen supply.
Some of the issues mentioned above have been considered previously. For example, in [4, 12], the authors focus on predicting the critical initial conditions for the safe storage of potentially exothermic materials; a study of spontaneous ignition. On the other hand, the characteristics and properties of a fully developed combustion wave have been addressed in, amongst others [5, 9, 10]. In this paper, we are concerned primarily with the criteria for the onset of ignition, with particular emphasis on low exothermicity materials and in circumstances in which the ingress of oxygen may be restricted.
Analytical progress in describing the ignition event using the equation in [1] has proved to be far from straightforward, even in the simpler model. Although first Linan and Williams [7], and then Kapila [6] (see also [11]), have developed an asymptotic theory for the ignition of a solid subjected to a constant heat flux, they have done so either without reactant consumption (the former) or by inferring results from the gaseous case (the latter), and in both cases the geometry was planar. The presence of reactant consumption and the spherical geometry introduce further significant complications.
Both size and shape are of particular significance in this problem, and in an earlier work [2] we have established that full non-dimensionalization is not viable. However, the dynamics of development of combustion are such that, beyond a certain condition, there is little sensitivity to the outer boundary, but it is necessary to define the absolute size of the hot-spot.
In this paper, we are stressing the three-dimensionality of the system that is simply represented by the spherical geometries of both the hot-spot and the reactant mass. We believe that all sufficiently large three-dimensional volumes will exhibit the behaviour discussed in [1] and illustrated in figure 1. The effect of the distant boundary is not felt in the initial stages. Experimental evidence suggests that in cubes of non-spherical form, the evolution from an internal hot-spot shows a strong degree of spherical symmetry.
For simplicity, and as in [1], we assume that both the reactant material and the hot-spot are spherical, the latter placed at the centre of the former, and that the fully burnt material
occupies the same volume and has the same characteristics as the unburnt material. The latter assumption is important to this work. We are assuming that there is no change of phase and that the product is a solid of a similar density to that of the reactant. The surface of the hot spot,r=r0, is assumed to be a constant source of heat fluxP˜, with corresponding total power p=4π r02P˜W.
The following terminology, having originated in earlier works [1–3], is used throughout. • A situation where a self-sustained combustion wave is initiated is termed supercritical. All other situations are termed subcritical. It will be clear from comparing examples of these two behaviours in section 3 that the two cases are readily distinguished. In particular, the supercritical behaviour leads to a self-sustained combustion front, and eventually to complete burning of the material (except for a small boundary layer near the outer surface of the fuel, for the reason explained in section 2) in a relatively short period of time (from the point of initiation of the wave). Furthermore, the evolution of the profiles for temperature and fuel density are very different.
• For a given hot-spot sizer0, we term a region inP˜space safe if for all values ofP˜in this region only the subcritical behaviour is found.
2. Mathematical model
The governing equations, assuming spherical symmetry with radial coordinaterand timeτ, can be written as follows:
ρCp
∂T ∂τ −
λ r2
∂ ∂r
r2∂T
∂r
=QAXYe−E/RT,
∂Y ∂τ −
DY
r2 ∂ ∂r
r2∂Y
∂r
= −AXYe−E/RT,
∂X
∂τ = −AXYe
−E/RT,
(3)
in whichT is the temperature of the solid, andXandY are the densities of the reactant and oxygen, respectively. It is assumed that the reactant diffusion coefficient is negligibly small, as is usually the case with solids. We also assume that the heat transfer rate between the solid and the gas is sufficiently large to adopt the same temperature field for both. The other quantities appearing in (3) are defined in table 1. The boundary conditions for temperature are
T (r1, τ )=Ta, (4a)
−λ∂T
∂r(r0, τ )= ˜P , (4b)
corresponding to a total heat fluxP˜ across the surface of the hot-spotr = r0, and ambient conditions at the outer edge of the solidr=r1. For the oxygen density we have
Y (r1, τ )=Ya,
∂Y
∂r(r0, τ )=0, (5)
whereYais the initial oxygen density given in table 1.
(a) It is important to note that boundary condition (4a) means that the reaction is always very slow at the boundaryr = r1, so that in reality there is always a thin boundary layer of incomplete combustion near that surface. This boundary condition is commonly used in these problems and represents an infinite Biot number condition. Thus, when we refer to complete burning or complete burnout of the fuel in what follows (see also the definitions
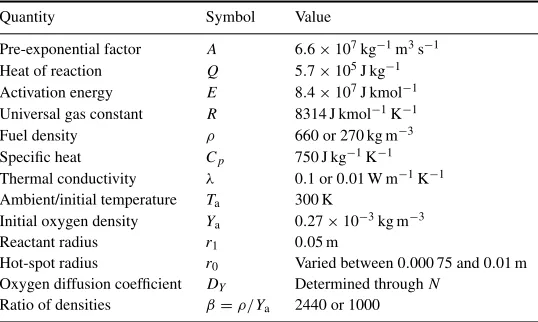
Table 1.Values for quantities used in the calculations.
Quantity Symbol Value
Pre-exponential factor A 6.6×10⁷kg−1m3s−1
Heat of reaction Q 5.7×10⁵J kg−1
Activation energy E 8.4×10⁷J kmol−1
Universal gas constant R 8314 J kmol−1K−1
Fuel density ρ 660 or 270 kg m−3
Specific heat Cp 750 J kg−1K−1
Thermal conductivity λ 0.1 or 0.01 W m−1K−1
Ambient/initial temperature Ta 300 K
Initial oxygen density Ya 0.27×10⁻³kg m−3
Reactant radius r1 0.05 m
Hot-spot radius r0 Varied between 0.000 75 and 0.01 m
Oxygen diffusion coefficient DY Determined throughN
Ratio of densities β=ρ/Ya 2440 or 1000
in section 1), we mean that all but a thin layer nearr =r1 of the fuel has been consumed. Boundary condition (4b) is the simplest boundary condition possible and we acknowledge that it is possible to have a condition in which some leakage of the oxygen into the hot-spot takes place. Finally, the initial conditions are given by
T (r,0)=Ta, X(r,0)=ρ, Y (r,0)=Ya. (6)
We nondimensionalize the variables by rescaling as follows:
u= RT
E , y = Y Ya
, x= X
ρ, ξ = r r1
, t = λτ ρCpr12
,
q= QR ECp
, a= AYaρCpr 2 1
λ , β =
ρ Ya,
N= λ YaCpDY
, α=P Rr˜ 1
λE , ua= RTa
E .
(7)
The result of substituting (7) into (3)–(6) is
∂u ∂t − 1 ξ2 ∂ ∂ξ ξ2∂u
∂ξ
=qaxye−1/u,
∂y ∂t − β N 1 ξ2 ∂ ∂ξ ξ2∂y
∂ξ
= −aβxye−1/u,
∂x
∂t = −axye
−1/u
(8)
and
∂u
∂ξ +α=0,
∂y
∂ξ =0 atξ =ξ0, u(1, t )=ua, y(1, t )=1,
u(ξ,0)=ua, x(ξ,0)=1, y(ξ,0)=1.
(9)
2.1. Remarks concerningNandβ
By choosingN small enough, the system (8) and (9) is equivalent to the one-reactant system considered [1]. Thus, we note that the oxygen equation, asN →0, is given by
1 ξ2
∂ ∂ξ
ξ2∂y
∂ξ
=O(N )1, (10)
when all other parameters are fixed. The solution to (10), subject to the boundary conditions, is y=1+O(N ), and thus in this important limit oxygen has a negligible effect on the calculations. It is found that the parametersβ =ρ/YaandN are crucial for the calculations. We fix β at a realistic value and allowN to vary between 0 and 10. The latter value represents an upper bound on the realistic values ofN, which we expect most likely to be around unity in real situations.
To calculateβ we note that the density of oxygenYais (from the ideal gas law) given byWO2PO2/RT, whereWO2andPO2 are the molecular mass and partial pressure of oxygen,
respectively. Hence, for atmospheric pressureYais 0.27 kg m−3(assumingPO2is 0.21×10
5Pa
andWO2 is 32 kg kmol−
1). Withρ =660 kg m−3, we getβ ≈2440. However, for a lighter
fuel density of 270 kg m−3, we getβ ≈ 1000. We have performed a number of numerical experiments forβ =2440, but also include some cases ofβ =1000. We have also performed a separate numerical experiment for a different value of the thermal conductivityλ, for it is important to realize that packing of powders strongly influences the effective thermal heat transfer.
The initial boundary problem was solved in Fortran using routines from the NAG Library. In the calculations, the number of grid points was typically around 2000 and the time-step varied depending on the stiffness of the finite-differenced system.
3. Results
Unless otherwise stated, we use r1 = 0.05 m. Changingr1 did not qualitatively alter the results. Furthermore, the results are presented in dimensional form, although in future work it is planned to repeat many of the calculations in dimensionless form to study the effect of scale. This is discussed further below.
3.1. SmallN
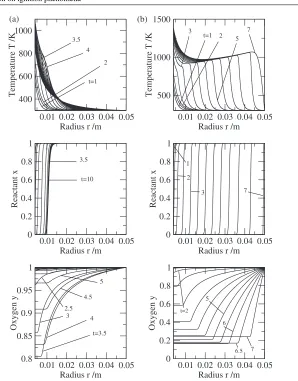
In figures 2–5, we show the values of the dimensional temperature,T, and the dimensionless values of the reactant concentrations,x andy. This makes the profiles clearer and easier to understand.
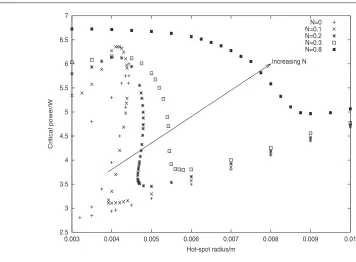
The results for smallN in the oxygen-limited model (8) and (9) can be summarized in figure 1, which shows the critical values of power required to initiate self-sustained combustion against hot-spot radius. ForN below 0.3, the results do not differ quantitatively from those of [1]. Consider the caseN = 0.1. Abover0 ≈ 0.0044 m there is a well-defined cut-off between supercritical and subcritical behaviours. Forr0 = 0.004 m, in the subcritical case (figure 2(a)), the oxygen mass fraction remains almost constant around unity, aftert =5 min, and the degradation of the material is confined to around 0.01 m att=10 min (att =100 min the burning only reachesr = 0.013 m). In contrast, at a slightly higher value of power (figure 2(b)), the temperature profiles indicate clearly that a self-sustained combustion wave has been initiated leading to complete burnout (except, as mentioned, at the outer boundary of the material).
2.5 3 3.5 4 4.5 5 5.5 6 6.5 7
0.003 0.004 0.005 0.006 0.007 0.008 0.009 0.01
Critical power/W
Hot-spot radius/m
[image:7.595.109.465.83.345.2]Increasing N N=0 N=0.1 N=0.2 N=0.3 N=0.8
Figure 1. The critical power curves for an increasing range ofN. AsN is increased, the
‘Z-shape’ behaviour disappears. The parameter values used here areρ=660 kg m−3,β=2440
andλ=0.1 W m−1K−1. Compare the curveN=0.1 (‘×’) with figure 6, whereρ=270 kg m−3,
β = 1000 andλ = 0.1 W m−1K−1, and figure 7, whereρ = 660 kg m−3, β = 2440 and
λ=0.01 W m−1K−1.
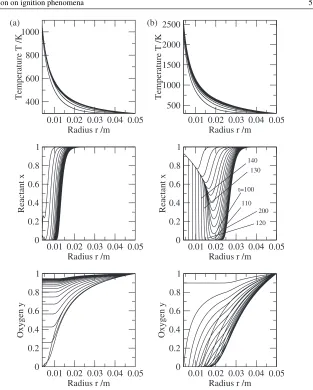
The decomposition of the reactant occurs adjacent to the heat source at the initial stages in figure 2(a), whereP =3.1 W. The rate of decomposition, however, slows down significantly beyondt ≈3.5 min, which is also the time at which the temperature at the surface of the hot-spot begins to fall. Ultimately, the combustion front comes almost to a stop before the material is completely burnt through. In sharp contrast to this behaviour, atP =3.11 W (figure 2(b)), combustion becomes self-sustained not long aftert = 3 min, leading to the burnout of the material. The predicted duration time for complete combustion is around 7 min (except for a small boundary layer at the edge of the material (r=r1) where the boundary conditionT =Ta exists, so that in that small region there is always incomplete combustion). In this example, the critical power for complete combustion to occur is 3.105±0.05 W. If a small enough ratioN is assumed, the result would be identical to that for the one-reactant case, discussed in [1–3]. As we increase the hot-spot radius, we find that the time required to initiate the supercritical behaviour increases and the speed of the subsequent combustion wave is lower. This can be seen by comparing figure 2 with figures 3 and 4, the latter two being forr0 =0.006 m and r0=0.01 m, respectively. For 0.003 85< r0<0.0044, there exists an apparently ‘safe’ region between two critical powers. In this region, the subcritical behaviour prevails. However, as we increase the power within this safe region, more reactant is consumed before the burning stops. We also found instances in which the supercritical behaviour is initiated at the second or third attempt (the burning appears to accelerate for a short period only to slow down before it once again accelerates and forms a self-sustained wave—see earlier definitions of the terms ‘subcritical’ and ‘supercritical’ in section 1). This could well be related to the oscillatory burning of solids.
0.01 0.02 0.03 0.04 0.05 Radius r /m 400
600 800 1000
Temperature T /K
0.01 0.02 0.03 0.04 0.05 Radius r /m 500
1000 1500
Temperature T /K
0.01 0.02 0.03 0.04 0.05 Radius r /m 0 0.2 0.4 0.6 0.8 1 Reactant x
0.01 0.02 0.03 0.04 0.05 Radius r /m 0 0.2 0.4 0.6 0.8 1 Reactant x
0.01 0.02 0.03 0.04 0.05 Radius r /m 0.8 0.85 0.9 0.95 1 Oxygen y
0.01 0.02 0.03 0.04 0.05 Radius r /m 0 0.2 0.4 0.6 0.8 1 Oxygen y
[image:8.595.149.447.81.462.2]t=1 2 5 7 3.5 4 t=1 2 t=3.5 4 (a) (b) 1 2 3 7 3 t=2 7 6.5 6 5 t=10 3.5 3 2.5 4.5 5
Figure 2.Subcritical behaviour (a)P=3.1 W and supercritical behaviour, (b)P =3.11 W for
N=0.1 andr0 =0.004 m. In (a) profiles are shown every 0.5 min up tot =10 min and in (b)
profiles are shown every 0.5 min up tot=7 min.
Returning to figure 1 and comparing the critical curve forN =0.1 with the one-reactant curve, we see a narrowing of the range of hot-spot radius in which the safe region appears. The narrowing of the region increases as we increaseN. In addition, the curves appear to flatten out and byN=0.3 we see that the safe region disappears altogether. WhenN reaches unity, the supercritical behaviour itself disappears (discussed later).
IncreasingN, and thereby decreasing the oxygen diffusivityDY, makes it more difficult
for the oxygen to diffuse to regions where it has depleted. This, in turn, would make it more difficult to sustain combustion. This is partly what we observe in figure 1. As we increaseN, the critical curve gets higher on both sides of the region where multiple critical powers are found, indicating that a higher critical power is required for a fixed hot-spot radius. However, in the region with multiple critical powers, this trend is not followed. Furthermore, we found that forNclose to unity it is no longer possible to define a critical power curve (see later). This change in behaviour is partly explained by the balance of terms in oxygen equation (8). We can predict a change in behaviour when the diffusion term (coefficientN) reaches the same order
0.01 0.02 0.03 0.04 0.05 Radius r /m 300
400 500 600 700 800
Temperature T /K
0.01 0.02 0.03 0.04 0.05 Radius r /m 400
600 800 1000 1200
Temperature T /K
0.01 0.02 0.03 0.04 0.05 Radius r /m 0
0.2 0.4 0.6 0.8 1
Reactant x
0.01 0.02 0.03 0.04 0.05 Radius r /m 0
0.2 0.4 0.6 0.8 1
Reactant x
0.01 0.02 0.03 0.04 0.05 Radius r /m 0.94
0.95 0.96 0.97 0.98 0.99 1
Oxygen y
0.01 0.02 0.03 0.04 0.05 Radius r /m 0
0.2 0.4 0.6 0.8 1
Oxygen y
t=11.5
[image:9.595.134.453.77.473.2](a) (b)
Figure 3.Subcritical behaviour (a)P=3.57 W tot=50 min in steps of 2.5 min and supercritical
behaviour (b)P=3.58 W tot=11.5 min in steps of 0.5 min forN=0.1 andr0=0.006 m.
of magnitude as the reaction rate. At this point, we can expect the (increased) depletion rate of oxygen to become dominant, and thus become the reaction-rate limiting process.
Figure 1 shows that the restriction on oxygen diffusion asNincreases from zero does not alter the overall character of the ignition behaviour, particularly for smallr0. But nearN =0.3 the character is finally affected, in that the switch-off behaviour disappears.
3.2. Napproaching unity and beyond
AsN moves close to unity, it becomes more difficult to define the transitional behaviour between the sub- and supercritical behaviours seen at smallN. It is likewise difficult to say where this behaviour occurs, but in both cases (β = 2440 andβ = 1000) the transitional behaviour is still seen at N = 0.9 and not at N = 1.1. Consider N = 0.9, where the burning of the solid material is strongly controlled by the oxygen supply. For small hot-spot powers the subcritical behaviour prevails. At the critical power, it is seen that the oxygen
0.01 0.02 0.03 0.04 0.05 Radius r /m 300
400 500 600 700
Temperature T /K
0.01 0.02 0.03 0.04 0.05 Radius r /m 400
600 800 1000 1200
Temperature T /K
0.01 0.02 0.03 0.04 0.05 Radius r /m 0
0.2 0.4 0.6 0.8 1
Reactant x
0.01 0.02 0.03 0.04 0.05 Radius r /m 0
0.2 0.4 0.6 0.8 1
Reactant x
0.01 0.02 0.03 0.04 0.05 Radius r /m 0.985
0.99 0.995 1
Oxygen y
0.01 0.02 0.03 0.04 0.05 Radius r /m 0
0.2 0.4 0.6 0.8 1
Oxygen y
t=29
t=50
[image:10.595.154.452.77.471.2](a) (b)
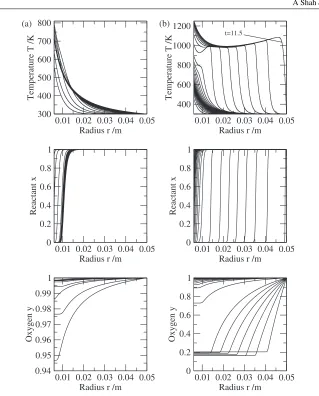
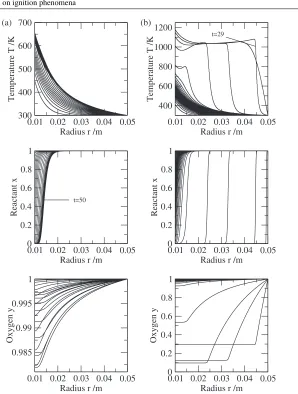
Figure 4.Subcritical behaviour (a)P=4.65 W tot=50 min in steps of 2.5 min and supercritical
behaviour (b)P=4.75 W tot=30 min in steps of 1 min forN=0.1 andr0=0.01 m.
initially depletes too rapidly to sustain combustion, allowing it to diffuse back to the reaction zone from the outer boundary, at which time the reaction begins again and the burning of the solid goes to completion. In the subcritical cases, the same behaviour is seen except that the reaction is not continued when the oxygen diffuses back from the boundary. ForN > 0.9, the ‘critical’ power required to bring about the burning after the oxygen diffuses back from the outer boundary becomes increasingly larger. There is, correspondingly, an increasingly smaller difference between the degree of burning for values just above and just below this ‘critical’ value. Therefore, it is no longer feasible to talk of transition (and a critical power) from slow burning to self-sustained complete burning. In what follows, forNclose to unity, it becomes evident that the characteristics of the solutions change, such that whether the reaction is sub- or supercritical is no longer the issue, but rather the extent of burning.
For such values ofN(close to unity):
(i) an increasingly larger power is required to achieve the same degree of reactant depletion; (ii) self-sustained propagation is not possible;
Table 2.The depth of burnt productrbin metre forN=1.2 when the hot-spot radius is varied.
Power (W) r0=0.01 m r0=0.008 m r0=0.006 m r0=0.004 m
4 0.008 18 0.008 09 0.007 93 0.007 85
5 0.010 52 0.010 36 0.010 11 0.009 33
6 0.019 05 0.016 30 0.015 06 0.014 77
7 0.035 41 0.020 24 0.018 82 0.017 80
8 0.041 47 0.038 51 0.037 83 0.037 25
(iii) the temperature profiles do not exhibit the abrupt change in behaviour seen in figures 2(b) and 3(b).
In this regime, the extent and rate of reaction is dependent on power and hot-spot size. In table 2, the depth of burning,rb, is given forr0between 4 and 0.01 m as the power was varied between 4 and 8 W, whererbmeasures the position of the midpoint (x =0.5) of the reactant profile at timet =200 min.
At fixedr0, we find thatrbincreases significantly afterP =5 W, although, if we examined the solution profiles at different times, it would be evident that there is no qualitative change in the type of combustion. In all cases, burning is almost complete byP =8 W, and as we increaser0we need to slightly decrease the power to obtain this state.
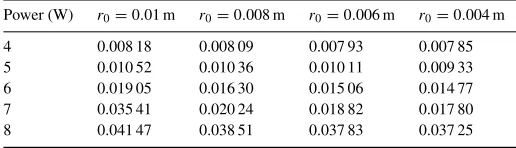
The further we increaseN, the more difficult it becomes to achieve complete burning at fixed values ofr0, commensurate with a restriction on oxygen diffusion. However, at around N = 8 we find an additional behaviour for large powers, an example of which is shown in figure 5. In figure 5(b), the reactant is completely burnt in the range 0.016 < r < 0.02 but only partially burnt in 0.004< r <0.016 whent =120 min. A large power seems to cause quick burning of the solid and complete depletion of the oxygen around the hot-spot in the initial stages. Since the diffusion of coefficient of oxygenDY is relatively low due to our
choice ofN, the oxygen cannot reach the partially burnt solid to complete the burning, and therefore the combustion front advances toward the unreacted oxygen. It further seems that somewhere aroundt = 120 min a balance is reached whereby the combustion front cannot advance further due to the cool boundary atr=r1. At this time, the consumption of oxygen in the vicinity of the combustion front slows down sufficiently to allow the oxygen to diffuse back to the hot-spot boundary, allowing complete combustion of the partially burnt solid between r0and the front. Table 3 shows the depth of burningrbfor various hot-spot sizes asP is varied between 6 and 24 W. Here,rb measures the position ofx = 0.5 at timet = 200 min. The value ofrbseems to be insensitive to the hot-spot size and complete burning is only possible for very large values ofP. However, for reasonable values ofP (around 10 W) we find that approximately half of the solid (a significant portion) is burnt.
One final note is that the calculations revealed a continuum of wave velocities from that determined only by the solid reaction (N = 0) to that which is strongly limited by oxygen availability (N →1). These velocities are difficult to quantify precisely, but the calculations indicate that the combustion wave velocity is reduced by the restriction of oxygen supply.
3.3. On the effect of the thermal conductivity and the density of the solid
In many of the potential applications of this work, the solid is a particulate material with a relatively low density. Sawdust, for example, has a density of around 270 kg m−3, and we have, therefore, performed some calculations for this value of solid density. In using this value of density, it is necessary to change the value ofβ=ρ/Yato aroundβ =1000. Figure 6 shows the critical power curve for the aforementioned values (with all other quantities as before) with
0.01 0.02 0.03 0.04 0.05 Radius r /m 400
600 800 1000
Temperature T /K
0.01 0.02 0.03 0.04 0.05 Radius r /m 500
1000 1500 2000 2500
Temperature T /K
0.01 0.02 0.03 0.04 0.05 Radius r /m 0
0.2 0.4 0.6 0.8 1
Reactant x
0.01 0.02 0.03 0.04 0.05 Radius r /m 0
0.2 0.4 0.6 0.8 1
Reactant x
0.01 0.02 0.03 0.04 0.05 Radius r /m 0
0.2 0.4 0.6 0.8 1
Oxygen y
0.01 0.02 0.03 0.04 0.05 Radius r /m 0
0.2 0.4 0.6 0.8 1
Oxygen y
t=100
110
120
130
140
200
[image:12.595.146.459.77.467.2](a) (b)
Figure 5.Solution up tot=200 min in steps of 10 min for (a)P=4 W and (b)P=12 W when
N=10 andr0=0.004 m.
Table 3.The depth of burnt productrbin metre forN=10 when the hot-spot radius is varied.
Power (W) r0=0.01 m r0=0.008 m r0=0.006 m r0=0.004 m
6 0.018 23 0.018 57 0.018 54 0.018 52
12 0.027 01 0.027 46 0.027 39 0.027 38
18 0.032 98 0.033 09 0.033 10 0.033 10
24 0.035 35 0.035 57 0.035 57 0.035 57
N =0.1. Comparing this curve with the curves in figure 1, it is seen that the basic ‘Z-shape’ (for small enough values ofNon the latter) is preserved. However, there are some differences that could be of importance. Comparing figure 6 with the corresponding (N =0.1) curve on figure 1, we see that ‘switch-off’ behaviour (multiple critical powers) occurs at larger values of hot-spot radius. The other difference is that the size of the power required to switch off the
[image:12.595.155.413.534.597.2]4 5 6 7 8 9 10
0.004 0.005 0.006 0.007 0.008 0.009 0.01
Critical Power/W
[image:13.595.104.465.81.344.2]Hot spot radius/m
Figure 6. The critical power curve forN = 0.1, withλ = 0.1 W m−1K−1, β = 1000
andρ = 270 kg m−3. Compare this curve with theN = 0.1 (‘×’) curve in figure 1, where
ρ=660 kg m−3,β=2440 andλ=0.1 W m−1K−1.
combustion wave and to switch it back on is greater; that is, the upper two branches of the curve are higher in figure 6.
The thermal conductivity of the solid can be determined by its packing density. To gain some idea of the effect of the packing density on the ignition behaviour we have also performed some calculations forλ=0.01 W m−1K−1, while keepingβ =2440 (and therefore ρ=660 kg m−3), again withN =0.1. The critical power curve for these values is shown in figure 7. In contrast to figure 6, we find that the switch-off behaviour now occurs at smaller hot-spot sizes and, in general, combustion waves are initiated at much lower values of power than forλ=0.1 W m−1K−1. From the work in [8], the lower branch of the critical curve can be approximated by the formulaP =4π r0λQ/Cp, which is consistent with figure 7, where
we find that lowering the value ofλby a factor of 10 lowers the critical power by the same order of magnitude.
4. Experimental validation
The direct comparison with practical circumstances involves very small power sources, as might occur at a kink in a damaged power cable buried within a combustible material. Typically, this might be a wood sawdust insulation layer, or a product that inadvertently accumulates in a crevice of a processing plant where electricity cables are located. In many cases, there are likely to be additional chemical complexities associated, such as the evolution of gaseous products and even void creation around the source when the combustion takes place. These are issues to be addressed in subsequent work.
As a forerunner, our concern is to seek validation of this model. To do so we turn to laboratory experiments [13] that involve a small power source (0.05 m) embedded in a
0.08 0.1 0.12 0.14 0.16 0.18 0.2 0.22 0.24 0.26 0.28 0.3
0.001 0.002 0.003 0.004 0.005 0.006 0.007 0.008 0.009 0.01
Critical Power/W
[image:14.595.157.464.82.342.2]Hot spot radius/m
Figure 7. The critical power curve forN = 0.1, with λ = 0.01 W m−1K−1, β = 2440
andρ = 660 kg m−3. Compare this curve with theN = 0.1 (‘×’) curve in figure 1, where
ρ=660 kg m−3,β=2440 andλ=0.1 W m−1K−1.
cube of particulate reactive material (side-length 0.05,0.1 and 0.2 m), packed to a density of 660 kg m−3. The process taking place is the oxidation of iron (II) oxide, which may be represented by
4FeO + O2−→2FeO3 for which U2980 = −281.5 kJ mol−1 (11)
and for which the only gas movement is the diffusion of oxygen into the system. The critical power required from a 0.005 m source was not easy to obtain with high precision in this system, but it fell reproducibly in the range 3–4 W, with little dependence on cube size. This critical power is consistent with the predictions at very low values ofN, for which oxygen diffusion is not rate controlling, and is an important datum point. More densely packed materials would adversely affect the ingress of oxygen.
From thermocouple experiments within the material in the 0.05 m basket, located at approximately half distance between the source surface and the outer edge, a constant temperature of about 650 K was established after approximately 1 h. This followed an overshoot, reaching a maximum of about 800 K as a result of exothermic oxidation. These times are comparable with the numerical results which show that the time to ignition increases to hours for larger values of the ratioN (restricted oxygen supply), but the temperatures are somewhat lower than that predicted by the numerical results.
5. Scaling
The prediction of ignition is not restricted to small sizes. In non-dimensional terms, the beginning of ignition represented by the left-hand cusp of theZ-shaped curve illustrated in
figure 1 occurs at the following values [1] of re-normalized radiusξ0∗and powerα∗:
ξ0∗≡ξ0 √
a= r0 λ/ρcpAYa
≈2×10⁻³, α∗≡ √α a =
P Rλ/ρcpAYa
4π r02λE ≈3×10
−3,
(12)
whereQR/cpE=0.075. Hence, for example, withλ,ρandcpthe same, to achieve the same
cusp in(ξ0∗, α∗)space, with an increased size hot-spot,(AYa)2would have to be decreased by the same amount, thus keepingr0
√
AYathe same. Hence, the onset of the subtle switch-on and switch-off ignition behaviour implied by figure 1 at about 0.003 m hot-spot (using the data of table 1) would still occur for a 0.03 m hot-spot, if the material was 300 times less reactive, that is, ifAYawas 1×10⁻³s−1. For a similar critical power level then(P /√AY
ar02E)would need to remain the same, that is,P /(r0E). Thus, a lower activation energy would still yield a similar critical power for a larger hot-spot. To keepQR/cpE=0.075, the heat releaseQ
would need then to reduce in proportion.
6. Conclusions and future development
We have shown here that when the reaction depends on the supply of oxygen a hot-spot can still be the cause of a self-propagating combustion front. As the supply of oxygen becomes more restricted, it becomes more difficult to initiate self-sustaining combustion waves, and this mode eventually ceases to exist. Nevertheless, even with severe oxygen limitation at fixedr0, complete burning of the solid is possible for increasingly larger powers. For realistic values of oxygen supply we have shown that aZ-shaped critical power versus hot-spot radius relationship is observed.
TheZ-shaped critical curve that we find for smallNis due to the three-dimensional nature of the geometry. This was shown in an earlier work [1] and this behaviour does not occur for the slab and cylindrical geometries, as demonstrated in [3].
Further progress can be made by either allowing the hot-spot boundary to move or taking into account the void created by reactant depletion around the hot-spot. In this paper, it was assumed that the product of reaction was itself a solid with properties identical to that of the reactant. Future work will seek to address reactions in which the product is a gas. This can happen if, for example, the solid is char, in which case one could have a reaction of the type carbon + oxygen→ carbon dioxide. In this case, it is necessary to consider the fuller problem, that is, the coupling of reaction–diffusion with gas dynamics in a porous reacting solid. Another route worth investigating is that of sequential reactions in which the reactant burns to form a char, which subsequently reacts to form gaseous products. Finally, it will be important to extend this work to more complex geometries such as any three-dimensional shape in which the hot-spot is asymmetrically located.
Acknowledgments
The authors are grateful to the EPSRC for financial support through Research Grant GR/R 22179.
References
[1] Brindley J, Griffiths J F and Mcintosh A C 2001 Ignition phenomenology and criteria associated with hotspots
embedded in a reactive materialChem. Eng. Sci.562037–46
[2] Brindley J, Griffiths J F and Mcintosh A C 2001 Potential hazards from spherical hotspots in reactive solids Proc. 3rd International Seminar on Fire and Explosion Hazardsed Bradleyet al
[3] Brindley J, Griffiths J F, Mcintosh A C and Zhang J 2001 Initiation of combustion waves in solids and the effect
of geometryANZIAM J.43149–63
[4] Gray B F and Wake G C 1993 Initial conditions for thermal ignitionMath. Comput. Modelling1865–75
[5] Gray B F and Kordylewski W 1988 Travelling waves in exothermic systemsProc. R. Soc.A416103–13
[6] Kapila A K 1981 Evolution of a deflagration in a cold combustible subjected to a uniform energy fluxInt. J.
Eng. Sci.19m495–509
[7] Linan A and Williams F A 1971 Theory of ignition of a reactive solid by constant energy fluxCombust. Sci.
Technol.391–8
[8] Mcintosh A C, Brindley J and Griffiths J F An approximate model for the ignition of reactive materials by
a hot-spot with reactant depletionMath. Comput. ModellingSpecial volume to mark the retirement of
Professor J Brindley, at press
[9] Mercer G N, Weber R O, Gray B F and Watt S D 1996 Combustion pseudo-wavesMath. Comput. Modelling
2429–38
[10] Mercer G N, Weber R O and Sidhu H S 1999 An oscillatory route to extinction for solid fuel combustion waves
due to heat lossesProc. R. Soc.A4542015–22
[11] Vazquez-Espi C and Linan A 2002 Thermal-diffusive ignition and flame initiation by a local energy source Combust. Theory Modelling6297–315
[12] Watt S D, Weber R O, Sidhu H S and Mercer G N 1999 A weight-function approach for determining watershed
initial conditions for combustion zonesIMA J. Appl. Math.62195–206
[13] Nelson M, Hazard-Assessment Section, Zeneca Fine Chemicals, unpublished results