Audit Log Analysis Using the Visual
Audit Browser Toolkit
James Hoagland, Christopher Wee, and Karl Levitt
UC Davis Computer Science Technical Report CSE-95-11
Abstract
This paper describes the design and implementation of the Visual Audit Browser (VAB) Toolkit, which provides a visual interface for browsing Sun BSM audit logs. Applica-tions of the VAB Toolkit include investigating security viola-tions and more routine system admincistration tasks. The low level of abstraction in the logs, the large size of the logs, and the lack of association indication in the logs are some of the difficulties in manually analyzing audit logs, particularly system-level audit logs. The tools employ several audit visu-alization techniques including graphing, replay of audit events (movies), hypertext organization, and slicing. As a result of highlighting relevant associations between objects and events, the VAB Toolkit allows easier access to related data than textual browsing. This allows the user to more easily reach new and useful conclusions regarding the infor-mation presented as well as to confirm suspected facts. The tools are also compared to relational database based audit querying and shown to be an improvement except perhaps when queries can be easily formulated and not too many associations are needed to reach the intended conclusions. Despite the benefits, the users of tools in the VAB Toolkit are still challenged by the low level nature of BSM auditing and some of the tools are challenged by scalibility on the size of the log. However, audit reductions can help mitigate these problems.
1.0 Introduction
Although the manual analysis of system audit logs is often an essential activity in an environment where security violations are investigated to determine vulnerabilities, establish accountability, assess damage, and recover the sys-tem, few tools are available to effectively review these often volumous, low-level, and poorly organized logs. Audit log formats that are just a list of records in time order can be considered to be poorly organized in the sense that
associa-tions other than that of time, such as the events that involve the same file, are not directly indicated.
Audit reductions can help raise the level of abstraction in the log and reduce the size of the logs, but these reduc-tions depend on the ability to predict patterns of events and these patterns are not always available due in part to the dif-ficulty in predicting human actions and the ever-changing nature of computer systems. As a result, there is often a sig-nificant amount of audit data remaining.
Audit logs are often the clearest source of information about the events that occurred on a system. Files that have been created can be removed, changed files can be restored, access times may be changed, and processes that existed dis-appear into nothingness. This historical information is needed to determine what happened during an attack so that accountability can determined, damage undone, and the chance that a repeat of the violation occurs reduced.
As the above indicates, it is difficult to extract complex information from audit logs although there is often benefit to be gained from analyzing the large logs during an investiga-tion. However, due to the difficulty in constructing prefor-mulated queries, humans often need to look at the audit data and that is where audit visualization can be valuable.
When used as a computer crime investigation method, audit visualization supports the investigation aspect of the cycle of system security involving detection, investigation, recovery, and prevention. This is in comparison to formal verification which can provide high assurance of the correct-ness of protection mechanisms which contributes to preven-tion aspect and to intrusion detecpreven-tion systems which satisfies a detection function.
The Visual Audit Browser (VAB) Toolkit uses audit visualization to communicate the information contained in the audit log to the user. Although designed for the investi-gation of security-related incidents, the toolkit has broader applications including system administration.
Audit Log Analysis Using the Visual Audit Browser
Toolkit
James A. Hoagland Christopher Wee Karl N. Levitt
[email protected] Department of Computer Science
The next section describes the four audit visualization techniques used by the toolkit and section 3 describes the tools in the toolkit. Section 4 provides some example situa-tions where the VAB Toolkit is used in investigation. Audit reduction is described briefly in section 5. Textual and data-base audit browsing are described in section 6 and the audit browsing methods compared in section 7. Some conclusions are mentioned in section 8, and possible future work outlined in section 9.
2.0 Audit Visualization
Audit visualization supports audit log analysis by pro-viding a means to access the data in the log and perhaps indi-cate associations that might have otherwise remained unnoticed or would have taken longer to realize. These asso-ciations form the basis for drawing conclusions regarding the events recorded in the log. These types of conclusions are useful for audit analysis situations where obtaining informa-tion that is not apparent in the log is necessary, such as in security violation investigation. This is opposed to situa-tions, for example, where summaries are sufficient or where the action being investigated is recorded directly in the log. As a result, visualizations that present many relevant associ-ations in a clear manner are therefore more useful in a situa-tion such as investigasitua-tion than one that shows fewer relevant associations.
Four audit visualization techniques that indicate these associations are described in the remainder of this section along with the value they add to the analysis process and their limitations.
2.1 Graphing
Graphing is a technique in which logged objects, events, and associations are represented by the nodes and edges of a graph. In particular, files, processes and users are repre-sented by nodes and events and associations are reprerepre-sented by edges between the corresponding objects. If only pro-cesses and fork system calls are graphed, this corresponds to a “process tree” found in operating system literature.
Graphing helps the analysis of audit logs by enabling the user to reach new conclusions. This is done by highlight-ing certain associations between objects and events. Pro-cesses that operated on files can be indicated along with the system calls used, parents and children of processes can be presented hierarchically, and the owners of processes and files can be shown through the use of graphs.
A limit of this technique is that the available area for presentation, be it on a screen or on paper, is limited, and as the number of events grow, the density of nodes and edges increases, eventually exceeding the point of legibility and
usefulness. Thus this is only effective when there is a lim-ited amount of information to present. This can be dealt with to an extent by audit reduction techniques, which are dis-cussed in section 5.
2.2 Replay of Audit Events in Time Order
The replay of audit events is a technique in which the logged events are presented across multiple displays in the order they occurred1. As a new event is recounted on the display, the set of information associated with the new event is added or updated and the older (and presumedly less rele-vant) information might be removed or presented in a less prominent manner. The rate of the presentation can be the rate at which it occurred, a rate proportional to real rate, or at a rate of one per cue from the user. Note that tools that use this method inherit the strengths and weakness that the other audit visualization technique(s), which need to be used in conjunction with replay, have.
The benefit that is gained by the replay technique is a clear presentation of the timing association. In other words, it helps the human understand the timing of events in the audit log.
2.3 Hypertext Organization
The hypertext organization audit visualization technique presents the logged data as a set of hypertext documents, in which following a link results in the presentation of a docu-ment that has more information regarding the object or event represented by the text under the link. This can be viewed as something like the “flattening out” of a graph presentation of the events described in section 2.1.
An advantage of the hypertext organization technique is that a larger amount of information can be presented in the same area than with some of the other techniques such as graphing, thereby allowing more, potentially useful, details to be presented. Another benefit of this technique is that, similar to the graphing technique, more information regard-ing an object can be found easily, includregard-ing other related objects.
However, the “big picture” can be lost using this method, and this larger view might be needed to realize more complex patterns of events.
2.4 Slicing
The slicing audit visualization technique is similar to the program slicing debugging technique, described in [Weis81] and [AgHo90], which extracts a minimum set of program statements that affect a certain variable. This technique is mentioned in [Wetm93] and is the presentation of the associ-ations and objects closely associated with designated key objects and events and not the associations and objects that are not as closely associated. When combined with the
graphing technique, this corresponds to having certain nodes
or edges as the foci and presenting those and their surround-ing nodes and edges to the user in a graph. The numbers of levels of depth shown -- this is, how far away from a foci can a node or edge be and still be displayed -- is a parameter to the visualization. A somewhat more general technique is the “graphical fisheye” approach presented in [SaBr94] which involves varying the size of a node and length of an edge as a function of its distance to the foci. This allows more nodes to be presented in the same area.
The advantage of this method is one of scalibility on the size of the log. Since only the “local” data is presented, the amount of data in the overall log is irrelevant to a large degree. There is a tendency for objects to be become involved in more associations as the size of the log increases, but this can be addressed by adjusting the depth used.
As with the hypertext organization method, the risk in using this method is that the “big picture” is not presented and may be lost.
3.0 The VAB Toolkit
We have developed four prototype audit browsing tools which are collectively referred to as the Visual Audit Brows-ing (VAB) Toolkit. The tools take SUN BSM audit logs as input and produce visual representations of these logs. The goal of this transformation is to make the important informa-tion that is contained in the audit logs more readily accessi-ble to the humans that need to examine this information.
The VAB Toolkit tools employ various combinations of the four audit visualization techniques in order to help the user obtain better use of logs so that time can be saved and to help enable conclusions that might have otherwise escaped detection to be seen. To simplify the presentation, a few audit reductions (see section 5 on audit reductions) have been coded into the tools. These reductions are fairly easy to modify and consist of simple record filters. In some tools, forks and subsequent “exec”s are combined into a single node.
All of the tools are written in Perl which means they can be ported with relative ease to different architectures.
Another benefit of using Perl is that it is fairly easy to cus-tomize the behavior of the tools.
3.1 The Frame Generator
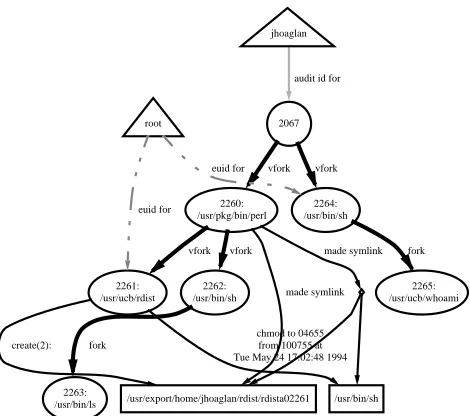
The Frame Generator is a VAB tool that employs the graphing audit visualization technique. In particular, by con-vention in the Frame Generator output, files are represented by rectangles, processes by ellipses, users by triangles, sys-tem calls by solid edges between the calling processes and objects involved, and ownership by non-contiguous edges between the owner node and the object node. An example of the output of the tool is in figure 1, which shows an rdist vul-nerability exploitation2 [CERT91].
The Frame Generator produces an intermediate form from the BSM audit log, and from the intermediate form it produces a DOT3 language file describing the corresponding graph. The DOT file can then be converted into Postscript or other formats. The exact output (i.e. whether or not to show the owners of files) is fairly easy to change by modifying the code. In particular, the generator can filter out records meet-ing a certain pattern in one line of Perl.
2. To better fit the output in the small area of the figure, a few small details have been dropped from the output.
3. DOT is a graph layout tool from AT&T Bell Labs. It takes a graph described in the DOT language, calculates an “optimal” lay-out for the nodes and edges, and lay-outputs this laylay-out in a number of well known formats including Postscript and Maker Interchange Format (MIF) [KoNo93].
2260: /usr/pkg/bin/perl
2261: /usr/ucb/rdist
vfork
2262: /usr/bin/sh
vfork
/usr/export/home/jhoaglan/rdist/rdista02261 made symlink
made symlink 2067
vfork
2264: /usr/bin/sh
vfork
create(2):
/usr/bin/sh chmod to 04655 from 100755 at Tue May 24 17:02:48 1994
2263: /usr/bin/ls
fork
2265: /usr/ucb/whoami
fork jhoaglan
audit id for
root
euid for
[image:4.612.319.554.68.276.2]euid for
3.2 The Movie Maker
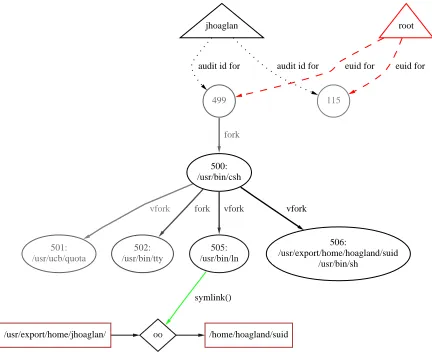
The Movie Maker employs the replay of audit events audit visualization technique combined with the graphing technique to produce a time-ordered sequence of graphs where the graphs are like the ones output by the Frame Gen-erator. There is one frame produced per audit event and the new nodes and edges that occurred on the record correspond-ing to a given frame are added on that frame. For a given graph, the tool can either display all nodes and edges corre-sponding to the objects and events recorded in the log up to that point, the ones corresponding to the most recent events, or all with the least recently active nodes and edges in lighter shading. An example frame is presented in figure 2 and is from the suid attack that involves executing a file “-i” that is a link to a setuid root shell script.4
To produce the movie, the Movie Maker essentially runs the Frame Generator including producing a Postscript file, except that information about the proper time ordering of nodes and edges is passed along as well. This information is then used to rearrange the Postscript code such that there are multiple pages produced, each with the appropriate nodes and edges displayed and at the proper intensity level.
4. The limitations of print media hinder an adequate presentation of the output here. The reader is referred to the URL http:// seclab.cs.ucdavis.edu/awb/Vab.Movie.Maker.html for online exam-ples of Movie Maker output.
jhoaglan root
audit id for
audit id for euid for euid for
499
vfork
/home/hoagland/suid 501:
/usr/ucb/quota
/usr/export/home/jhoaglan/
115
505: /usr/bin/ln
fork
fork
502: /usr/bin/tty
oo
506: /usr/export/home/hoagland/suid
/usr/bin/sh vfork
vfork
[image:5.612.312.555.71.366.2]symlink() 500: /usr/bin/csh
Figure 2. One frame of Movie Maker presentation of suid attack. Note the lighter shading for the less recently accessed nodes and edges.
3.3 The Hypertext Generator
Four types of pages are produced by the Hypertext Gen-erator, which uses the hypertext organization audit visualiza-tion technique. One user page is produced for each user in the log. These pages include information about the pro-cesses that an user’s audit uid owned and what actions those processes took. One file page, which contains the actions on the file, is created per file that was modified. A page that summarizes each of the records in the audit log, in the origi-nal order, is also generated as is a page that lists all the pages produced. Figure 3abcd demonstrates the tool, which was run on the same suid attack log as in the previous section.
log of a suid attack: the top of an auid page. Auid jhoaglan Info
Processes
115: 499: 500: /usr/bin/csh 501: /usr/ucb/quota 502: /usr/bin/tty 505: /usr/bin/ln 506: /usr/bin/sh 507: /usr/bin/id 508: /usr/bin/chmod
Back to root
Processes Info for 115
Audit Uid: jhoaglan Parent: (not in log) Execed File: (none in log)
no forks recorded
Processes Info for 499
Audit Uid: jhoaglan Parent: (not in log) Execed File: (none in log)
Forked Processes:
500: /usr/bin/csh at Tue Jul 5 19:31:14 1994
Figure 3a. Output of the Hypertext Generator on the
File Info for /etc/security/password.adjunct
Chmods:
by 508 from 104644 to 00666 at Tue Jul 5 19:32:42 1994
Back to root
Generated on Wed Jul 20 12:05:28 PDT 1994 by hoagland using ab
log of a suid attack: a file page.
[image:5.612.56.272.72.248.2]The Hypertext Generator reads the BSM audit log and
The Events (in the order of the audit log)
Tue Jul 5 19:31:14 1994: 500 (jhoaglan) forked 501
Tue Jul 5 19:31:14 1994: 501 (jhoaglan) execed /usr/ucb/quota
Tue Jul 5 19:31:14 1994: 499 (jhoaglan) forked 500
Tue Jul 5 19:31:14 1994: 500 (jhoaglan) execed /usr/bin/csh
Tue Jul 5 19:31:15 1994: 502 (jhoaglan) execed /usr/bin/tty
Tue Jul 5 19:31:15 1994: 500 (jhoaglan) forked 502
Tue Jul 5 19:32:26 1994: 500 (jhoaglan) forked 505
Tue Jul 5 19:32:26 1994: 505 (jhoaglan) execed /usr/bin/ln
Tue Jul 5 19:32:29 1994: 500 (jhoaglan) forked 506
Tue Jul 5 19:32:29 1994: 506 (jhoaglan) execed /usr/bin/sh
Tue Jul 5 19:32:32 1994: 507 (jhoaglan) execed /usr/bin/id
Tue Jul 5 19:32:32 1994: 506 (jhoaglan) forked 507
Tue Jul 5 19:32:42 1994: 508 (jhoaglan) execed /usr/bin/chmod
Tue Jul 5 19:32:42 1994: 506 (jhoaglan) forked 508
Tue Jul 5 19:32:42 1994: 508 (jhoaglan) chmoded /etc/security/password.adjunct
Tue Jul 5 19:32:47 1994: 500 (jhoaglan) created /usr/export/home/jhoaglan/.history
Back to root
Generated on Wed Jul 20 12:05:28 PDT 1994 by hoagland using ab
log of a suid attack: the date page.
Figure 3c. Output of the Hypertext Generator on the
produces HyperText Markup Language (HTML) documents that can be viewed using any World Wide Web browser.
3.4 The Focussed Audit Browser
The Focussed Audit Browser (FAB) uses the slicing and graphing audit visualization techniques to present the data in the audit log. The prototype implementation of the tool allows only nodes to be foci, permits only one focus, and has a fixed depth. The display shows the focus node, the nodes that share edges with the focus, and those edges. To choose a new focus, the user types in the name of the node that is to become the focus.5 Examples of FAB output are in figures 4abc and 5ab, which are explained below.
The GUI for FAB is based on HTML forms. At the top of the document, the graph is displayed as GIF6 image and at
5. Unfortunately, time did not permit the inclusion of a more conve-nient focus selection mechanism into our prototype FAB such as simply clicking on the node that is to be the new focus.
6. GIF is a trademark and servicemark of CompuServe Incorpo-rated.
4128
4131 fork
/usr/bin/mv /tmp /etc
execve lstat access stat
/etc/config
unlink lstat open: r
/tmp/config
[image:6.612.69.544.69.210.2]chmod old utime creat stat chmod
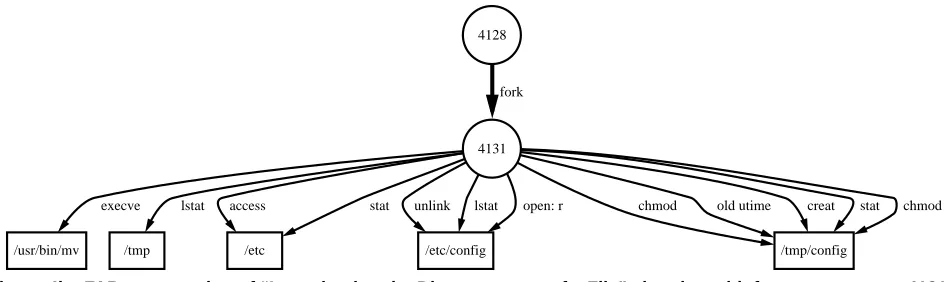
[image:6.612.55.559.262.403.2]Figure 4b. FAB presentation of “Investigating the Disappearance of a File” situation with focus on process 4131. The process that removed the file, 4131, is now investigated further with other system calls and its parent process shown. It is seen that process is running the “mv” program, which is show to read and remove “/etc/config”, create (and presumedly write to) the destination “/tmp/config.”
Figure 4c. FAB presentation of “Investigating the Disappearance of a File” situation with focus on process 4128. 4128
/usr/bin/su execve
/etc/default/su open: r
/var/adm/sulog
open: w open: w open: w open: w chown
/etc/shadow open: r open: r open: r
/etc/passwd open: r open: r open: r
/sbin/sh execve
4129 fork
4130 fork
4131 fork
4132 fork 4092
fork
the bottom of the document an input box is present where the user enters the next node that is to be the focus. Once a new focus is selected, FAB is invoked with the focus input. The BSM audit log is scanned for events that have the focus as a node, and the other nodes and edges connected to the focus are added to the DOT language graph. The DOT graph is converted to GIF format and a HTML Form is output and is displayed on the Web browser and the cycle repeats.
4.0 Example Uses of the VAB Toolkit
4.1 Investigating the Disappearance of a File
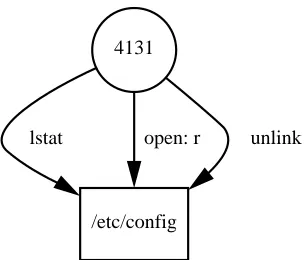
A configuration file is discovered to be missing by a sys-tem administrator. A quick polling of the other syssys-tem administrators reveal that no one knows anything about it. They decide to find out what happened to it by using the VAB Toolkit. They start up the Focussed Audit Browser with the initial focus as the missing file, “/etc/config.” This is shown in figure 4a. The system calls that involved “/etc/ config” are seen as edges going into the file’s node. The “unlink” system call that removed the file is immediately seen to have come from process 4131.
To find out more information about process 4131, FAB is focussed on that process. Figure 4b shows the result. The process is seen to have "exec"ed the UNIX file move utility, “/usr/bin/mv”. Another key fact seen is that “/tmp/config” can be inferred to be the destination of the file move since it is created by “mv” using the “creat” system call. Curious about the events surrounding the move, the parent, which is expected to be some sort of command-interpreter (shell), is chosen to be the new focus (the output is shown in figure 4c.) This process is seen to have “exec”ed “/usr/bin/su” and “/ sbin/sh” and to have forked three processes besides the one that moved “/etc/config”. Refocusing on the shell from which “su” was invoked shows that that process read the
4131
/etc/config
[image:7.612.329.551.67.268.2]lstat open: r unlink
Figure 4a. FAB presentation of “Investigating the Disappearance of a File” situation with focus on the configuration file. The edges going into the file are the system calls that involved the file, in this case all coming from process 4131.
initialization file of a junior system administrator and thus appears to be running as that administrator.
Going back down to the “su” process then in turn to pro-cesses 4129, 4130, and 4132, it is seen that this event took place in the middle of several other similar, legitimate events. It is apparent that the file was moved on accident and the red-faced administrator puts the file back in place.
4.2 Finding a File’s Origin
Out of memory errors suddenly start occurring on a workstation used primarily for development purposes. Since the workstation has plenty of virtual memory this is puz-zling. The experienced system administrator, knowing that the virtual memory shares a disk partition with “/tmp” on that machine, looks in “/tmp” and finds several large files, “tmp3870”, “tmp3872”, “tmp3890”, etc., of unknown origin. Due to the naming of these files, it is suspected that the files are leftover from a program that didn’t completely clean up after itself. Although owner of the file is the user “jhoag-lan”, the user wants to confirm his suspicions and to find out which of “jhoaglan”’s many programs created the file.
[image:7.612.106.258.68.198.2]Invoking the FAB with one of the temporary files as the focus, the administrator sees, as shown in figure 5a, the pro-cess, numbered 3872, that wrote to the file and presumedly created it with an open for write. Changing the focus to
Figure 5a. FAB presentation of “Finding a File’s Origin” situation with the focus on the file
3872
/tmp/tmp3872
open: w open: w open: r
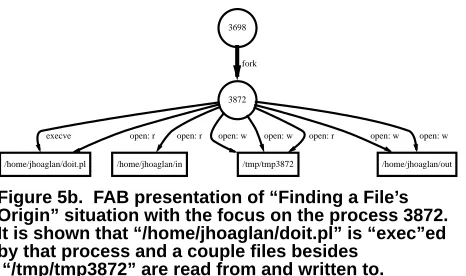
3872 (the result of which is shown in figure 5b), the system administrator quickly sees that the files are created by a Perl script, “/home/jhoaglan/doit.pl”, which is “exec”ed by the process. “Jhoaglan” is informed, apologizes, and fixes the bug in the program.
4.3 Investigating an Attack (Generalized)
Some initial piece of evidence is discovered that an attack happened. This evidence can be from an IDS, Trip-wire, chance discovery by a human, or by some other means and indicates that something strange (or at least bad) may have happened.
For instance, a file has been unexpectedly altered. This file is then brought up as the focus on the Focussed Audit Browser and, as in the previous two examples, the pro-cess(es) that altered the file are seen on the display along with how it (they) altered it. The process that performed the unexpected event(s) can then be brought into focus to see what else it did. This type of search is repeated until the attacker’s point of entry (i.e. a login) is discovered.
If the evidence is that there is a masquerader, the Hyper-text Generator is invoked on the audit logs for the time in question. The page corresponding to the audit uid in ques-tion is traversed to. The processes owned by that uid are then examined for activities not attributable to the actual user. A process tree, which can created by the Frame Gener-ator set up only to graph “fork”s, might be useful in this case.
[image:8.612.61.294.69.207.2]If the incident involved becoming superuser, the point at which the attacker got superuser privileges and the logged portion of the circumstances is seen. Once the point of entry is determined, the vulnerability exploited can be determined, or at least hinted at, depending on what was logged. Going forward from the point of entry, the user sees what processes were spawned and what each of those processes did. This information, which represents what the attacker did, is used later for documentation for prosecution, for recovery, and for attack analysis.
Figure 5b. FAB presentation of “Finding a File’s Origin” situation with the focus on the process 3872.
3698
3872 fork
/home/jhoaglan/doit.pl
execve open: r
/home/jhoaglan/in open: r
/tmp/tmp3872 open: w open: w open: r
/home/jhoaglan/out open: w open: w
It is shown that “/home/jhoaglan/doit.pl” is “exec”ed by that process and a couple files besides
“/tmp/tmp3872” are read from and written to.
The Frame Generator or Movie Maker, or both, is later called upon to create a presentation involving the critical logged aspects of the attack to give to a jury.
4.4 Analyzing an Executable
A government agency is given an executable binary file that is found on a recently attacked site. The file was recov-ered from the disk after having been deleted from the file system and is suspected to have been used by the attacker. The file is loaded onto an isolated host that has a similar con-figuration to the attacked host. Full auditing is turned on, the file is executed, then auditing is turned off. The resulting audit log is not too large, but is large enough that it would be tedious looking at it using textual methods.
The Frame Generator is run on the audit log to get a quick overview of the activities. The Movie Maker is then invoked and the output viewed. The actions that the pro-gram took (or attempted to take), and the order in which they were taken, is clear from the presentation. More details about the attack, such as the exact timing of events, is later found out by using the Hypertext Generator.
5.0 Audit Reduction
Two challenges to visualizing audit logs are the often large size of the logs and the low-level nature of system audit logs. Both of these problems can be addressed by using audit reduction techniques.
A basic audit reduction technique is to simply remove events that fit into certain classes. Some examples are:
• removing events before and after a certain period of time,
• removing or retaining only events that have certain user ids attributed to them,
• removing certain event types such as “ioctl” system calls and system call that failed, and
• removing events that involve certain files, such as those involving system library files.
These filtering techniques, which are sometimes performed at the logging level such as SUN BSM’s “auditreduce” tool and audit configuration options [Sun91], can remove a frac-tion of the records in the log and can aid audit analysis and audit visualizations by doing so.
level of the log to a degree, which eases audit analysis. A reduction of this sort might be as simple as replacing a “fork” and corresponding “exec” system calls into a “spawn” meta-level event or be more complicated such as replacing a normal login with a “login” event or recognizing an attack and replacing it with an attack event. An example of this is protocol-based audit reductions, studied by Chris Wee [Wee95b].
Patterns can even involve meta-events, and this type of technique might appear, on the surface, to be scalable, thereby reducing the number events and the size of the log significantly. If signatures and other closed-form expres-sions of audit reductions were always available, this might indeed be the case. However, as a result of never before seen or thought of events and attacks and the changing nature of computer systems, signatures are not always known so a sig-nificant amount of data is left for analysis.
In addition, performing signature-based reductions of this sort, however may require new analysis tools to be developed or require existing tools to be modified in order to operate on these new records.
6.0 Other Browsing Methods
6.1 Textual Audit Browsing
The simplest manner by which the audit log may be viewed by a human is merely showing the text of the audit log on a display tool such as the Unix programs “vi” or “more”, and is referred to as textual browsing. The opera-tions that the user has available in looking at the log are to move forwards or backwards in the log, which amount to seeing the next and previous events (if the log is organized by time), and to search for a string, an operation which can be used as a simple form of association-finding.
6.2 Relational Database Browsing
Another browsing method is to store the audit data in a relational database and perform structured queries upon that database using the Structured Query Language (SQL) or another query specification mechanism. The purpose of the query is to find the events and objects that meet the query criteria so that associations between them can be found and knowledge of how many there are can be used. The results of the query are displayed (in a textual manner) to the user who then interprets the result and formulates a new query.
One program that converts audit logs into relational database files is ComputerWatch [DoRa90]. Computer-Watch takes AT&T MLS audit logs and puts the records into database format in several files; the files are statically
orga-nized such that by the data items that are most frequently accessed together are put in the same file [Wetm93].
7.0 A Comparison of Browsing Methods
It is fairly easy to obtain information that is directly recorded in an audit record using the textual audit browsing method. However, obtaining more complex information using this method can be difficult and time-consuming since associations between objects and events (other than time ordering associations) are not obvious and somewhat bur-densome to obtain. This information then needs to be put together to draw useful conclusions. Textual browsing is not well suited to this task since it is unlikely that more than one or two relevant associations appear on the screen at the same time, and thus must be remembered or recorded externally.
To access audit data that has been stored in a database, one must construct structured queries on that database. Con-structing these queries requires practice, some time, and per-haps some training on the query specification mechanism. Associations can be seen from this method more easily than in the textual browsing method, but similar problems exist for seeing multiple associations at the same time. In addi-tion, the time required to formulate a query might tend to reduce the retention of previously learned associations.
Using the hypertext organization audit visualization technique, and the Hypertext Generator in particular, for audit browsing shows much of the same information as would be shown by several database queries. Events involv-ing a certain file are shown together as would be the case if events involving that file were queried for, and events and actions around a process are shown together as it would be if that process were queried in the database. However, using this method has the advantage that queries are preformulated in the form of links that information, thereby saving time and effort. In addition, as there is a tendency to want more infor-mation about just seen objects and events, there is the added advantage of those links being readily available. The disad-vantage to this method is if there is not a section in the hypertext pages about an object or event, what a query would find cannot be readily found using this method. How-ever a browser that makes good use of the hypertext organi-zation visualiorgani-zation technique would have sections corresponding to all queries of interest.
see the next level of associations whereas the link needs to be selected. The disadvantage of showing these additional levels of associations is that it takes up additional space on the display which either forces the nodes to be presented smaller, and perhaps illegibly, or not all the nodes to be pre-sented simultaneously. Another disadvantage to using the graphing technique is that the details of the events and objects would tend to be available via the graph. Although it is conceivable that the graph would present this information, this would tend to diminish the advantages of the graph as it uses more space and might clutter the graph.
The Focussed Audit Browser shows only a portion of the log, but does so in an organized manner. Browsers which used the slicing audit visualization technique, such as FAB, show just the portion of the audit log that is related to the focus. This method is scalable on the size of the log, which is important since, as noted previously, the log is often large.
The replay of audit events audit visualization method is useful for showing the time ordering of events in a visual manner. This helps the user get a “feel” for what happened timewise and assists the user in understanding complex tim-ing information.
8.0 Conclusions
The analysis of audit data faces several challenges, including the size of the audit logs, the organization of data in audit logs, and the low level nature of events recorded in audit logs. Audit reductions can help, but there still may be much data to analyze and this analysis often needs to be per-formed manually.
The Visual Audit Browsing Toolkit, whose tools use graphing, replay of audit events, hypertext organization, and slicing audit visualization techniques, assists in the investi-gation of security violations and other incidents that can be aided by audit analysis. This is done primarily by providing enhanced access to associations found in the audit log which form the basis for forming conclusions from the data.
If the information sought is contained in a single audit record, then textual audit browsing might be as useful as tools based on the mentioned visualization techniques, but this is unlikely to be the case for more complex situations. Database audit browsing might be useful in situations where queries are easy to specify and whose conclusions can be reached through a couple simple associations in the data-base, but a browsing tool based on the hypertext organiza-tion visualizaorganiza-tion technique should be able to handle this situation and more complex ones more easily.
Since the tools that make up the Visual Audit Browser Toolkit have different strengths and weaknesses, and
corre-spondingly different situations and goals which they are good at, the toolkit works best when it is considered a set of tools to be used for analysis. Particularly when used in the appropriate combination, the tools of the VAB Toolkit are suitable for a variety of manual audit analysis situations.
9.0 Future Work
There are several issues involving audit visualization and the VAB Toolkit that can be explored. One is to investi-gate other audit visualization techniques such as the use of color. Red can be used to represent processes with effective uid root and system calls that are damaging such as “unlink”, blue or black for relatively benign system calls such “open for read” and “stat”.
New tools can be added to the VAB Toolkit involving different combinations of the existing visualization tech-niques. The current tools can be expanded as well. One idea is to expand the Hypertext Generator to generate HTML that links to other hosts that have also run the Hypertext Genera-tor on their logs. The links can be to events that correspond to the local events. Determining this correspondence is an issue unto itself. FAB can be enhanced by allowing various depths of display, edges to be foci, multiple foci, and audit reductions to be performed to specified from the interface. The Frame Generator can be expanded so that different views of the audit data can be generated. Another view that can be considered is viewing the data from the point of view of the file system, rather than the somewhat process-centric view now produced.
Visualization of other audit log formats can be looked at including similar system-level logging mechanisms, applica-tion-level audit trails, and per-object audit logs such as those found in the Logging and Auditing File System (LAFS) [Wee95a].
Information from outside the audit log can be brought into the visualization including the system policy, an attack database, user and attacker profiles, other audit sources, intrusion detection system output, security analysis tool out-put such as that from Cops [Farm91], Tripwire [KiSp93] and SATAN [FaVe95], program profiles such as those developed for privileged programs by Calvin Ko, et. al., [KoFL94], and information from the file system as it exists at the time of analysis. Such a tool, though perhaps daunting to imple-ment, would be useful as a “cypersleuth’s notebook.”
10.0 Acknowledgments
their help with it; they even added a feature to DOT to help our implementation.
I would also like to thank the other members of the Security Lab at UC Davis, in particular Chris Wee and Pro-fessor Karl Levitt for their ideas and suggestions for this work.
11.0 References
[ArHo90] Hiralal Agrawal and Joseph R. Horgan, “Dynamic Program Slicing,” Proceedings of the ACM SIG-PLAN Conference on Programming Language Design and Implementation, June 1990.
[CERT91] CERT Advisory CA-91:20, 1991.
[DoRa90] Cheri Dowel and Paul Ranstedt, “The Com-puterWatch Data Reduction Tool,” Proceedings of the 13th National Computer Security Conference, Washington, DC, October 1990.
[KiSp93] Gene Kim and E. Spafford, “Experiences with Tripwire: Using Integrity Checkers for Intrusion Detection,” Systems Administration, Networking and Security Confer-ence III, Usenix, April 1994.
[KoFL94] Calvin Ko, George Fink, and Karl Levitt, “Automated Detection of Vulnerabilities in Privileged Pro-grams by Execution Monitoring,” Proceedings of the Tenth Annual Computer Security Applications Conference, December 1994.
[KoNo93] Eleftherios Koutsofios and Stephen C. North, “Drawing Graphs with Dot,” AT&T Bell Laboratories, Octo-ber 18, 1993.
[FaSp91] Dan Farmer and E. Spafford, “The COPS Security Checker System”, source available from ftp to coast.cs.purdue.edu, 1991.
[FaVe95] Dan Farmer and Wietse Venema, “System Administrator Tool for Analyzing Networks”, documenta-tion and source available from via http to ciac.llnl.gov, 1995.
[SaBr94] Manojit Sarkar and Marc H. Brown, “Graphi-cal Fisheye Views,” Communications of the ACM, Decem-ber 1994.
[Sun91] Sun Microsystems, Inc., “Installing, Adminis-tering, and Using the Basic Security Module,” December 1991.
[Wee95a] Christopher Wee, “LAFS: A Logging and Auditing File System,” Submitted to Eleventh Annual Com-puter Security Applications Conference, December 1995.
[Wee95b] Christopher Wee, Ph.D. Thesis (in progress), University of California, Davis, 1995.
[Weis81] Mark Weiser, “Program Slicing,” CH1627-9/ 81/0000/0439, IEEE, 1981.