THE DEVELOPMENT AND APPLICATION OF A NOVEL METHOD FOR THE QUANTIFICATION
OF PREBETA-1 HDL IN PLASMA
Patricia O’Connor BA Mod (Biochemistry)
MB BcH BAO DCH FRCPI
A thesis submitted for the degree of Doctor in Medicine
School of Medicine Faculty of Health Sciences University of Dublin, Trinity College
October 2019
DECLARATION
I certify that none of the work in this thesis has been submitted previously for any degree or diploma at this, or any other university, and that the work described in this thesis, except where duly
acknowledged, is my own.
I hereby agree that the Library of Trinity College Dublin may lend or copy this thesis upon request.
Patricia O’Connor
15/10/19
ACKNOWLEDGEMENTS
This MD thesis is based on, research which I carried out at the Cardiovascular Research Institute in the University of California San Francisco under the direction and supervision of Professor John Kane, Professor of Medicine and Professor of Biochemistry and Biophysics, Associate Director of the Cardiovascular Research Institute and Director of the adult Lipid Clinic.
I am very grateful to so many people who supported and encouraged me in bringing this work to fruition. I would like to sincerely thank and acknowledge the advice and input and support, of my supervisor Professor John Kane and Dr Mary Malloy, Co-director of the adult Lipid Clinic and director of Pediatric Lipid Clinic at the University of California San Francisco.
I would also like to thank and acknowledge all of my clinical and laboratory colleagues in Professor Kane’s laboratory in the Cardiovascular Research Institute and in the Lipid and Cardiovascular medicine departments at the University of California San Francisco for their assistance and support. Also the input of my co-authors into our jointly published works namely: J. M. Naya-Vigne, P. N. Duchateau, B. Y. Ishida, M. Mazur, S. A. Schoenhaus, B. R. Zysow, S. T. Kunitake, R. F. Redberg, S. J. Spencer, S. Mark, D. C. Heilbron, R. B. Jaffe, A. Leaf, H. MacRae, J. Kasem, C. Pullinger, L. T. Guey, C. Zellner, O. L. Francone, J. M. Laramie, , K. A. Siradze, P. Deedwania, P. H. Frost, A. B. Seymour, E.O. Stock . I would also like to acknowledge the technical assistance of Kyee Yeo and Irina Movsesyan.
I would also like to acknowledge support received from the following research funds, which facilitated this research: NIH Grants HL31210, HL50782, HL50779, HL-50745, HL-50772, and AA11205 and gifts from the Joseph Drown Foundation and Donald and Susan Schleicher.
SUMMARY
The atheroprotective properties of high-density lipoprotein (HDL) are associated with the ability of HDL to initiate reverse cholesterol transport (RCT), a process whereby excess cholesterol is transported from peripheral cells to the liver for excretion (Miller & Miller, 1975). For the past 5 decades HDL quantification has been based on the cholesterol content of HDL (HDL c). While low levels of HDLc are epidemiologically predictive of atherothrombotic cardiovascular events in large populations, this measurement appears to be an unreliable indicator in the precise determination of individual cardiovascular risk (Bruckert & Hansel, 2007). This may relate to the complex biology of HDL, a deeper understanding of which began with the discovery in the Kane laboratory that HDL is not one single lipoprotein entity but consists, of at least 20 individual structurally and functionally distinct heterogeneous, molecular subspecies which are rapidly and continuously interconverted (Kunitake & Kane, 1982).
The method developed and described in this thesis provides a robust technique for quantifying plasma prebeta-1 HDL, utilizing ultrafiltration of plasma, isotope dilution and an enzyme-linked immunosorbant assay (ELIZA) modified to allow the equal detection of apolipoprotein A-I (apoA-I) in prebeta-1 HDL and in other plasma HDL particle species. This method quantifies the fraction of total apolipoprotein A-I that is present in prebeta-1 HDL particle species.
In brief, using low-velocity centrifugation in ultrafilters with a 100 KDa cut off, it was demonstrated that prebeta-1 HDL, could be separated categorically from larger-diameter HDL particles in plasma and quantified by application of the isotope dilution principle and measurement of Apo A-I by ELIZA. Levels of prebeta-1-HDL are reported as prebeta-1-HDL–A-I.
This method was then utilized to measure prebeta-1 HDL levels: Firstly in 136 normal males and females, which found that, lower levels of prebeta-1 HDL were associated with female gender. Secondly, as exercise is associated with prevention of coronary artery disease, and is thought to be mechanistically related to its HDL raising effect, the effects of acute physical exercise on prebeta-1 HDL was also examined in normolipidemic subjects, demonstrating that acute exercise significantly increased absolute plasma prebeta-1HDL levels. Finally prebeta-1 HDL levels were also measured in large well-characterized clinical cohort of 1255 subjects from the University of California San Francisco Lipid and Cardiovascular Clinics and collaborating Cardiologists. An association was found between, increased absolute levels of prebeta-1 HDL and structural coronary disease and myocardial infarction. This was the first study in which prebeta -1 HDL was identified as a novel and independent predictor of MI above and beyond traditional CHD risk.
materially to the armamentarium of cardiovascular risk biomarkers. Measurement of prebeta-1 HDL levels may also assist in both, refining our understanding of the molecular pathophysiology of atherosclerosis, and in the development of pharmacological interventions that will reduce residual risk, thus enhancing the ability of the clinician to optimally manage patients. The innovative features of this novel method of quantifying prebeta-1 HDL described in this thesis are its scalability and its potential to measure large numbers of patient’s samples concurrently for clinical purposes.
TABLE OF CONTENTS
Declaration ... 2
Acknowledgements ... 3
Summary ... 4
Index of Abbreviations………10
Figures ... 11
Tables ... 12
CHAPTER 1
:
HDL Historical Aspects ... 141.1 Introduction ... 15
1.2 HDL and Atherosclerosis ... 16
1.3 Primary and secondary prevention studies raising HDL ... 17
1.3.1 The Framingham Heart Study ... 17
1.3.2 The Helsinki Heart Study ... 18
1.3.3 The Scandanavian Simvastatin Survival Study Group ... 18
1.3.4 The Air Force/Texas Coronary Atherosclerosis Prevention Study ... 18
1.3.5 The Veterans Affairs High-Density Lipoprotein Cholesterol Intervention Trial ... 19
1.4 HDL and it role in reverse cholesterol transport ... 19
CHAPTER 2:Characteristics of prebeta-1 HDL ... 22
2.1 Introduction ... 23
2.2Prebeta-1 HDL cycle ... 24
Phase 1: Transfer of free cholesterol (FC) to prebeta-1 HDL via ABCA1 ... 25
Phase 2: Esterification of surface-associated FC by the enzyme LCAT ... 25
Phase 3: Transfer of FC and TG between HDL-C and Apo B-containing lipoproteins mediated by the enzyme CETP ... 26
Phase 4: Uptake by SR-B1 receptor on the liver and catabolism of mature HDL-C into bile or small HDL-C particles by HL ... 26
2.3Justification for Research described in this thesis ... 27
2.4Limitations of methods previously described for measurement of prebeta-1 HDL ... 27
CHAPTER 3
:
Development of Ultrafiltration-Isotope Dilution method for quantification of prebeta-1HDL ... 293.1 Introduction ... 30
3.2 Method Outline ... 30
3.2.1 Collection of plasma ... 30
3.2.2 Isolation and purification of prebeta-1 HDL for use as a tracer ... 30
3.2.2.2 Starch Electrophoresis to separated prebeta-1HDL from
alpha HDL ... 30
3.2.2.3 Assessment of prebeta-1 HDL purity ... 30
3.2.3 Radiolabeling of tracer prebeta-1 HDL ... 30
3.2.3.1 Assessment of purity of tracer prebeta-1 HDL ... 31
3.2.3.2 Integrity of the prebeta-1 HDL tracer ... 31
3.2.3.3 Storage of radiolabeled tracer prebets-1 HDL ... 31
3.2.4 Ultrafiltration of apo A-I lipoproteins isolated by selected affinity immunosorption ... 31
3.2.4.1 Ultrafiltration of peaks from starch block ... 31
3.2.4.1 Assessment of protein retention by ultrafilter ... 31
3.2.5 Quantification of prebeta-1 HDL in plasma by ultrafiltration of plasma samples and application of isotope dilution principle ... 31
3.2.6.1 Specific activity of Apo A-I in ultrafiltrate ... 31
3.2.6.2 Immunoassay Apo A-I in plasma and ultrafiltrate ... 31
3.2.6.3 Assessment of plasma specimen stability ... 31
3.2.6.4 Fresh and Frozen Plasma samples quantification of prebeta-1HDL ... 31
3.2.6.5 Interassay coefficient of variation for determination of prebeta-1 HDL ... 31
3.2.6.6 Calculation of total mass of prebeta-1HDL in plasma samples ... 31
3.2.6.7 Assessment of plasma specimen stability ... 31
3.2.6.8 Fresh v’s frozen plasma assessment ... 31
3.3 Quantification of prebeta-1 HDL l in 86 normlipidemic subjects ... 31
CHAPTER 4: Application of Ultrafiltration-Isotopic Dilution technique to Measurement of Prebeta-1 HDL in plasma ... 48
4.1 Introduction ... 49
4.2 Study 1: Measurement of prebeta-1 HDL in plasma of normolipidemic subjects: influences of plasma lipoproteins, age, and gender ... 49
4.2.1 Subjects ... 49
4.2.2 Lipoprotein measurements ... 50
4.2.3 Statistical Analysis ... 50
4.3 Study 2: The Effects of Physical Exercise on Plasma Prebeta-1 High-Density Lipoprotein . ... 5Prebeta-1
4.3.1 Subjects ... 51
4.3.2 Protocol ... 51
4.3.3 Procedures ... 52
4.3.4 Lipoprotein measurements ... 54
4.3.5 Statistical Analysis ... 54
4.4 Study 3: Relation of Increased Prebeta-1 High-Density Lipoprotein Levels to Risk of Coronary Heart Disease ... 55
4.4.1 Subjects ... 55
4.4.2 Coronary Imaging ... 56
4.4.3 Lipoprotein measurements ... 56
5. Introduction ... 60
5.1 Study 1: Results for Measurement of prebeta-1 HDL in plasma of normolipidemic subjects: influences of plasma lipoproteins, age, and gender ... 60
5.1.1 Preliminary screening ... 62
5.1.2 Final Models ... 64
5.2 Study 2: The Effects of Physical Exercise on Plasma Prebeta-1 High-Density Lipoprotein. ... 68
5.2.1 Subjects ... 68
5.3. Study 3: Relation of Increased Prebeta-1 High-Density Lipoprotein Levels to Risk of Coronary Heart Disease ... 72
5.3.1. Subjects ... 72
5.3.2 Lipid Lowering drugs ... 73
5.3.3 Menopause ... 74
5.3.4 Association with Myocardial infarction ... 74
5.3.5 Effect of adding prebeta-1HDL lipoprotein tertiles to risk-prediction models ... 76
CHAPTER 6:Discussion ... 77
6.1 The Isotopic Dilution-Ultrafiltration Method for measurement of prebeta-1 HDL ... 78
6.2 Prebeta-1 HDL in normolipidemic subjects; influences of plasma lipoproteins, age and gender ... 81
6.3 The Effects of Physical Exercise on Plasma Prebeta-1 High-Density Lipoprotein ... 83
6.4 The associations between prebeta-1 HDL, CHD and MI ... 88
6.5 Conclusions and future directions ... 93
Publications: ... 93
INDEX OF ABBREVIATIONS
ANOVA: 1-way analysis of variance BSA: Bovine serum albumin CHD: Coronary heart disease CPM: Counts per minute FC: Free cholesterol
HDL: High density lipoproteins
HDLc: High density lipoprotein cholesterol
HL: Hepatic Lipase
HRP: Horse radish peroxidase. LDL : Low density lipoproteins VLDL: Very Low Density Lipoproteins LCAT : Lecithin cholesterol acyltransferase CETP: Cholesteryl ester transfer protein FPLC: Fast protein liquid chromatography kDA : Kilodaltons
PLTP: Phospholipid transfer protein SR-BI: Scavenger receptor, type B, one BMI : Body mass index
ELISA: Enzyme-linked immunosorbent assay ESTRSTAT: Estrogen-based statistical variable
GENESTR: Gender- and estrogen-based statistical variable PBS: Phosphate-buffered
PCTPREB: Percent of total apoA-I in prebeta-1 HDL RPCTPREB: Square root of PCTPREB A
FIGURES
Page
Figure 1.1 2D gel electrophoresis of plasma demonstrating
multiple HDL subspecies 21
Figure 2.1 The prebeta-1 HDL cycle 26
Figure 2.1 Immunoaffinity anti-apoA-I column with bound A-I
containing lipoproteins being eluted with 3M acetic acid 33
Figure 3.2 FPLC tracing of starch block prepared prebeta-1 HDL
showing single prebeta-1 HDL peak 35
Figure 3.3 Agarose gel immunoelectrophoresis comparing (A) plasma, (B) A1HDL isolated by immunosorption, (C) prebeta-1
HDL, (D) alpha HDL both isolated via starchblock electrophoresis
of A1 HDL isolated by immunosorption 35
Figure 3.4 FPLC tracing of starch-block-prepared prebeta-1 HDL
prior to tritiation 37
Figure 3.5 Immunoelectrophoretogram (A) Tritiated prebeta-1 HDL tracer, (B) Cold prebeta-1 HDL prior to tritiation,
(C) Alpha HDL isolated from starch block 38
Figure 3.6 Isolation of prebeta-1 HDL using ultrafiltration 39
Figure 3.7 Detection of prebeta-1 HDL added to plasma 41
Figure 3.8 Microcon 100, Amicon Corp., Cambridge, MA 42
Figure 3.9 Process and principles of measurement of prebeta-1HDL 46 by ultrafiltration/isotope dilution technique
Figure 3.10 Histogram of distribution of prebeta-1HDL levels in normal 47 volunteers
Figure 5.1 Frequency distribution of percent prebeta-1 HDL 61 as percent of total apolipoprotein A-I in plasma samples
from normolipidemic subjects
Figure 5.2 Frequency distribution of absolute levels of prebeta-1
TABLES
Table 3.1 Plasma Levels of Lipids, Lipoproteins, Prebeta1-HDL and 47 Apolipoprotein A-I in 86 Normal Subjects
Table 4.1 Summary of study populations in which prebeta-1 HDL 49 levels were measured using the ultrafiltration-isotope
dilution method
Table 4.2: Subjects meeting criteria for diagnosis of CHD 55
Table 4.3 Demographic and clinical characteristics of subjects. 56 Data presented as number of subjects (%), mean SD
or median (median absolute deviation). (Number of subjects for each demographic and clinical
characteristic varies because of missing data)
Table 5.1 Summary of study populations in which prebeta-1 HDL 60 levels were measured using the ultrafiltration-isotope
dilution method
Table 5.2 Lipid and Lipoprotein levels for study 2. 61 Values given as mean +/- SD. ApoA-1, total plasma apoA-1;
% prebeta, percent of total apoA-I in prebeta-1HDL; Abs. prebeta, concentration of prebeta-1HDL in plasma
Table 5.3: Correlations of response variables with potential 63 predictors. TG: triglycerides; HDLC, LDLC and VLDLC:
HDL cholesterol, LDL cholesterol and VLDL cholesterol respectively in mg/dL; BMI: body mass index; r: Pearson Correlation Coefficients; p: P value, n: number of subjects
Table 5.4 Parameter estimates for final model. 65
Table 5.5 Adjusted means of response variables by gender, 67 ESTRSTAT, and GENESTR. ESTRSTAT = estrogen-based
statistical variable; GENESTR = gender and
estrogen-based statistical variable; PCTPREB = percent of total apoA-I in prebeta-1 HDL; ABSPREB = absolute amount of apoA-I in prebeta-I HDL.
Table 5.8 Individual subjects’ plasma prebeta-1 HDL Values 71 (ug/mL) before and after exercise
Table 5.9 Demographic and clinical characteristics 72 according to tertiles of prebeta-1 HDL.
Table 5.10. Associations of prebeta-1 HDL tertile with 75 coronary heart disease and myocardial infarction
Chapter 1
1.1 Introduction
Coronary atherosclerosis remains the greatest cause of morbidity and mortality in both men and women in the western world. Refining cardiovascular risk assessment remains challenging and efforts have continued in this area over many decades. Our understanding of HDLc and its complex relationship to atherosclerosis has evolved significantly over recent decades. For many years the concept of HDLc being “good cholesterol” or a strong negative risk factor for cardiovascular disease were based on the early studies of Glomset (Glomset, 1968) , Miller (Miller & Miller, 1975) and the Framingham study in the 1960’s and 1970’s (Gordon, Castelli, Hjortland, Kannel & Dawber, 1977)which confirmed that HDLc is a strong negative risk marker for cardiovascular disease. Between 1994 and 2001 further studies, including both primary and secondary prevention studies, confirmed the cardiovascular benefits of pharmacologically raising HDL.
process, in order to improve diagnosis, prevention, and treatment of cardiovascular disease (Brewer, 2007; Rosenson, 2010). A significant challenge is the lack of robust scalable methods to quantitate HDL subspecies. Prebeta-1 HDL is a 67-kDA species of plasma HDL that contains two copies of apoA-I. It functions in a metabolic cycle of cholesterol retrieval and may be formed during lipolysis in plasma. It has been identified as the quantum particle in reverse cholesterol transport and therefore has a pivotal role in the cholesterol retrieval pathway. The ability to quantify prebeta-1HDL levels may be useful in refining risk stratification for atherosclerotic vascular disease. The main objective of this research was to develop a scalable method for the quantification of prebeta-1 HDL and to use this method to determine the normal levels and also to measure prebeta-1 HDL in various populations.
1.2
HDL and Atherosclerosis
The term “atherosclerosis” was first proposed by the pathologist Felix Marchand in 1904, from the Greek “athero,” meaning gruel or paste, and “sclerosis,” meaning hardening, to describe the appearance that he observed inside a hardened artery (Li & Fang, 2004).The role of cholesterol, in the pathogenesis of atherosclerosis has been elucidated via experimental, genetic, epidemiologic and therapeutic research and has been described as one of cardiology’s great 20th century discoveries (Mehta & Khan, 2002) .
density lipoprotein or HDL, was paradoxically reduced in patients who had coronary heart disease, in contrast to the bulk of plasma lipoproteins that were notably increased (Barr, Russ & Eder, 1951). In 1964 Glomset and Wright proposed a concept of reverse cholesterol transport, with cholesterol being transported from the periphery to the liver for metabolism and excretion, and suggested the use of HDLc concentration as a biomarker of efflux (Glomset & Wright, 1964).
1.3
Primary and secondary prevention studies raising HDL
Between the early 1960’s and 2009 HDL cholesterol was investigated as a risk marker in 68 long-term population-based studies involving more than 300,000 individuals. In multivariate models adjusted for non-lipid and lipid risk factors, raised levels of HDL cholesterol were identified as having an atheroprotective effect (Emerging Risk Factors et al., 2009).
1.3.1 The Framingham Heart Study
1.3.2 The Helsinki Heart Study
The Helsinki Heart Study was one of the first clinical trials that demonstrated the benefit of raising HDL-C and lowering triglyceride levels in individuals with low baseline HDL-C levels was (Manninen et al., 1992). 4081 men with dyslipidemia were randomized to receive the fibrate drug gemfibrozil or placebo. At 5 years follow-up, gemfibrozil therapy increased HDL-C levels by 11% and reduced total cholesterol (TC), LDL-C, and TG levels by 10%, 11%, and 35% respectively. Gemfibrozil therapy reduced the primary end point of cardiac death or non-fatal MI by 34% (27.3 vs 41.4/1,000, p < 0.02) with the greatest reduction found in patients with baseline low HDL-C and high triglycerides (Manttari et al., 1990)(Manttari et al 1990).
1.3.3 The Scandinavian Simvastatin Survival Study Group
The Scandinavian Simvastatin Survival Study Group (4S) was published in 1994. (1994). This was a large, randomized, placebo-controlled trial evaluating simvastatin (20–40 mg/day) in 4444 men and women aged 35–70 years over a median follow-up period of 5.4 years. Simvastatin therapy decreased TC and LDL-C 25% and 35%, respectively and increased HDL-C by 8% compared to placebo. Simvastatin treatment resulted in a 30% relative risk reduction in overall mortality (8.2% vs 11.5%, p = 0.0003) and reduced non-fatal MI, ischemic heart disease death, and coronary revascularization (1994).
1.3.4 The Air Force/Texas Coronary Atherosclerosis Prevention Study
while increasing HDL-C levels by 6%. After more than 5 years of follow-up, the absolute risk in the primary composite end point of fatal or non-fatal MI, unstable angina, or sudden cardiac death was reduced in absolute terms by 2.2% in men and 1.2% in women with a relative risk reduction of 37%. This study was the first primary prevention study to show that individuals with HDL-C <40 mg/dL received the greatest benefit.
1.3.5 The Veterans Affairs High-Density Lipoprotein Cholesterol Intervention Trial
In 2001, patients with manifest CHD were also reported to benefit from pharmacologically raising HDL-C and lowering TG. The Veterans Affairs High-Density Lipoprotein Cholesterol Intervention Trial (VA-HIT) compared treatment with gemfibrozil versus placebo in more than 2500 men with established CHD, average LDL-C levels (<140 mg/dL), and low HDL-C levels (<40 mg/dL). After a mean follow-up of 5 years, gemfibrozil decreased TG levels by 31% and increased HDL-C levels by 6%, while levels of LDL-C remained quantitatively unchanged; there was a relative risk reduction of 22% (17.3% vs 21.7% p < 0.006) in CHD death and non-fatal MI in the treatment group. Gemfibrozil therapy was associated with a 24% relative risk reduction in the composite end point of nonfatal MI, stroke, and CHD death (p < 0.001) (Robins et al., 2001).
1.4
HDL and it role in reverse cholesterol transport
Griffin & Shaul, 2006; Navab et al., 1996; Watson et al., 1995). The traditional measurement of HDL cholesterol capturing the cholesterol content within all of the HDL particles, while epidemiologically predictive of atherosclerotic cardiovascular events in large populations, appears to be an unreliable indicator in the precise determination of cardiovascular risk (Bruckert & Hansel, 2007).
At a molecular level the underlying exact physiological mechanisms of HDL’s atheroprotective effects are not completely understood. This is primarily because HDL is not a single lipoprotein entity as was previously thought, but consists of a spectrum of several complex structurally and functionally heterogeneous, distinct molecular subspecies which are rapidly and continuously interconverted (Kontush A, 2012). These HDL subspecies differ in physical-chemical properties, protein and lipid composition, metabolism, and physiological functions and increasingly, evidence suggests, in pathophysiological significance. It appears that both the quantity and quality of the circulating HDL subspecies may be important to the optimal function and antiatherogenic potential of HDL. Thus HDL subspecies are functionally heterogeneous and it appears that they vary in terms of their ability to protect against coronary heart disease. However many challenges remain with respect to elucidating these functions, as HDL subspecies are difficult to separate and quantify (Asztalos, Tani & Schaefer, 2011)
by Kane’s group of a HDL particle with prebeta mobility (prebeta-1 HDL) that could be isolated in pure form and in bulk by electrophoresis (Kunitake, La Sala & Kane, 1985). Figure 1.1 shows a 2-D western blot of plasma demonstrating multiple HDL subspecies using an anti Apo-AI antibody to detect Apo A-I containing (HDL by definition) lipoproteins.
Chapter 2
2.1 Introduction
Prebeta-1 HDL was so named on the basis of its electrophoretic mobility, and was found to have a particle mass of about 65 kDa. About ninety percent of its mass is exclusively apoA-I protein. The remainder of the mass is comprised of unesterified cholesterol and phospholipid, a small amount of cholesteryl esters, and no triglyceride. (Kunitake, La Sala & Kane, 1985)
This unique conformation of apoA-1 in prebeta-1 HDL may be of key importance for the receptor interactions of prebeta1HDL and this may be the primary basis for the diminished affinity of prebeta-1 HDL for binding to “traditional HDL receptors” in human hepatocytes (Kunitake, Mendel & Hennessy, 1992)and to the scavenger receptor class B type I (SR-BI) receptor (Liadaki et al., 2000). These properties suggested a special role or roles for prebeta-1 HDL in lipid metabolism. The scavenger receptor class B type I (SR-B1) is known to play an important role in meditating the uptake of HDL-derived cholesterol and cholesteryl ester in the liver and steroidogenic tissues, however prebeta- 1 HDL was therefore not involved in this process (Valacchi, Sticozzi, Lim & Pecorelli, 2011).
2.2
Prebeta-1 HDL cycle
A number of important studies in the late 80’s and early 90’s elucidated the natural life cycle of prebeta-1 HDL in the plasma and gave clues to its function in reverse cholesterol transport. Firstly it was found that prebeta-1 HDL particles disappear when plasma is incubated at 370C, adding to the mass of larger a HDL, thus appearing to be converted into the larger HDL species. Secondly an LCAT inhibitor blocked this conversion, indicating that prebeta-1 HDL is a substrate for cholesterol esterification by that enzyme. Thirdly the pre-beta-1 particles were shown to acquire cholesterol from fibroblasts (Castro & Fielding, 1988), and incubation of large alpha HDL particles with CETP released prebeta-1 HDL (Kunitake, Mendel & Hennessy, 1992). Subsequent studies confirmed that prebeta-1 HDL is a substrate for LCAT, and that it is produced during cholesteryl ester transfer by CETP. A role for phospholid transfer protein was also discovered in the formation of pre-beta-1 HDL (Nakamura, Kotite, Gan, Spencer, Fielding & Fielding, 2004)
Fielding, 1988; Kunitake, La Sala & Kane, 1985). ABCA1 transporter is a cholesterol efflux regulatory protein, which is a major regulator of cholesterol and phospholipid homeostasis through out the body. It appears that there is a network of ABC transporters involved in cellular lipid homeostasis, directly linked to high density lipoprotein
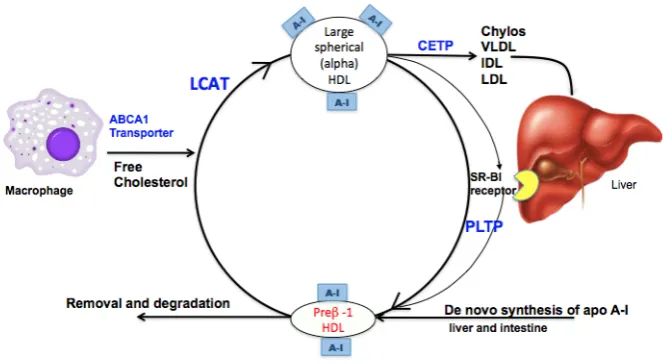
metabolism and atherogenesis (Schmitz & Langmann, 2001). In summary HDL mediated reverse cholesterol transport can be divided into four phases (Figure 2.1)
Phase 1: Transfer of free cholesterol (FC) to prebeta-1 HDL via ABCA1
Pre-β HDL is formed firstly as nascent apolipoprotein A1 by either de novo secretion from hepatocytes or the intestinal mucosa, direct dissociation from chylomicrons and very low density lipoprotein (VLDL) mediated by lipoprotein lipase (LL), it is also a substrate and a product in the interconversion of HDL species (Kwiterovich, 1998). Once generated, pre-β HDL receives free cholesterol and phospholipid from peripheral cells (Castro & Fielding, 1988) by associating with the surface protein ABCA1 (Oram & Lawn, 2001) (Wang, Lan, Chen, Matsuura & Tall, 2004) which is expressed by the liver and intestinal mucosa (Adorni et al., 2007)
Phase 2: Esterification of surface-associated FC by the enzyme LCAT
Phase 3: Transfer of FC and TG between HDL-C and Apo B-containing lipoproteins mediated by the enzyme CETP
The enzyme cholesteryl ester transfer protein (CETP) exchanges CE from large spherical alpha-HDL for TG in LDL-C and VLDL facilitating regeneration of prebeta HDL. Newly acquired CE in VLDL and LDL-C is then taken up by the hepatic LDL receptor for excretion as bile (Morton & Greene, 1997).
Phase 4: Uptake by SR-B1 receptor on the liver and catabolism of mature HDL-C into bile or small HDL-C particles by HL
[image:26.595.68.400.346.528.2]As CE accumulate in its central core, pre-β HDL-C matures into larger spherical alpha- HDL particles These larger molecules undergo hepatic catabolism and excretion in bile.
Figure 2.1. The prebeta-1 HDL cycle
The steady state levels of prebeta-1 HDL must therefore reflect the rate of generation from denovo synthesis, the rate of removal by LCAT esterification of its free cholesterol, its regeneration during alpha HDL catabolism including transfer of cholesterol esters from HDL to acceptor lipoproteins by CETP and the action of PLTP, and loss to the system via ultrafiltration at the glomerulus (figure 2.1). Since prebeta-1 HDL occupies a central role in the reverse cholesterol transport system, an ability to quantify this HDL sub species may refine the assessment the clinical effects of different agents that modulate its function and metabolism, but as a measurable biomarker it may also allow a more efficient prediction of cardiovascular risk enhancing the ability of clinicians to optimally manage patients.
2.3
Justification for Research described in this thesis
Since prebeta-1HDL is known to be the quantum particle in RCT, insight into changes in prebeta-1 HDL levels in health and disease states may provide a greater understanding of its relationship to vascular health and may provide some insight into the mechanisms associated with the strong inverse association between total HDL cholesterol and cardiovascular disease. The ability to measure prebeta-1HDL levels may provide a novel biomarker of cardiovascular risk and may help to identify new therapeutic targets.
2.4
Limitations of methods previously described for
measurement of prebeta-1 HDL
The requirement for a novel reliable easy to use method to quantify prebeta-1 HDL directly from plasma is underscored by the number of previously described methods, which are slow, technically difficult and generally semi quantitative, catering for small numbers of samples at any one time. In addition some of these methods fail to fully separate the quantum prebeta-1 HDL subspecies from other HDL subspecies with prebeta electrophoretic mobility.
1992), and 2-D electrophoresis with phosphorimaging of anti-apoA-I Western blots from two-dimensional agarose/native gradient polyacrylamide gel electrophoretic separations (Asztalos, Sloop, Wong & Roheim, 1993). These methods tend to be semiquantitative because of intrinsic nonlinearities in solid-phase capture efficiency and immunologic staining intensity of the apoA-I moiety in lipid-poor, prebeta-1 HDL compared with lipid-rich, large HDL (Lefevre, Goudey-Lefevre & Roheim, 1987). Prebeta-1 HDL has also been measured in whole plasma using agarose electrophoresis followed by immunofixation (Giunta, Maddalena-Peruzzi, Gaudio & Semprini, 1992; Semprini, Maddalena-Feruzzi & Giunta, 1992), immunoprecipitation (Daerr, Minzlaff & Greten, 1986; Kunitake, La Sala & Kane, 1985), Western blotting (Miida et al., 1996) and radial immunodiffusion (Borresen & Berg, 1980) A monoclonal antibody capable of selectively binding pre-β1 LpA-I, has been described (Miyazaki, Kobayashi,
Chapter 3
3.1 Introduction
This chapter describes the development of a novel simple, highly reproducible scalable method for quantification of native prebeta-1 HDL from plasma by combining plasma ultrafiltration with analysis using the isotope dilution principle and ELIZA. All studies involving human subjects requiring any or all of medical history, physical examination, collection of fasting blood samples, were approved by the Committee on Human Research of University of California San Francisco and written informed consent was obtained from all subjects for participation in this research. The Pepperdine University Institutional Review Board approved the study on the effects of acute exercise in normolipidemic subjects, and written informed consent was obtained from all subjects.
3.2 METHOD OUTLINE
The development of this technique required:
3.2.1 Collection of plasma
3.2.2 Isolation and purification of prebeta-1 HDL for use as a
tracer
3.2.2.1 Immunoaffinity Columns to isolate apoA-1 containing Lipoproteins
3.2.2.2 Starch Electrophoresis to separated prebeta-1HDL from alpha HDL
3.2.2.3 Assessment of prebeta-1 HDL purity
3.2.2.3.1 Nondenaturing gradient gel electrophoresis
3.2.2.3.2 SDS polyacrylamide gradient gels
3.2.2.3.3 FPLC
3.2.2.3.4 Agarose gel
electrophoresis/Immunoelectrophoresis
3.2.3.1 Assessment of purity of tracer prebeta-1 HDL
3.2.3.2 Integrity of the prebeta-1 HDL tracer
3.2.3.3 Storage of radiolabeled tracer prebets-1 HDL
3.2.4 Ultrafiltration of apoA-1 lipoproteins isolated by
selected affinity immunosorption
3.2.4.1 Ultrafiltration of peaks from starch block
3.2.4.1 Assessment of protein retention by ultrafilter
3.2.5 Quantification of prebeta-1 HDL in plasma by
ultrafiltration of plasma samples and application of isotope
dilution principle
3.2.6.1 Specific activity of Apo A-I in ultrafiltrate
3.2.6.2 Immunoassay Apo A-I in plasma and ultrafiltrate
3.2.6.3 Assessment of plasma specimen stability
3.2.6.4 Fresh and Frozen Plasma samples quantification of prebeta-1HDL
3.2.6.5 Interassay coefficient of variation for determination of prebeta-1 HDL
3.2.6.6 Calculation of total mass of prebeta-1HDL in plasma samples
3.2.6.7 Assessment of plasma specimen stability
3.2.6.8 Fresh v’s frozen plasma assessment
3.3 Quantification of prebeta-1 HDL l in 86 normolipidemic
subjects
3.2 MATERIALS AND METHODS
3.2.1 Collection of plasma
of pure prebeta-1 HDL for preparation of the tracer and also for subject samples for measurement of prebeta-1 HDL.
Freshly drawn blood is immediately mixed with the following preservatives: 0.08% (w/v) EDTA; 0.1% (w/v) sodium azide; 50 μg/ml benzamidine; 300 μg/ml ε-amino caproic acid; and 10 μg/ ml gentamycin sulfate (all final concentrations). After mixing gently, the tubes are immediately chilled on ice to arrest the activity of LCAT and, hence, stop conversion of prebeta-1 HDL to alpha HDL species (Kunitake, 1987). Plasma is separated by centrifugation at 1000g for 20 min at 0– 40C. Until the analyses are completed, the plasma is kept at 0–40C or is frozen at -70 to -800C. Total cholesterol and triglyceride levels in plasma are determined by standard chemical techniques (Kunitake, La Sala & Kane, 1985), total HDL cholesterol is measured by precipitation of apoB-containing lipoproteins with dextran sulfate (Bachorik, 1986), and total apoA-1 is measured by enzyme-linked immunosorbent assay (ELISA) as described below.
3.2.2 Isolation and purification of prebeta-1 HDL for use as tracer
3.2.2.1 Immunoaffinity Column to isolate apoA-1 containing Lipoproteins
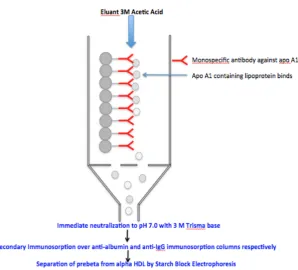
operated under a nitrogen atmosphere in the cold room. Apo A-I-containing lipoproteins bind to the anti A-I column and are subsequently eluted with 3 M acetic acid, (fig x) and the eluate is neutralized immediately to pH 7.0 with 3 M Trisma base. Residual trace albumin and immunoglobulins are removed by passage over anti-albumin and anti-IgG immunosorption columns, respectively.
Figure 3.1 Immunoaffinity anti-apoA-1 column with bound A-I containing lipoproteins being eluted with 3M acetic acid
3.2.2.2 Starch electrophoresis to separate prebeta-1HDL from alpha HDL
with 0.05 M phosphate containing 0.08% EDTA at pH 7.4 and the apoA-1 content of each fraction is detected by rate immunonephelometry on a Beckman ICS Analyser II immunochemistry system (Kunitake, La Sala & Kane, 1985). The high-molecular-weight components, prebeta-2 and pre- beta-3 HDL (Castro & Fielding, 1988) , are excluded by pooling only the eluates from the cathodic upswing of the prebeta HDL peak to its apex. The prebeta-1 HDL eluate is concentrated to between 0.2 and 0.5 mg/ml by diafiltration in a Micro-ProDiCon vacuum dialysis concentrator (Spectrum).
3.2.2.3 Assessment of prebeta-1 HDL purity
The purity of isolated prebeta-1HDL is assessed by four methods:
3.2.2.3.1 Nondenaturing gradient gel electrophoresis: Electrophoresis of 10 – 20 μg of protein ( amount determined by Bronstead Lowry method (Lowry, Rosebrough, Farr & Randall, 1951)) in nondenaturing 3 – 34% polyacrylamide gradients to determine that the apparent molecular weight is 67kDa.
3.3.3.3.2 SDS polyacrylamide gradient gels: Electrophoresis in 5 – 25% SDS polyacrylamide gradient gels, immunoblotted with anti- apoA-1 antibodies and stained with Coomassie blue to ensure that the accompanying apolipoprotein is apoA-1.
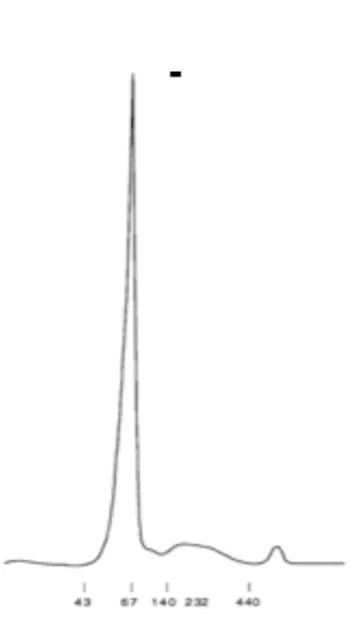
Figure 3.2 FPLC tracing of starch block prepared prebeta-1 HDL showing single prebeta-1 HDL peak
3.2.2.3.4
Agarose gel electrophoresis/Immunoelectrophoresis Prebeta mobility is verified by vertical agarose gel
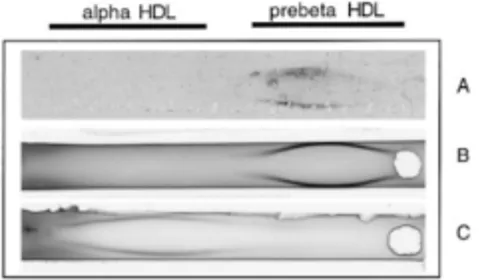
[image:35.595.234.546.110.338.2]electrophoresis (Asztalos, Sloop, Wong & Roheim, 1993). Initially this was also demonstrated by immunoelectrophoresis (Kunitake, La Sala & Kane, 1985) in 1% agarose using monospecific goat antiserum directed against apoA-1.
Figure 3.3 Agarose gel immunoelectrophoresis comparing (A) plasma, (B) A1HDL isolated by immunosorbtion, (C) prebeta-1 HDL and (D) alpha HDL both isolated via starchblock electrophoresis of A1 HDL isolated by
immunosorption
[image:35.595.273.465.568.656.2]3.2.3 Radiolabeling of tracer prebeta-1 HDL
The purified pre- beta-1 HDL is labeled by the formation of a tritiated adduct using N-succinimidyl [2,3-3H] propionate [sp act 100 Ci/mM (Amersham)] at 1–40C for 6 h in PBS (Fink & Gainer, 1980) The lipoprotein (0.2–0.5 mg) is labeled in a volume of 0.25 to 0.5 ml. Label that is not covalently bound is removed by diafiltration at 00C against four changes of 4 liters each of PBS containing EDTA and azide as above for 36 h. Specific activity of the tracer lipoprotein is measured by ELISA for measuring apoA-1 concentration and by measurement of radiolabel by scintillation counting in a Beckman LS 7000 liquid scintillation counter using Cytoscint scintillation cocktail (ICN Bio- medicals). A specific activity (the amount of radiolabeled mass in a sample) of 8000 – 9000 cpm/mg of A-I apoprotein is optimal for analysis by the isotope dilution method.
3.2.3.1 Assessment of purity of tracer prebeta-1 HDL
3.2.3.2 Integrity of the prebeta-1 HDL tracer
[image:37.595.314.492.230.541.2]The integrity of the prebeta HDL tracer was also tested. On FPLC the purified fraction was shown to comprise a major peak with an elution volume corresponding to 67 kDa (Figure 3.4).
Figure 3.4 FPLC tracing of starch-block-prepared
prebeta-1 HDL prior to tritiation. Elution positions of
The radiolabel had prebeta electrophoretic mobility in immunoelectrophoresis (Figure 3.5), and the apparent molecular weight was 67 kDa by nondenaturing gradient gel electrophoresis (data not shown).
Figure 3.5 Immunoelectrophoretogram. A: Tritiated prebeta-1 HDL tracer. B: Cold prebeta-1 HDL prior to tritiation. C: Alpha HDL isolated from starch block. Apo A-I was immunolocalized using monospecific goat anti-human apoA-1 antiserum.
Finally, protein electrophoresis in SDS showed the entire label to be present in intact apoA-1 (data not shown). The extent of lipid labeling of the prebeta A-I tracer measured following lipid extraction in chloroform–methanol was less than 1%.
3.2.3.3 Storage of radiolabeled tracer prebeta-1HDL
[image:38.595.112.352.213.353.2]3.2.4 Ultrafiltration of Apo A-I lipoproteins isolated by selected affinity immunosorption
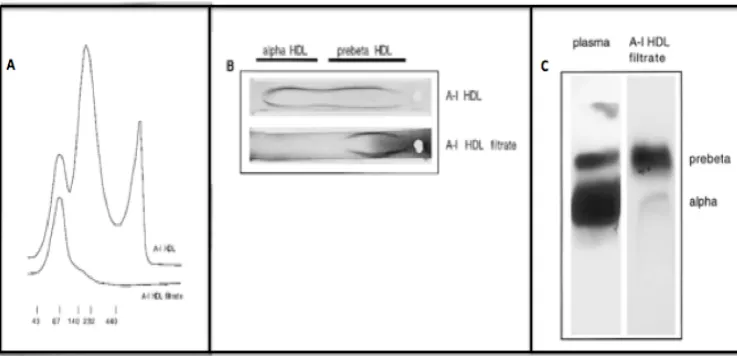
[image:39.595.200.569.400.578.2]When the entire apoA-1 lipoprotein fraction isolated by selected affinity immunosorption was subjected to ultrafiltration, the ultrafiltrate was found to contain only pre- beta-1 HDL by FPLC analysis (Fig. 3.6A) and by nondenaturing gradient gel electrophoresis (data not shown). In addition, when plasma was subjected to ultrafiltration, the filtrate migrated with prebeta mobility on an immunoelectrophoresis gel (Fig. 3.6B) and vertical agarose gel electrophoresis (Fig. 3.6C), indicating the selective filtration of prebeta-1 HDL. In addition, purified pre- beta-1 HDL was subjected to ultrafiltration and ultrafiltered a second time, demonstrating that its filtration fraction was constant. Apo A-I was immunolocalised by western blotting using monospecific goat anti human apoA-1 antiserum.
Figure 3.6 Isolation of prebeta-1 HDL using ultrafiltration.
(A) Comparison of FPLC tracings of Apo A-I containing lipoproteins isolated by immunosorption (upper tracing) and ultrafiltration (lower tracing).
3.2.4.1 Ultrafiltration of peaks from starch block
When the alpha-migrating peak from starch block was subjected to ultrafiltration, apoA-1 was undetectable in the ultrafiltrate. When prebeta-1 HDL, recovered from the ultrafiltrate of the total apoA-1 lipoprotein fraction, was subjected to a second ultrafiltration, it retained the electrophoretic characteristics of freshly isolated pre- beta-1 HDL. These observations indicate that the ultrafilter retains all of the HDL species larger than pre- beta-1 HDL and that prebeta-1 HDL is not formed passively from larger alpha-migrating HDL in the absence of acceptor lipoproteins and cholesteryl ester transfer (Fielding & Fielding, 1995; Hennessy, Kunitake & Kane, 1993). By maintaining the sample temperature at 1–40C at all times the activity of LCAT is effectively blocked, thus preventing the conversion of prebeta-1 HDL to alpha HDL species.
3.2.4.2 Assessment of protein retention by ultrafilter
As expected in ultrafiltration, based on the geometry of the ultrafilter, there was partial retention of the 67- kDa prebeta-1HDL particle, similar to the behavior of albumin. The observed concentration ratio between the applied solution and filtrate was the same for tritium-labeled tracer prebeta-1 HDL added to plasma as for the tracer when applied in aqueous buffer (0.43 +/- 0.06, n = 4). This observation indicates that the presence of plasma proteins does not significantly affect ultrafiltration of pre- beta-1 HDL and that the lipoprotein has very limited physical interaction with the tube or filter material. The isotope dilution principle inherently corrects for all such effects.
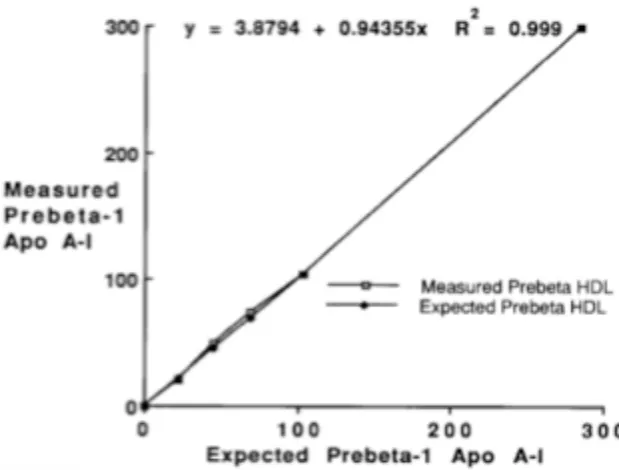
filtration fraction for prebeta-1 HDL remained constant over a range of 10 to 300 μg/ml. The detection of incrementally added unlabeled prebeta-1 HDL in plasma samples was linear, with a correlation coefficient close to unity (r=0.99) (Figure 3.7).
Figure 3.7 Detection of prebeta-1 HDL added to plasma. Increasing
amounts of unlabeled prebeta-1 HDL (35-105 microgram apoA-1/ml) were added in duplicate to standard plasma samples and ultrafiltered. The recovery of prebeta-1 HDL is shown and the regression equation is representative of the results of four similar experiments.
3.2.6 Quantification of prebeta-1 HDL in plasma by ultrafiltration of plasma samples and application of isotope dilution principle
Plasma samples were spiked with known prebeta-HDL tracer counts ultrafiltered and specific activity of apoA-1 in ultrafiltrate determined as follows:
A-I apoprotein, is added to 1.0-ml samples of fresh or thawed plasma by a robotic pipetter (Beckman Biomek 1000 automated laboratory workstation) with five programmed mixing cycles. Alternatively, manual mixing may be employed. A 400- μl aliquot of the labeled plasma is transferred to each of two centrifugal ultrafilters (Microcon 100, Amicon Corp., Cambridge, MA figure 3.8) and centrifuged at 1 – 40C at 300g in a refrigerated microcentrifuge rotor in which 18 tubes rest at a 300 angle (Eppendorf Model 5402).
Figure 3.8 Microcon 100, Amicon Corp., Cambridge, MA
After 45 min no more than 50 μl will have been filtered. Adjustment of centrifugation time can be made such that no more than this quantity is ultrafiltered. This is important to provide uniform ultrafiltering of all samples.
3.2.6.1 Specific activity of Apo A-I in ultrafiltrate
Specific activity (the amount of radiolabeled mass:
3.2.6.2 Immunoassay of Apo A-I in plasma and ultrafiltrate
The method for ELISA has been described previously (Kunitake, 1996). Some modifications were introduced to simplify the assay while still retaining the same response to apoA-1 in prebeta-1 HDL as in larger HDL complexes.
• Standards and samples were initially diluted 50-fold with PBS, pH 7.5, containing 5 mM sodium dodecyl sulfate and 0.13% Thesit (polyoxyethylene 9-lauryl ether, Sigma, St. Louis, MO) and are incubated at 1 – 40C for 75 min to induce uniform exposure of apoA-I epitopes.
• Ninety-six-well plates were coated with 50 μl per well of the capture antibody, goat anti-apoA-1 antibodies, diluted to 1 μg/ml IgG in PBS, and incubated for 75 min at 370C.
• The plates are then washed three times with ELISA wash buffer [PBS, pH 7.5, 0.05% Tween 20, and 0.5% bovine serum albumin (BSA) (Sigma, RIA grade)] and blocked with 3% BSA in PBS, pH 7.5, for 1 h at 370C with shaking. This is followed by six washes with the wash buffer.
• After incubation for 1 h at 370C, the plates are washed six times with wash buffer. Bound antigen is detected by addition of the detection antibody, 50 μl (1.3 mg/ml IgG) of an affinity-purified monospecific goat polyclonal antibody to apoA-1, conjugated to horseradish peroxidase (HRP).
• Specifically bound HRP is quantitated colorimetrically with 50 μl per well of ABTS peroxidase substrate-one component (Kirkegaard & Perry, Gaithersburg, MD). The reaction is stopped with 50 μl per well of 1% SDS.
• The optical density of the reaction product is measured at 405 nm using an automated microtiter plate reader (Molecular Devices, Mountain View, CA).
• The standard curve is generated with dilutions of purified human apoA-1. It extends from 0 to 50 mg/ml and is linear over the range of 6 to 25 ng/ml. A frozen plasma standard and a frozen standard ultrafiltrate are included in each plate for quality control.
• Linearity of detection of prebeta-1 HDL was tested by addition of increasing amounts of unlabeled purified prebeta-1 HDL to plasma samples and measuring the incremental prebeta-1 HDL detected by the isotope dilution technique.
3.2.6.3 Assessment of plasma specimen stability
3.2.6.4 Fresh and Frozen Plasma samples: quantification of prebeta-1HDL
Prebeta-1 HDL levels obtained from fresh and stored frozen plasma samples were not statistically different.
3.2.6.5 Interassay coefficient of variation for determination of prebeta-1 HDL
The interassay coefficient of variation for determination of prebeta-1 HDL was 7% for the plasma standard and 6.6% for the ultrafiltrate standard for 21 sequential assays. Intra-assay coefficient of variation for duplicate assays was 7.5%.
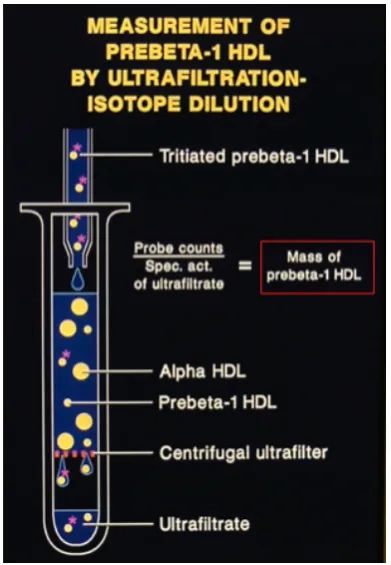
3.2.6.6 Calculation of total mass of prebeta-1 HDL in plasma samples
To calculate the total mass of prebeta-1 HDL per plasma sample, the isotope dilution equation was employed (figure 3.9).
Figure 3.9 Process and principles of measurement of prebeta-1HDL by ultrafiltration/isotope dilution technique.
3.3 Quantification of prebeta-1 HDL in 86 normolipidemic subjects
Table 3.1 Plasma Levels of Lipids, Lipoproteins, Prebeta1-HDL and Apolipoprotein A-I in 86 Normal Subjects
[image:47.595.240.565.391.594.2]3.3.1 Distribution of prebeta-1HDL levels in 86-normolipidemic subjects
Figure 3.10 shows the distribution of prebeta HDL levels in the entire group of normal individuals. Although not statistically significant in this study, there was a trend towards higher levels of prebeta HDL in males than in females.
Chapter 4
4.1 Introduction
This chapter describes three studies, which apply the ultrafiltration-isotope dilution method described in chapter 3 for quantification of prebeta-1 HDL in the three populations defined in the table below. The results of the studies are shown in chapter 5 and the discussion in chapter 6.
Study Study name Reference
1. Measurement of prebeta-1 HDL in plasma
of normolipidemic subjects: influences of plasma lipoproteins, age, and gender.
(O'Connor et al., 1998)
2. The Effects of Physical Exercise on Plasma Prebeta-1 High-Density Lipoprotein.
(Jafari et al., 2003) (Erratum in Metabolism.2003Oct;270(19): 4039)
3. Relation of Increased Prebeta-1 High-Density Lipoprotein Levels to Risk of Coronary Heart Disease.
[image:49.595.194.567.206.369.2](Guey et al., 2011)
Table 4.1. Summary of study populations in which prebeta-1 HDL levels were measured using the ultrafiltration-isotope dilution method
All studies involving human subjects requiring any or all of: medical history, physical examination, collection of fasting blood samples, were approved by the Committee on Human Research of University of California San Francisco and written informed consent was obtained from all subjects. The Pepperdine University Institutional Review Board approved the study examining the effects of acute exercise in normolipidemic subjects and written informed consent was obtained from all subjects. Expert advice was sought regarding statistical analysis.
4.2 Study 1: Measurement of prebeta-1 HDL in plasma of
normolipidemic subjects: influences of plasma lipoproteins,
age, and gender
(O'Connor et al., 1998).
4.2.1 Subjects
which four were receiving exogenous estrogens and seventy-four were pre-menopausal of which four were receiving exogenous estrogens. None of the 136 subjects was receiving medications known to affect lipids, other than estrogens. Accurate data for calculation of BMI were available on 92 subjects. BMI ranged from 17.9 to 41.6, mean 22.6 with four values exceeded a BMI of 30.
4.2.2 Lipoprotein measurements
Blood was drawn, after a minimum 10 h fast, into tubes containing sodium EDTA, 1.7-mg/ml final concentration. The blood was chilled immediately on ice to inhibit LCAT activity (Kunitake, 1987) and was kept at 0°C during the separation of plasma and during storage up to 24 hours before lipoprotein measurements were made.
Individual lipoprotein fractions were separated by sequential ultracentrifugation in 92 of the 136 samples and triglyceride and cholesterol contents of these lipoprotein fractions were measured (Havel, Eder & Bragdon, 1955). Total triglyceride and cholesterol contents were measured in all samples by automated fluorescence analysis (Hoffman-LaRoche, Inc., Nutley, NJ). HDL was measured by precipitation with heparin and manganese (Warnick, Benderson & Albers, 1982) in 44 samples. For those samples the LDL cholesterol was calculated by the Friedewald formula (Friedewald, Levy & Fredrickson, 1972). Where LDL cholesterol and HDL cholesterol measurements were available, VLDL cholesterol was approximated as the difference between total cholesterol levels and the sum of HDL cholesterol and LDL cholesterol levels. Total apoA-1 was measured by ELISA and prebeta-1 HDL was measured by the ultrafiltration-isotope dilution method as described in chapter 3 (3.2.5) (O'Connor et al., 1997).
4.2.3 Statistical Analysis
Akaike information criterion (TSAI, 1989)) were selected. Partial regression plots, residual plots, and Cook's distance were examined to check analysis assumptions and detect outliers. Power transformations of response variables were examined using the methods of Box and Cox (Box G. E. P., 1964). Covariate-adjusted means for levels of categorical factors were generated using procedure GLM (least-squares means).
4.3 Study 2: The Effects of Physical Exercise on Plasma
Prebeta-1 High-Density Lipoprotein (Jafari et al., 2003).
4.3.1 Subjects
This study included nineteen nonsmoking men and women volunteers in self-reported good health who were not taking medications that would effect their plasma lipids (including lipid-lowering agents and oral contraceptives). They maintained their usual diets, and were able to complete the required exercise protocol. The study was carried out in collaboration with colleagues from the Department of Medicine, University of California, Irvine, Irvine, CA; UCLA School of Medicine and VA Greater Los Angeles Healthcare System, Los Angeles, CA; Department of Sports Medicine, Pepperdine University, Malibu, CA.
4.3.2 Protocol
Subjects refrained from participation in physical exercise and consumption of alcohol for 3 days prior to the testing session. They reported following a 12-hour overnight fast to the exercise laboratory. A history and physical examination were performed to confirm each subject’s health status and pre-exercise laboratory collection, which included the following measurements:
(1) Fasting plasma lipids, lipoproteins, Apo A-I, prebeta-1 HDL (2) Percent body fat
(3) Dietary fat and cholesterol intake
regular participation in physical exercise of at least 45 minutes of vigorous, aerobic physical exercise training 3 times per week, or sedentary (SED) if they reported no regular physical exercise behavior. Subjects then underwent a bout of protracted physical exercise consisting of maximal cardiopulmonary exercise (CPX) stress testing followed by a 4-km run-jog (total exercise time, 45 to 60 minutes). Following the exercise bout, blood samples were taken, and handled as previously described, for measurements of fasting plasma lipids, lipoproteins, Apo A-I, and prebeta-1 HDL were repeated.
4.3.3 Procedures
4.3.3.1 Body composition
measurement at a particular site exceeded the first by more than 1 mm. The skinfold thickness at a particular site was taken as the average of the 2 closest measurements. Intra-measurer reliability coefficients for experienced investigators using this technique are 0.97 (triceps), 09.6 (chest), 0.98 (abdomen), 0.97 (supra-iliac), and 0.98 (thigh).
4.3.3.2 Cardiopulmonary Exercise (CPX) testing
CPX testing was conducted using a standard Bruce protocol (Bruce, 1974). Heart rate was continuously monitored during CPX testing by telemetry (Polar Vantage XL, Polar USA, Hartford, CT), with heart rates recorded at one-minute intervals for 10 minutes following exercise. Metabolic measurements for determination of maximal aerobic capacity (VO2max) were made using a MedGraphics CardioO2 system (Medical Graphics, St Paul, MN). Expired gas measurements were recorded at 30-second intervals, and VO2max was determined by the following criteria:
(1) <100 mL increases in VO2 in consecutive 30-second sampling periods prior to exhaustion
(2) Respiratory exchange ratio (RER) in excess of 1.10 (3) Attainment of predicted maximal heart rate +/- 15 bpm
4.3.3.3 Dietary surveys
A 3-day dietary record was dispensed to all subjects within 1 week prior to the run-jog exercise session (Posner et al., 1992) (Crawford, Obarzanek, Morrison & Sabry, 1994). Subjects were instructed to list all daily food and drink intake for 2 days of the week and one day of the weekend. Portion sizes were estimated using household measures, and adherence to typical dietary intake was strongly recommended (Luhrmann, Herbert, Gaster & Neuhauser-Berthold, 1999). Daily caloric intake, dietary cholesterol, and fat were calculated using food composition tables (Grodner TK: Philadelphia, 1996).
4.3.4 Lipoprotein measurements
Two 20-mL fasting blood samples were drawn into tubes containing sodium EDTA, 1.7-mg/ml final concentration from each subject before and immediately after exercise. The blood was chilled immediately on ice to inhibit LCAT activity (Kunitake, 1987) and was kept at 0°C during the separation of plasma and stored at -60°C until assayed. Individual lipoprotein fractions were separated by sequential ultracentrifugation, followed by measurement of the content of cholesterol and triglycerides in each (Havel, Eder & Bragdon, 1955). The content of Apo A-I was measured by enzyme-linked immunoassay (ELISA) and the content of prebeta-1 HDL in plasma was measured using the ultrafiltration-isotope dilution technique described in3.2.4. The relative percentage of plasma Apo A-I present as prebeta-1 HDL and the absolute amount of prebeta-1 HDL in plasma were determined as described earlier (O'Connor et al., 1997).
4.3.5 Statistical Analysis
and pre-exercise plasma levels of plasma HDL-cholesterol, and between male and female subjects’ pre-exercise plasma levels of
HDL-cholesterol. Paired t-tests were conducted for all subjects (N = 19) between pre- and post-exercise plasma levels of fasting plasma lipids, lipoproteins, Apo A-I, and prebeta-1 HDL.
4.4 Study 3: Relation of Increased Prebeta-1 High-Density
Lipoprotein Levels to Risk of Coronary Heart Disease (Guey et
al., 2011)
4.4.1 Subjects
[image:55.595.198.557.586.677.2]Subjects referred because of demonstrable coronary heart disease (CHD) or for risk-factor assessment and management to the University of California–San Francisco Lipid and Cardiology Clinics and to collaborating cardiology practices were recruited for the study. All were clinically stable at time of recruitment. No samples were collected within 2 weeks of a myocardial infarction (MI). The committee on human research of University of California–San Francisco, approved the study and written consent was obtained from all subjects. Because of the potentially confounding effect of lipid-lowering medications, subjects with missing information regarding medication were excluded (n 1,048), leaving 1,255 available for analysis. Subjects were considered to have CHD if any of the following criteria shown in Table 4.2 was fulfilled.
The demographic and clinical characteristics of the subjects included in the study are shown in table 4.3
Demographic and clinical characteristics Number
Age (years) 50.8 +/-16.9
Men 558 (44.4%)
Body mass index (kg/m2) 26.6 +/- 5.4
Caucasian 901 (73.4%)
Asian 192 (15.6%)
Other (African-American, Hispanic, other) 134 (10.9%)
Smoker (Current) 83 (6.6%0
Lipid-lowering medication 193 (15.4%)
Triglycerides (mg/dl) 148 +/- 87.5
LDL (mg/dl) 147.9 +/- 58.6
HDL (mg/dl) 50.8 +/- 18.1
Apo A-1 (mg/ml) 1.17 +/- 0.35
Type 2 diabetes mellitus 105 (8.4%)
Coronary heart disease 454 (36.2%)
[image:56.595.55.323.96.376.2]Myocardial infarction 213 (17%)
Table 4.3 Demographic and clinical characteristics of subjects.
Data are presented as number of subjects (percentage), mean SD, or median (median absolute deviation). Number of subjects for each demographic and clinical characteristic varies because of missing data
4.4.2 Coronary Imaging
The Cardiologists imaged the 4 principal coronary vessels and their branches after administration of nitroglycerin. Angiographic disease was graded by a “sum score” (sum of percent luminal intrusion of all lesions). A sum score of 60 was the threshold discriminant for diagnosis of CHD. Mean sum score was 240.6. Diagnosis of MI was based on 1 of the following: troponin levels, electrocardiographic evidence, or echocardiographic studies. No samples were collected within 2 weeks after an MI.
4.4.3 Lipoprotein measurements
ultracentrifugal fractions (Pullinger et al., 1995) in 65% of subjects including all subjects with TG > 300 mg/dl. VLDL were separated at density 1.006 g/L. LDL and HDL were separated using heparan sulfate and magnesium chloride. In the remainder, apolipoprotein B– containing lipoproteins were precipitated with dextran sulfate,(Warnick, Benderson & Albers, 1982) and LDL cholesterol was calculated by the Friedewald formula (Friedewald, Levy & Fredrickson, 1972). Subjects with plasma triglycerides 500 mg/dl were excluded to avoid confounding alterations in molecular speciation of HDL. Plasma content of prebeta-1 HDL was measured using the ultrafiltration– isotope dilution technique previously described in chapter 3 (3.2.5) (O'Connor et al., 1997).
4.4.4 Statistical analysis
for a 5-year increase. Because of the highly skewed nature of triglycerides, levels were dichotomized at 200 mg/dl in regression models. Interactions between prebeta-1 HDL and gender were also examined. To evaluate the contribution of prebeta-1 HDL to risk models, likelihood-ratio tests were performed comparing risk models with and without the inclusion of prebeta-1 HDL as a predictor. Also, improvements in area under receiver operating characteristic curves were evaluated. Because improvements in area under receiver operating characteristic curves can be insensitive to biomarkers with moderate effect sizes and even established CHD risk factors such as lipids, hypertension, and smoking, (Cook, 2007; Pencina, D'Agostino, D'Agostino & Vasan, 2008) improvement in classification of cases and controls with the addition of prebeta-1 HDL in multivariable models with 2 measurements was evaluated:
(1)Net reclassification index using predefined risk categories of < 6%, 6% to 20% and >20%
(2) Integrated discrimination improvement index.
CHAPTER 5
5. Introduction
This chapter describes the results from the three studies, which apply the ultrafiltration-isotope dilution method described in chapter 3 for quantification of prebeta-1 HDL in the three populations defined in the table below.
Study Study name Reference
1. Measurement of prebeta-1 HDL in plasma
of normolipidemic subjects: influences of plasma lipoproteins, age, and gender.
(O’Connor et al., 1998)
2. The Effects of Physical Exercise on Plasma Prebeta-1 High-Density Lipoprotein.
(Jafari et al., 2003) (Erratum in Metabolism.2003Oct;270(19): 4039)
3. Relation of Increased Prebeta-1 High-Density Lipoprotein Levels to Risk of Coronary Heart Disease.
[image:60.595.53.451.207.373.2](Guey et al., 2011)
Table 5.1. Summary of study populations in which prebeta-1 HDL levels were measured using the ultrafiltration-isotope dilution method
5.1 Study 1: Results for Measurement of prebeta-1 HDL in
plasma of normolipidemic subjects: influences of plasma
lipoproteins, age, and gender
(O'Connor et al., 1998)
Table 5.2 Lipid and Lipoprotein levels for study 2. Values given as mean +/- SD. ApoA-1, total plasma apoA-1; % prebeta, percent of total apoA-I in prebeta-1HDL; Abs. prebeta, concentration of prebeta-1HDL in plasma
[image:61.595.201.551.400.651.2]Figure 5.2 Frequency distribution of absolute levels of prebeta-1 HDL in plasma samples from normolipidemic subjects, μg/ml
5.1.1 Preliminary screening
(Pearsons Correlation Coefficients/Prob>® under Ho: Rho 0/Number of
Obs.) Table 5.3: Correlations of response variables with potential
predictors. TG: triglycerides; HDLC, LDLC and VLDLC: HDL cholesterol, LDL cholesterol and VLDL cholesterol respectively in mg/dL; BMI: body mass index; r: Pearson Correlation Coefficients; p: P value; n, number of subjects
Two alternatives to the gender categories were considered that utilized information on endogenous or supplemental estrogen. An “estrogen status” variable (ESTRSTAT) had: category 1 for males and postmenopausal females without estrogen supplementation, and category 2 for menstruating females and postmenopausal females with estrogen supplementation.
A second recoding with three categories (GENESTR) separated the females from category 1. Preliminary models also including apoA-I, triglycerides, and HDL cholesterol showed no significant differences for gender or the alternatives (P > 0.16), and neither of the latter exhibited substantial superiority to gender. The alternative codings are reconsidered below using final models developed to include gender.
between the subsets with and without BMI (P > 0.2). Therefore, BMI was not further considered as a predictor.
5.1.2 Final Models
Candidate predictors for final models included:
• ApoA-I • Triglycerides • HDL cholesterol • LDL cholesterol • VLDL cholesterol • Age
• Gender
Table 5.4 Parameter estimates for final model. CTPREB: Percent of A-I in preb