DEVELOPMENTS IN THE STRUCTURE OF IRISH
AGRICULTURE, 1960-75 WITH SPECIAL REFERENCE TO
THE SITUATION IN 1975
F.A. EMBLETON
(Read before the Society, 8 December 19 77)
The State and county results of the June, 1975 Agriculture Enumeration were issued
recently and a detailed analysis of a representative sample of the returns is nearing
com-pletion, the results of which will be published in the near future. In many ways, therefore,
it is timely that the Society has afforded me this opportunity to present a paper on the
subject of structural developments in Irish Agriculture.
INTRODUCTION AND BACKGROUND
The need to identify the physical structure of the various farm activities prompted the
CSO to introduce in 1960 a major analysis which it was hoped could be repeated at
regular five yearly intervals. The 1960 analysis was based on a random ten per cent sample
selected from the 1960 census returns and covering in all some 29,000 holdings. The
results are set out in Part II of "Agricultural Statistics 1960" (Pr. 7540). A similar
analysis of a random sample of some 26,000 holdings, stratified by size of holding, was
carried out after the 1965 full enumeration. Subsequently, after the 1970 agricultural
census, a further analysis of some 27,000 holdings, randomly selected and again stratified
by size of holding, was undertaken. In the meantime, however, priority had to be given to
other work arising from EEC membership and the 1970 sample returns are being processed
in conjunction with the 1975 sample. It is hoped to publish these results also in the near
future. In 1975, unlike previous years when selection was a post-census exercise, the
sample was selected in advance of the census and included some 42,000 holdings. The
pre-selection and the substantially larger size of the 1975 sample was necessary to comply
with the requirements of Directive 75/108/EEC* in accordance with which each Member
State of the EEC carried out a sample survey on the structure of agriculture in 1975
(commonly known as the 1975 EEC "Structures" Survey). While the national 1975 June
Enumeration incorporated the EEC Survey, it was not feasible to collect all the
inform-ation required by the EEC in the routine enumerinform-ation forms. Thus, some items were
in-cluded in a supplementary questionnaire which was completed in respect of the
pre-selected sample of holdings at the same time as the routine enumeration return. These
latter returns for the pre-selected sample are the basis for the 1975 analysis presented in
this paper.
In the selection of the 1965, 1970 and 1975 samples, varying sampling fractions have
been used to optimise accuracy of results for a given size of sample - in 1960 every tenth
holding was selected. In all four years holdings of one acre or less, including landless
stockholders, have been excluded. The analyses which follow have been derived from
these samples and grossed estimates were obtained by raising the sample results by the
ratio of the number of holdings in a particular size group to the number of holdings in
the corresponding size group in the sample. In other words for each size group the
grossing or raising factor is the inverse of the sampling fraction for that size group.
Grossing was carried out at county level so that, within a particular size group in each
county, each holding had the same grossing factor which was used to raise all the data on
that holding.
With the exception of 1960, when actual census figures were used, the totals for the
various items of livestock and crops given in the paper are grossed estimates and not the
census totals. No adjustment has been made to reconcile the overall raised sample results
with the corresponding census totals and the extent of the differences which occur is
illustrated in Appendix Table 10 where the percentage ratios of the raised estimates to
the census totals for 1965, 1970 and 1975 are set out. As all holdings have not been
included in the samples the ratios should be less than 100 but, as may be seen from
Table 10, this is not always the case. It has to be stressed that, as the results have been
derived from samples, they are subject to sampling errors.
This, then, is the background to the 1975 June Enumeration and to the structural
analyses carried out to date. In the sections of the paper which follow, some results for
the major livestock and crop enterprises of the analysis of the 1975 sample of holdings
are discussed together with comparative figures for earlier periods and, in particular, for a
similar analysis of the 1970 June Enumeration - the last full census prior to 1975. Results
at national level only are discussed since time does not allow for a consideration of
regional aspects. For the same reason it is not feasible to discuss the results of the 1975
EEC "Structures" Survey, which in its own right would require lengthy and detailed
consideration.
AGRICULTURAL HOLDINGS, 1960-1975
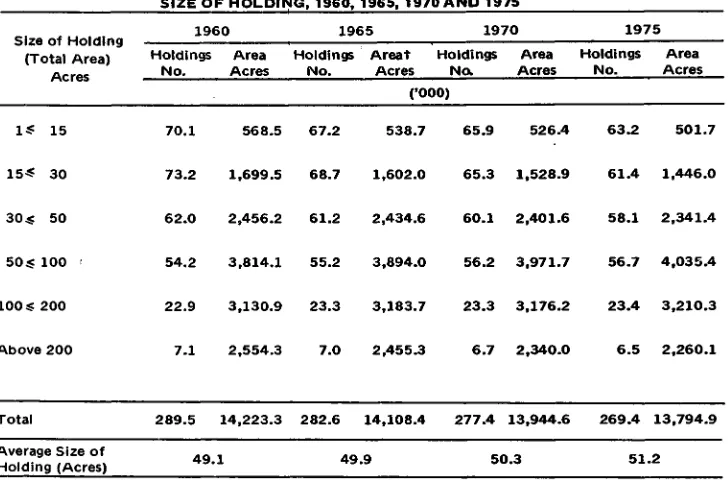
We begin our review with an examination of the numbers of and area on agricultural
holdings. In Appendix Table 1.1 the relevant distributions by total size of holding are
shown for 1960,1965,1970 and 1975 and the corresponding percentage distributions are
set out in Appendix Table 1.2. The most striking feature of these tables is the relatively
small decline in the total number of holdings between 1960 and 1975 - a fall of some
20,000 or 7 per cent, which is an average of some 1,300 per annum. In the same period,
the total area on holdings declined by about 428,000 acres or 3 per cent. The net result
of these changes has been to increase the average size of holding from 49.1 acres in 1960
to 51.2 acres in 1975, an increase of just over 2 acres.
TABLE A: PERCENTAGE CHANGE IN THE NUMBERS OF HOLDINGS IN EACH SIZE GROUP, 1960-1975
Size of Holding (Total Area)
Change in the Numbers of Holdings
1965/60 1970/65 1975/70 1975/60
Acres Percentage
1 <: 1 5 -4.2 - 2 . 0 - 4 . 2 - 10.0
15 ^ 3 0 -6.2 - 5 . 0 - 5 . 9 - 1 6 . 1
30 £ 50 - 1 . 4 - 1.7 - 3 . 3 - 6.2
50 5 100 + 1.9 + 1.8 + 1.0 + 4.7
100 ^ 200 + 2.0 - 0 . 1 + 0.5 + 2.3
Above 200 - 1 . 5 - 4 . 2 - 2 . 4 - 7.9
Total Holdings
Area on Holdings
Average Size of Holding
- 2 . 4
- 0 . 8
+ 1.6
- 1.8
- 1.2
+ 0.8
- 2 . 9
- 1 . 1
+ 1.8 "
- 6.9
- 3.0 + 4.3
Table A clearly highlights the trend towards increasing numbers of holdings in the 50
to 200 acre size groups at the expense of smaller and larger sized holdings. The 50 to 200
acre holdings accounted for nearly 53 per cent of the total area on holdings in 1975
compared with some 49 per cent in 1960, an absolute increase of 301,000 acres. Overall,
however, changes between 1960 and 1975 have made little difference to average holding
size.
In considering the numbers of holdings it has to be recognised that each holding is not
necessarily a farm unit and, more importantly, not necessarily a viable economic unit.
Indeed the relatively minor changes in the numbers of holdings contrast sharply with the
decline in agricultural employment between 1960 and 1975 when the numbers of males
engaged in farmwork, which are the principal indicators of the level of agricultural
employment, declined from 383,000 to 242,000, a fall of 141,000 or 37 per cent.
During the same period male members of the family, aged 18 years and over, declined
from 275,000 to almost 204,000, a decrease of 71,000 or 26 per cent. Moreover, it is
estimated that in 1975 some 185,000 holdings had males engaged in farmwork compared
with 224,000 in 1960, a decline of some 39,000 or 17 per cent. Indeed, as will be seen
later, changes in the numbers of holdings are a very poor indicator of the changing
structure of Irish agriculture.
LIVESTOCK AND CROPS, 1960-1975
In the three sections which follow, the developments in the physical structure of
individual items of livestock and crops are considered - first, the overall developments;
secondly, the developments by size of holding and thirdly, the developments by size of
enterprise. At the end of each section the situation in 1975 is summarised. The individual
enterprises (i.e. categories of livestock and items of crops) considered are cattle, cows,
sheep, ewes, pigs and breeding pigs in the case of livestock and wheat, oats, malting barley,
other barley, potatoes and sugar beet in the case of crops.
(1) Overall Developments
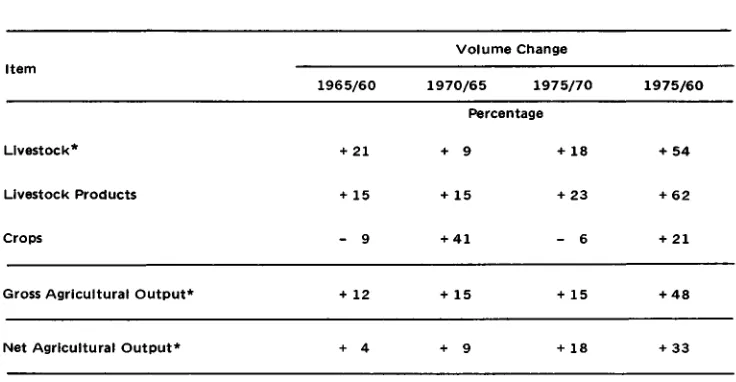
In Table B the percentage changes in the volume of output of livestock, livestock
products and crops are set out. Between 1960 and 1975 the volume of gross agricultural
output increased by almost 50 per cent due to increases of 54, 62 and 21 per cent in the
volume of livestock, livestock products and crops, respectively. During the same period
the volume of net output rose by one-third. In each five year period the volume of both
livestock and livestock products increased while the volume of crops increased between
TABLE B: PERCENTAGE CHANGE IN THE VOLUME OF OUTPUT, 1960-1975
Volume Change Item
1965/60 1970/65 1975/70 1975/60
Percentage
Livestock* + 2 1 +9 +18 + 5 4 Livestock Products +15 + 1 5 +23 + 6 2 Crops - 9 + 4 1 - 6 + 2 1
Gross Agricultural Output* +12 + 1 5 + 1 5 + 4 8 Net Agricultural Output* +4 +9 + 1 8 +33 * Including changes in livestock numbers
The changes in the volume of output reflect the changes which have occurred between
1960 and 1975 in the frequency and size of the principal livestock and crop enterprises.
The trends in the latter are set out in index form, to base 1960 = 100, in Appendix
Table 2. Ploughed land has been included to give an overall perspective of tillage. On the
left hand side of Table 2 the trends in the numbers of holdings with the selected categories
of livestock, the corresponding livestock numbers and average herd sizes are shown while
on the right hand side of the table the corresponding information is given for the selected
crop items.
Livestock
For sheep and ewes the numbers of holdings in 1975 were less than two-thirds of the
1960 levels, the largest declines having occurred between 1965 and 1970 when there
were falls of over 20 per cent. The numbers of sheep and ewes rose between 1960 and
1965 (when in fact record numbers were returned) and since then have declined
con-tinuously. Average sizes of flock, however, have shown increases despite the falling
numbers of sheep and ewes and in 1975 were 40 and 50 per cent respectively above the
1960 level.
For pigs, the decline in the numbers of holdings has been considerable, with falls of
19, 25 and 61 per cent respectively in each of the five year periods. In particular, the fall
between 1970 and 1975 has been dramatic. The changes in the numbers of pigs have not
followed the trend in holdings. In fact, between 1960 and 1965, pig numbers rose by
29 per cent and the 1965 levels were maintained in 1970. Since then, however, a fall of
one-third has occurred and in 1975 pig numbers were some 13 per cent below the 1960
levels. As a result of these changes, the average herd size has risen by 60, 35 and 67 per
cent respectively in each of the five year periods, the latter period showing a substantial
rise. Over the entire 15 years average size of herd has more than trebled.
In the case of breeding pigs, the numbers of holdings have also declined but not as
dramatically. Between 1960 and 1965 little change occurred but this was followed by a
decline of 13 per cent between 1965 and 1970 and of 55 per cent between 1970 and
1975 to leave the number of holdings in 1975 some 60 per cent below the 1960 level.
The numbers of breeding pigs showed increases of 23 and 7 per cent respectively in the
five year intervals between 1960 and 1970 but declined by over 30 per cent between
1970 and 1975. Thus, in 1975, breeding pigs were some 10 per cent below the 1960 level.
Average size of herd, however, has shown increases, the largest increase occurring again
between 1970 and 1975 when there was a rise of over 50 per cent. Average herd size in
1975 was more than double the 1960 average.
Crops
For malting barley the numbers of holdings have declined by 28 per cent, while
acreage has increased by 34 per cent and average crop size by 86 per cent, in which a rise
of over 40 per cent occurred between 1970 and 1975. In the case of other barley, the
numbers of holdings increased by 6 per cent between 1960 and 1965 but in the following
five years dropped back to just below the 1960 level. Since 1970 a decline of 12 per cent
has occurred. Acreage increases of 57, 23 and 11 per cent respectively have occurred in
each five year period and this has resulted in the 1975 acreage being more than double
that of 1960. These changes are reflected in the average size of crop which rose by 47,
32 and 27 per cent respectively in each of the five years, leaving the 1975 average almost
Th times the 1960 level.
Potatoes, like oats, have shown fairly consistent declines in all of the five year periods
and overall declines of over 40 per cent in holdings, 57 percent in acreage and 20 per cent
in average crop size have occurred. Holdings with sugar beet have declined by over 50 per
cent in number since 1960, the fall between 1970 and 1975 being over 30 per cent. The
acreage showed small declines between 1960 and 1970 but since then has increased by
over 25 per cent. The average size of crop increased by 22,15 and 87 per cent respectively
in each of the five year periods and in 1975 was over 160 per cent higher than in 1960.
Overall, in 1975, holdings with some ploughed land number just less than two-thirds
of the 1960 total. The total area ploughed has fallen by over 30 per cent, an absolute
decline of over a half-million acres, while average area per holding has increased by
4 per cent.
The Situation in 1975
TABLE C: TRENDS IN LIVESTOCK AND CROPS, 1960-1975
Category of Livestock Holdings with Livestock Numbers Average Herd Size
Total Cattle Cows Total Sheep Ewes Total Pigs Breeding Pigs
89 84 63 64 24 40
1960 = 100 154 169 89 95 87 90
174 202 140 149 360 232
Crop Item Holdings with Area Grown Average Crop Size
Wheat Oats
Malting Barley Other Barley Potatoes Sugar Beet
18 35 72 87 57 48
1960 =100
30 29 134 215 43 125
168 83 186 247 80 263
Ploughed Land 66 6 9 1 0 4
(2) Developments by Size of Holding
In Appendix Tables 3 (livestock) and 4 (crops) the frequency and average size of
enterprises in each size of holding are shown for 1960, 1965, 1970 and 1975. To
facilitate use of these tables the total numbers of holdings in each size group are shown
at the top of table 3.1.
Livestock
For cows also the percentage of holdings in each size group is high, being over 80 for
holdings above 30 acres and over 70 for holdings in the 15 to 30 acre size group. For
holdings l§ss than 15 acres the percentage has declined from 57.1 in 1960 to 44.5 in
1975. In all size groups the percentages decreased between 1960 and 1970 but it is
note-worthy that between 1970 and 1975 the percentage of holdings with cows in each size
feroup has shown little change except in the largest size group where the decline between
1960 and 1970 has continued. The arrest of the decline between 1970 and 1975 must
reflect the effects of EEC membership on dairying.
For both total cattle and cows the average size of herd has increased consistently in
each of the fiye year periods since 1960. On holdings above 200 acres, the average heird of
battle was 85 in 1960 and 127 in 1975 which now represents a sizeable investment in
livestock. In the case of cows, on holdings above 50 acres, the average size of herd has
doubled since 1960, while in the size groups below 50 acres, the increases in herd sizes
have ranged from over 40 to above 80 per cent.
In the case of sheep and ewes the picture is one of decreasing percentages of holdings
in all size groups since 1960 - an exception being the 50 to 100 acre size group where
small increases occurred between 1960 and 1965. A surprising feature is the high
per-centage of the above 200 acre holdings with sheep, over one-half of which continue to
have sheep despite the 94 per cent with cattle. In the 100 to 200 acre size group, two out
of five holdings have sheep compared with the 95 per cent with cattle. For these two size
groups, the stage now may be nearing when further expansion in cattle numbers could
have significant effects on sheep, particularly in lowland areas. The average size of the
sheep flock has increased generally but it is significant that, since 1970, on holdings above
50 acres, flock size has tended to level off. Indeed holdings above 200 acres show
declining flock size since the record numbers of 1965. In contrast to this, the average size
of flock on holdings less than 50 acres has continued to rise substantially. Similar trends
exist for ewes.
In the case of breeding pigs, the percentage of holdings in size groups below 50 acres
showed marginal changes between 1960 and 1970 but dropped sharply between 1970 and
1975. For holdings above 50 acres, decreasing percentages of holdings reported breeding
pigs in each five year period, the decline between 1970 and 1975 in all cases being
con-siderable. In all size groups, average herd size rose relatively little between 1960 and 1965
and again between 1965 and 1970 but substantial increases occurred between 1970 and
1975, particularly in the above 200 acre size group where herd size more than doubled.
In 1975 the average size of herd in this size group was four times the 1960 level.
Crops
In Appendix Tables 4.1 and 4.2 the frequency and average size of crop enterprises are
set out. Table 4.1 shows the percentages of holdings in each size group growing the
selected crops, while Table 4.2 contains the average area grown per holding. Overall, with
the exception of other barley, the trend is one of declining percentages of holdings in
each size group growing crops. The percentages of holdings with other barley generally
increased between 1960 and 1965 but since then have decreased except in the above 200
acre size group. In Table 4.2 differing trends in average size of crop are evident. For
wheat, the average size of crop has fluctuated with the total acreage grown but the
underlying trend in each size of holding is towards a larger crop size. For oats, only
holdings above 100 acres have shown a definite tendency to increase and this only since
1965. For both of the barley crops and sugar beet, average crop sizes have increased
substantially in all size groups and on holdings above 200 acres, the average sizes of the
other barley and sugar beet crops have almost trebled. In the case of potatoes, the average
size of crop on holdings up to 200 acres has tended to decrease while on holdings above
200 acres little change has taken place. Despite general increases between 1965 and 1970,
the average area ploughed in all size groups up to 200 acres has declined, while on holdings
above 200 acres an upward trend is evident since 1965.
The Situation in 1975
1960 situation. Other barley, sheep and ewes were equally popular and these were
followed by pigs. Finally the least common enterprises were breeding pigs in the case of
livestock and malting barely, sugar beet and wheat in the case of crops. These latter
crops have become somewhat "exclusive" in that holdings growing them were relatively
few in number in 1975.
TABLE D: PERCENTAGE OF HOLDINGS WITH AND AVERAGE SIZE OF SELECTED ENTERPRISES IN CERTAIN SIZE GROUPS, JUNE 1975
Size of Holding (acres)
Item Cattle Cows Sheep Ewes Pigs Breeding Pigs Wheat Oats Malting Barley Other Barley Potatoes Sugar Beet Ploughed Land
1 « 50 5 0 ^ 1 0 0
Percentage of 78.2 65.4 14.4 13.6 7.4 5.0 1.5 21.2 2.6 11.2 43.2 2 . 3
51.9 94.1 85.5 28.3 27.1 15.8 11.9
4 . 5 24.5 7.9 29.9 55.1 7.4 69.3 Above 100 Holdings 95.1 84.9 41.6 40.1 14.9 10.4 12.5 26.0 13.2 43.6 52.4 12.3 75.4 Total with 83.5 71.9 20.3 19.4 10.0 7.0
3 . 3 22.5 4 . 9 18.7 46.7 4 . 5
58.2
1.S 50 50-S 100 Above
100 Total Average Size of Enterprise*
17.2 6.2 47.1 22.7 19.5 4 . 1
5.1 1.1 6.1 3 . 7 0.6 3 . 7
2 . 8
N o .
43.4 15.3 62.3 29.6 27.6 4 . 8
87.2 26.5 124.4 59.7 61.9 8.6 Acres 9.1 2 , 4 10.3 7.5 0.8 6.2 8.0 19.2 5.9 20.8 18.7 1.3 11.9 24.7 32.3 11.1 69.2 33.3 29.2 5.1 12.1 2.0 11.9 8.9 0.8 7.1 7.2
* Per holding with
(3) Developments by Size of Enterprise
In this section the distribution, by size of enterprise (i.e. size of herd or area of crop
grown), of holdings with the selected livestock and crop enterprises and the corresponding
livestock numbers or crop acreages are considered. Since considerable detail is involved,
the analysis is restricted to 1970 and 1975. The relevant Appendix Tables are 5, 6
and 7 for livestock and 8 and 9 for crops.
Livestock
Cattle (Appendix Table 5.1)
Holdings with Total Cattle Average Herd Size
Change 1975/70: -2,800 +1,283,000 +6.0
An estimated 225,000 holdings had cattle in 1975 compared with 228,000 holdings
in 1970
?a decline of just over 1 per cent in the five years. Average herd size has risen
from 26.3 to 32.3, an increase of 23 per cent and this rise is due almost entirely to
in-creased cattle numbers. The numbers of holdings with herd sizes less than 20 show
decreases while those with 20 or more show increases. Furthermore, in 1975 some 19
per cent of holdings had 50 or more cattle and accounted for over one-half of all
cattle. This compares with 13 per cent of holdings accounting for 43 per cent of cattle
in 1970.
Cows (Appendix Table 5.2)
Holdings with Total Cows , Average Herd Size
Change 1975/70: - 5,600 + 434,000 + 2.5
While a comparison of dairy cows between 1970 and 1975 is not possible - the now
familiar breakdown of cows was not in use in 1970 - the dairy enterprise is too important
to overlook and the structure of the dairy herd in 1975 is set out in Appendix Table 5.3
where the distribution of holdings with dairy cows is cross-classified by size of herd and
size of holding.
In 1975 an estimated 130,000 holdings, just less than one-half of all holdings, had
dairy cows and average size of herd was 11.4. Thus of the 194,000 holdings with cows,
over two-thirds had dairy cows. The importance of the larger herd sizes is evident from
Table 5.3 where the number of holdings with 20 or more dairy cows exceeds 24,000, i.e.
some 19 per cent of total holdings with dairy cows, and accounts for an estimated
839,000 or almost 57 per cent of dairy cows. The popularity of the dairy cow on all sizes
of holdings is evident also and, with the exception of the 1 to 15 acre size group where
28 per cent of holdings had dairy cows, the percentage in each size group lies between
47 and 61.
Dairy cows are defined to include all cows whose milk is for sale or human
con-sumption. Thus, what might be termed the "house" cow is included and indeed the herds
of 1 to 2 must consist largely of such cows. Additionally, it is doubtful if herds of 3 to 4
cows constitute "commercial" dairy enterprises. Thus, the 76,000 holdings with 5 or more
cows are those which might be classed as the "commercial" producers. Of these the
25,000 holdings with 5 to 9 dairy cows must be potentially the most responsive to
policies aimed at encouraging dairy farmers to give up milk production. It can be seen
from Table 5.3 that of these 25,000 holdings some 10,500 do not exceed 30 acres in size
and a further 8,000 do not exceed 50 acres. Given the present dependence on grass by
Irish dairy farming, these producers are capable of a limited expansion only, and, if the
incentives to leave dairying are sufficiently attractive, they may not continue their
involvement in milk production. These holdings, however, accounted for only 11 per cent
of total dairy cows in 1975 and even if one-half discontinue milk production, the drop,
while it may be significant, would be readily off-set by any further expansion of the
51,000 holdings with 10 or more dairy cows. These latter holdings must constitute the
hard-core of the fully-committed producers and it is worth noting that in 1975 these
holdings accounted for almost 1.2 million dairy cows which was over 80 per cent of the
national herd.
Sheep (Appendix Table 6.1)
Holdings with Total Sheep Average Flock Size
Change 1975/70: -10,500 -379,000 + 5.4
the exception of those in the 200 plus size class. In 1975 holdings with 200 or more sheep
were estimated to comprise over 6 per cent of all holdings with sheep and to account for
some 30 per cent of total sheep numbers. The comparable 1970 estimates were 5 per cent
of holdings for 27 per cent of total sheep. In both 1975 and 1970 close on 80 per cent of
sheep were found on holdings with herds of 50 or more.
Ewes (Appendix Table 6.2)
Holdings with Total Ewes Average Flock Size
Change 1975/70: -9,500 -156,000 +2.6
The number of holdings with ewes has declined from 62,000 in 1970 to 52,000 in
1975; the number of ewes has fallen by 156,000 and average size of flock has increased
from 30.7 to 33.3. The numbers of holdings in all size classes show decreases with the
exception of those in the 100 and over size classes, where marginal increases occurred.
It is clear from Tables 6.1 and 6.2 that significant structural changes at State level
have not occurred within sheep farming between 1970 and 1975. However, it was seen
earlier in Appendix Table 3.2 that average flock sizes on holdings not exceeding 50 acres
increased between 1970 and 1975 while on holdings above 50 acres little change occurred.
The former may be indicative of structural improvements in highland flocks and the
latter of counter-movements in lowland flocks. The county data, when available, will
throw further light on these two aspects of sheep farming.
Pigs (Appendix Table 7.1)
Holdings with Total Pigs Average Herd Size
Change 1975/70: - 41,000 - 405,000 + 11.7
Additional information on fattening pigs (pigs of at least 50 Kgs. live weight) and
young pigs (pigs not exceeding 50 Kgs. liveweight) further emphasises the growing
intensification within pig farming. In 1975 some 400 holdings out of a total of 7,700
with fattening pigs had 100 or more fattening pigs but accounted for 209,000 or almost
78 per cent of the herd. The average herd size on these holdings was 535 fattening pigs.
A further 800 holdings had 20 to 100 fattening pigs and accounted for 12 per cent of
the herd. Thus the remaining 6,500 holdings (nearly 85 per cent of the total) had less
than 20 each and accounted for only 10 per cent of the herd.
For young pigs, some 650 holdings out of a total of 15,900 with young pigs had 100
or more in 1975 and accounted for just less than 200,000 or 48 per cent of the total herd.
Average herd size on these holdings was over 300 young pigs. Some 3,700 holdings had
herds of 20 to 100 and accounted for a further 30 per cent of the total herd, while the
remaining 11,500 holdings (over 70 per cent of the total) had less than 20 young pigs each
and accounted for just over 20 per cent of the total herd.
Breeding Pigs (Appendix Table 7.2)
Holdings with Breeding Pigs Average Herd Size
Change 1975/70: -23,000 -44,000 +1.8
Crops
Wheat (Appendix Table 8.1)
Holdings with Total Acreage Average Crop Size
Change 1975/70: - 11,500 - 130,000 + 0.5
An estimated 9,000 holdings were growing wheat in 1975 compared with 20,500
holdings in 1970. Despite the decline of 130,000 acres in total area, a 54 per cent
decrease, the average area grown per holding increased by 0.5 acres to 12.1 acres. While
major declines occurred in all size of crop classes, significant structural movements have
not taken place and in 1975 some 25 per cent of holdings grew 15 or more acres of
wheat and accounted for 65 per cent of the crop compared with the corresponding 1970
estimates of 23 per cent of holdings accounting for 64 per cent of the acreage.
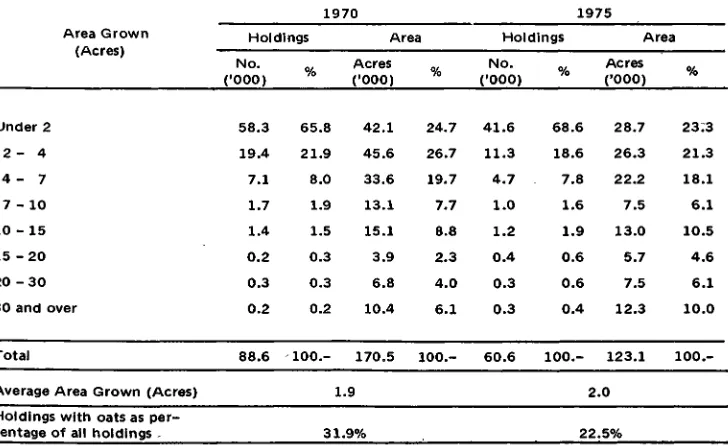
Oats (Appendix Table 8.2)
Holdings with Total Acreage Average Crop Size
Change 1975/70: -28,000 -47,000 +0.1
Malting Barley (Appendix Table 8.3)
Holdings with Total Acreage Average Crop Size
Change 1975/70: -2,300 +28,000 ' + 3.5
The relatively small changes in the numbers of holdings growing malting barley
probably reflect the practice of growing this crop under contract. The numbers of
holdings with malting barley declined from 15,500 in 1970 to 13,000 in 1975, while the
acreage increased by 28,000 to 157,000 acres. The average size of crop rose from 8.4 to
11.9 acres, an increase of 42 per cent. Significantly, decreases have occurred in the
holdings growing less than 10 acres while those growing 10 or more acres have increased
in number; the most pronounced increases have occurred in the 20 and over size classes.
In 1975 some 17 per cent of holdings were in these size classes and accounted for more
than one-half of the entire acreage, compared with 9 per cent of holdings growing less
than 40 per cent of the acreage in 1970.
Other Barley (Appendix Table 8.4)
Holdings with Total Acreage Average Crop Size
Change 1975/70: - 6,700 + 46,000 + 1.9
An estimated 50,000 holdings grew other barley in 1975 compared with 57,000
holdings in 1970 and this decrease coupled with an increase in acreage has resulted in an
average crop size of 8.9 acres in 1975 compared with 7.0 acres in 1970. Holdings with
less than 10 acres have declined; those with 10 to 20 acres showed no change and those
with 20 or more acres have increased in number. In 1975 holdings growing 20 or more
acres accounted for 12 per cent of holdings growing other barley and for over one-half
of the total area grown compared with 8 per cent of holdings for 43 per cent of the
acreage in 1970.
Potatoes (Appendix Table 9.1)
Holdings with Total Acreage Average Crop Size
Change 1975/70: -29,900 -41,500 - 0 . 1
156,000 in 1970 to 126,000 in 1975 while the acreage grown has declined by 41,500
acres and the average size of crop has changed little - 0.9 to 0.8 acres. No size class shows
an increase. Given the upheavals in the potato market over the last few years, the
distributions in Table 9.1 are of some interest. Indeed the relative importance of the
small-scale growers (an estimated 48,500 holdings grew VA acre in 1975 and a further
49,500 grew
x/i or % of an acre) underlines the difficulties of organising an orderly
market. It is highly probable that many of these growers do not grow potatoes
primarily for sale but, when prices are high, are tempted to increase production with a
view to selling in anticipation of prices remaining attractive.
Sugar Beet (Appendix Table 9.2)
Holdings with Total Acreage Average Crop Size
Change 1975/70: - 5,300 + 19,000 +3.3
Major structural changes have occurred since 1970 and are due to a combination of an
increase in acreage and a decline in the number of growers. The number of holdings
growing sugar beet has declined from 17,000 in 1970 to 12,000 in 1975, a drop of over
30 per cent. The net result of this and of the increased acreage (just short of 30 per cent)
has been a rise in the average area grown from 3.8 to 7.1 acres, an increase of 87 per cent.
The pattern of declining numbers growing smaller acreages and increasing numbers
growing larger acreages is evident. Holdings growing 7 or more acres of sugar beet rose
from an estimated 2,000 in 1970 to 4,000 in 1975 when they accounted for 59,000 acres
or some 70 per cent of the total area. It should be noted here that in Appendix Table 10
for both 1970 and 1975 the ratios of the raised estimates to the actual census figures are
103.7 and 103.4, respectively. From data made available by the Irish Sugar Company,
the numbers of contract growers in 1975 were 11,200 compared with the raised estimates
of 12,000 holdings.
THE SITUATION IN 1975
Ismail scale enterprises. These are followed by sheep, other barley and pigs after which
come malting barley, sugar beet and wheat. Despite the fact that wheat is grown on
fewer holdings than any of the other crops considered, the average crop size is the
largest. Given the increases which have occurred in the wheat acreage since 1975, the
average crop size may have increased further as it is unlikely that substantial numbers of
holdings have returned to growing wheat.
TABLE E: ESTIMATED NUMBER OF HOLDINGS WITH SELECTED CATEGORIES OF LIVESTOCK AND CROPS, JUNE, 1975
Holdings with Livestock Numbers* Average Herd Size Category of Livestock
(000) N o .
Total Cattle Total Cows Dairy Cows Total Sheep Ewes Total Pigs Breeding Pigs
225 194 130 55 52 27 19
7,258 2,153 1,478 3,790 1,737 785 97
32.3 11.1 11.4 69.2 33.3 29.2 5 = 1
Crop Item
Holdings with Acreage* grown Average Crop Size
(000) Acres
Wheat Oats
Malting Barley Other Barley Potatoes Sugar Beet
9 61 13 50 126 12
109 123 157 447 95 85
12.1 2.0 11.9 8.9 0.8 7.1
Ploughed Land 157 1,134 7 . 2
* Raised estimates, not census totals - see Table 10.
FUTURE TRENDS
In the future, further intensification in cattle and dairying is certain. It is possible
that rising costs, combined with handicaps of expansion (size of holding and capital),may
force many of the smaller sized holdings to review their continued participation in
dairying. In any event, the continuing emphasis of EEC agricultural policies on beef and
milk will further direct Irish agriculture towards these two enterprises.
In the case of sheep, further declines in the numbers of holdings cannot be ruled out
and expansion in cattle might accelerate these declines, particularly in lowland areas.
Undoubtedly, sheep will continue to be a major enterprise for hill and disadvantaged area
holdings, on which poor pastures and rough grazing land will not adequately support
other grazing livestock enterprises. The possibilities for major structural improvements
on these holdings, however, will be a principal factor in determining growth. It should be
noted that while the number of sheep in June 1977 increased by some 51,000 or 1.5 per
cent on 1976, the 1977 flock remains well below the 1975 level.
Pig farming is likely to become more intensive and the contribution of small units to
total production will become increasingly insignificant. One may only speculate if the
permanent loss of the small breeding units will not initially hinder expansion in the pig
sector since a sizeable investment in large breeding units may be required to offset the
departure of the many small units.
It seems likely that wheat and barley, both of which have increased in acreage since
1975, will be enterprises for larger holdings and further declines in the numbers growing
these crops may be expected. This may be the case also for sugar beet. For oats and
potatoes, the numbers of holdings are likely to continue declining which, in the case of
potatoes, should prove beneficial in any moves to rationalise the system of marketing.
The acreages of both these crops are likely to decline also in the long term - between
1975 and 1977 the area of oats has declined by a further 36,000 acres but potato
acreage, following on the scarcities of the 1975/76 crop year, has increased by 32,000
acres.
FUTURE ANALYSES
standard gross margins, standard net value added etc.) to the individual items of crops and
livestock. Currently, the nine* Member States of the EEC are drawing up such a farm
"typology" based on Standard Gross Margins, which will be applied in the first place to
the physical data of the 1975 "Structures" Survey. The CSO, together with the
Department of Agriculture and the Agricultural Institute, has been participating in the
work of the relevant Working Group in Brussels. This Group is now completing the first
phase of its work and a classification scheme is almost finalised. It is hoped to apply this
scheme to the 1975 sample in early 1978 to obtain a pattern of farming classification for
Irish agriculture. These results should be extremely useful and should provide a statistical
basis for analysing the overall pattern and structure of Irish farming. The classification
will be repeated in respect of 1977 when another EEC - wide "Structures" Survey was
carried out and 1980 when the next full enumeration is likely to be undertaken. Apart
from the pattern of farming classification, the 1975 analysis will be repeated also for
1977 and 1980.
APPENDIX
LIST OF TABLES
Note:
Table
Table Table
Table
Table
Table
Table 1.1) 1-2) 2 3.1
3.2
4.1
4.2
5.1
(1) In all cases the livestock numbers and crop acreages shown in the Tables are raised estimates and not census totals. (See Table 10).
(2) As figures have been rounded, there may be discrepancies between the sum (or difference) of the constituent items and the total shown. In some instances rounding has given rise also to dis-crepancies in the size of herd and size of crop classes in Tables 5 to 9 inclusive.
Percentages have been calculated on actual figures.
Number and Area of Agricultural Holdings Classified by Size of Holding, I960, 1965, 1970 and 1975
Trends in Livestock and Crops, 1960-1975
Percentage of Holdings in Each Size Group with Selected Categories of Livestock, 1960, 1965, 1970 and 1975
Average Number of Selected Categories of Livestock per Holding in Each Size Group, 1960, 1965, 1970 and 1975
Percentage of Holdings in Each Size Group with Selected Crops, 1960, 1965, 1970 and 1975
Average Area of, Selected Crops Grown per Holding in Each Size Group, I960, 1965, 1970 and 1975
Estimated Distribution of Holdings with and Numbers of Cattle Classified by Size of Herd, 1970 and 1975
Table 5.2 Estimated Distribution of Holdings with and Numbers of Cows Classified by Size of Herd, 1970 and 1975
Table 6.1 Estimated Distribution of Holdings with and Numbers of Sheep Classified by Size of Flock, 1970 and 1975
Table 6.2 Estimated Distribution of Holdings with and Numbers of Ewes Classified by Size of Flock, 1970 and 1975
Table 7.1 Estimated Distribution of Holdings with and Numbers of Pigs Classified by Size of Herd, 1970 and 1975
Table 7.2 Estimated Distribution of Holdings with and Numbers of Breeding Pigs Classified by Size of Herd, 1970 and 1975
Table 8.1 Estimated Distribution of Holdings with and Area Under Wheat Classified by Area Grown, 1970 and 1975
Table 8.2 Estimated Distribution of Holdings with and Area Under Oats Classified by Area Grown, 1970 and 1975
Table 8.3 Estimated Distribution of Holdings with and Area Under Malting Barley Classified by Area Grown, 1970 and 1975
Table 8.4 Estimated Distribution of Holdings with and Area Under Other Barley Classified by Area Grown, 1970 and 1975
Table 9.1 Estimated Distribution of Holdings with and Area Under Potatoes Classified by Area Grown, 1970 and 1975
Table 9.2 Estimated Distribution of Holdings with and Area Under Sugar Beet Classified by Area Grown, 1970 and 1975
HOLDINGS
TABLE 1.1: NUMBER AND AREA* OF AGRICULTURAL HOLDINGS CLASSIFIED BY SIZE OF HOLDING, 1960, 1965, 1970 AND 1975
1960 1965 1970 1975
Size of Holding
-(Total Area) Holdings Area Holdings Areat Holdings Area Holdings Area No. Acres No. Acres No. Acres No. Acres Acres
(•000)
1£ 15
15« 30
30^ 50
50$ 100
100$ 200
Above 200
70.1 568.5 67.2 538.7 65.9 526.4 63.2 501.7
73.2 1,699.5 68.7 1,602.0 65.3 1,528.9 61.4 1,446.0
62.0 2,456.2 61.2 2,434.6 60.1 2,401.6 58.1 2,341.4
54.2 3,814.1 55.2 3,894.0 56.2 3,971.7 56.7 4,035.4
22.9 3,130.9 23.3 3,183.7 23.3 3,176.2 23.4 3,210.3
7.1 2,554.3 7.0 2,455.3 6.7 2,340.0 6.5 2,260.1
Total 289.5 14,223.3 282.6 14,108.4 277.4 13,944.6 269.4 13,794.9
Average Size of
Holding (Acres) 49.1 49.9 50.3 51.2
TABLE 1.2: PERCENTAGE DISTRIBUTIONS
Size of Holding (Total Area)
Acres
1 ^ 15 15.$ 30 30$ 50 50 < 100 100< 200 Above 200 Total
1960 Holdings
24.2 25.3 21.4 18.7
7.9
2.4
100.-Area
4.0
11.9 17.3 26.8 22.0 18.0
100.-1965 Holdings
23.8 24.3 21.6 19.5
8.3
2.5
100.-1970 Areat Holdings
Percentage
3.8
11.4 17.3 27.6 22.6 17.4
100.-23.8 23.5 21.7 20.2
8.4
2.4
100.-Area
3.8
11.0 17.2 28.5 22.8 16.8
100.-1975 Holdings
23.4 22.8 21.6 21.1
8.7
2.4
100.-Area
3.6
10.5 17.0 29.3 23.3 16.4 100.-* Areas other than those for 1960 are raised estimates, not census totals -see Table 10.
[image:25.468.54.419.373.586.2]TABLE 2: TRENDS IN LIVESTOCK AND CROPS, 1960-1975 Cattle Cows Sheep Ewes Pigs Breeding Pigs 1965 1970 1975 1965 1970 1975 1965 1970 1975 1965 1970 1975 1965 1970 1975 1965 1970 1975t Livestock Holdings with 94-9 0 8 9 9 2 86 84 9 5 7 5 6 3 9 6 76 6 4 81 6 1 2 4
1 0 1 88 4 0
Livestock Numbers
I960 = 100
1 1 1 127 154 119 135 169 116 9 7 8 9 119 1 0 4 9 5
129 1 3 2 8 7
1 2 3 1 3 1 9 0
Average Size of Herd*
117 1 4 1 174
129 156 2 0 2
122 129 140 125 137 149 160 2 1 6 3 6 0
1 2 3 150 2 3 2
Wheat Oats Malting Barley Other Barley Potatoes Sugar Beet Ploughed Land 1965 1970 1975 1965 1970 1975 1965 1970 1975 1965 1970 1975 1965 1970 1975 1965 1970 1975 1965 1970 1975 Crops Holdings with 5 4 4 0 18 7 8 5 1 3 5 9 8 8 4 72 106 9 9 8 7 86 7 0 57 79 7 0 4 8 8 9 76 6 6 Area Grown
1960 = 100
4 9 6 5 30 6 7 4 0 29 113 110 134 157 1 9 3 2 1 5
78 6 1 4 3
9 5 9 7 1 2 5
83 80 6 9 Average Size of Crop* 9 0 161 168 8 8 79 8 3 116 131 186 147 194 2 4 7
9 0 9 0 80
122 141 2 6 3
9 4 106 104
* Average per holding with
TABLE 3.
Item and
1 : PERCENTAGE OF HOLDINGS IN EACH SIZE GROUP WITH SELECTED CATEGORIES OF LIVESTOCK, 1960, 1965, 1970 AND 1975
Year
Size of Holding (acres)
5 15^30 30^50 50 < 100 1004= rt^ Above
2 0 0 200
Holdings above 1 acre Holdings 1960 1965 1970 1975 70.1 67.2 65.9 63.2 73.2 68.7 65.3 61.4 Number 62.0 61.2 60.1 58.1
of holdings ('000)
54.2 55.2 56.2 56.7 22.9 23.3 23.3 23.4 7.1 7.0 6.7 6.5 289.5 282.6 277.4 269.4
Percentage of holdings in size group
Holdings with: Cattle Cows Sheep Ewes Pigs Breeding Pigs 1960 1965 1970 1975 1960 1965 1970 1975 1960 1965 1970 1975 1960 1965 1970 1975 1960 1965 1970 1975 1960 1965 1970 1975* ' 66.9 62.1 56.8 58.4 57.1 51.2 44.9 44.5 10.7 9.9 6.6 6.4
9 . 3 8.8 6.0 5.8 15.8 13.0 8.9 3.5 3.5 4 . 3 4 . 4 2.3 90.9 87.5 83.6 86.0 81.2 76.2 71.3 72.4 24.6 22.6 18.7 14.6 22.4 20.9 17.3 13.7 33.9 25.9 20.1 6.4 10.7 11.2 10.8 4 . 2
94.7 92.8 90.8 91.7 87.9 85.4 81.4 81.0 33.8 32.2 26.1 22.9 31.5 29.8 24.6 21.9 45.6 38.5 29.4 12.5 18.5 20.4 18.4 8.7 96.8 94.5 93.9 94.1 92.1 87.6 86.1 85.5 41.2 41.7 33.2 28.3 39.3 39.8 31.7 27.1 54.8 46.1 37.8 15.8 29.3 29.0 25.5 11.9 98.1 95.8 94.6 95.3 93.6 89.7 86.2 86.1 57.2 55.4 44.4 38.4 55.3 53.4 42.7 37.0 58.3 48.6 35.1 15.5 35.0 31.8 24.1 11.2 95.9 94.5 94.3 94.0 92.3 87.7 84.4 80.7 70.6 69.6 60.8 53.2 69.4 67.9 58.9 51.4 51.8 41.6 26.2 12.5 29.3 24.9 16.3 7.8 87.7 84.9 82.1 83.5 80.1 75.9 71.8 71.9 30.0 29.2 23.5 20.3 28.1 27.5 22.3 19.4 38.3 31.8 24.5 10.0 16.5 17.1 15.1 7 . 0
TABLE 3.2: AVERAGE NUMBER OF SELECTED CATEGORIES OF LIVESTOCK PER HOLDING, IN EACH SIZE GROUP, 1960, 1965, 1970 AND 1975
Size of Holding (acres) Item and Year
15^30 30^:50 50^100 100^200Above
200
* Per holding with.
t Including gilts not yet served.
Holdings above 1 acre Cattle Cows Sheep Ewes Pigs Breeding Pigs 1960 1965 1970 1975 1960 1965 1970 1975 1960 1965 1970 1975 1960 1965 1970 1975 1960 1965 1970 1975 1960 1965 1970 1975t 5.2 5.8 6.8 7.6 2.1 2 . 3 2.6 3 . 0
22.9 27.3 33.2 41.4 11.7 14.4 18.2 21.1
4 . 8 6.1 9.0 23.5
1.9 2 . 0 2 . 3 4 . 3
9.8 11.3 13.3 15.7
3.3 4 . 0 4.6 5.4 27.7 30.9 36.6 42.2 12.9 14.7 17.5 20.6
4 . 8 8.2 11.9 16.2
1.7 2 . 2 2.7 3.5 Average 15.1 17.6 20.9 25.2
4 . 8 6.1 7.1 8.7 36.2 40.6 42.6 52.2 16.3 18.7 20.3 24.6 6.6 10.5 15.4 20.0
2 . 0 2 . 3 2 . 8 4 . 3
herd size* 25.5 29.4 35.0 43.4 7.6 9 . 8 12.0 15.3 49.8 58.3 61.1 62.3 21.9 26.3 29.0 29.6
9 . 5 14.9 19.8 27.6
2.2 2 . 9 3 . 7 4 . 8
(number) 45.2 52.6 61.5 76.4 11.5 14.9 18.2 24.8 74.2 91.2 95.0 98.3 33.0 42.2 44.9 47.2 13.0 19.6 23.9 45.8 2.7 3 . 4 4 . 2 6 . 7
85.2 92.8 103.4 126.6 16.4 20.1 23.9 33.2 154.4 202.0 194.1 192.2 68.1 91.6 92.0 92.1 23.4 39.5 51.4 133.8
4 . 7 5.2 6.9 18.4 18.6 21.8 26.3 32.3 5.5 7.1 8.6 11.1 49.3 60.0 63.8 69.2 22.4 28.0 30.7 33.3 8.1 13.0 17.5 29.2
TABLE 4.1: PERCENTAGE OF HOLDINGS 9N EACH SIZE GROUP WITH SELECTED CROPS, I960, 1965, 1970 AND 1975*
Size of Holding (acres) Item and Year
l4?15 15^:30 30^50 50^100 100^200 Above
200 Holdings 'above 1 acre Holdings with: Wheat Oats Malting Barley Other Barley Potatoes Sugar Beet Ploughed Land 1960 1965 1970 1975 1960 1965 1970 1975 1960 1965 1970 1975 1960 1965 1970 1975 1960 1965 1970 1975 1960 1965 1970 1975 1960 1965 1970 1975
4 . 5 2.6 1.8 0.7 36.6 27.8 16.6 14.1 1.8 1.6 1.4 0.9
3 . 9 5.6 4 . 2 4 . 4
58.6 48.8 37.1 31.9 1.7 1.1 0.9 1.1 66.7 56.5 44.1 40.4 Percentage 10.0 5.1 3.1 1.5 63.1 50.6 35.7 24.7 3.6 3.4 2.6 2 . 3
14.0 14.6 13.3 11.1 76.8 67.3 55.2 46.2
4 . 5 3.6 3.2 1.8 81.8 73.1 61.7 54.2 18.6 10.0 6.4 2 . 4
69.4 56.1 37.4 25.5 6.6 6.4 5.6 4.7 23.5 25.0 22.7 18.7 83.1 75.5 64.3 52.5 9.4 7.5 6.7 4 . 0
87.8 81.6 71.6 62.0 of holdings 28.5 15.0 10.9 4 . 5
71.8 56.2 37.1 24.5 10.3 10.3 8.9 7.9 32.7 33.6 33.6 29.9 86.6 76.9 66.9 55.1 15.4 12.3 10.7 7.4 91.1 84.2 77.6 69.3
in size group
43.2 24.5 22.7 10.8 72.1 56.4 35.7 24.8 16.1 15.9 14.4 12.7 41.0 44.7 43.7 43.0 86.8 77.5 64.6 53.6 21.0 17.3 15.7 12.0 93.5 87.7 81.2 75.0 47.8 29.2 30.6 18.7 72.2 59.0 40.3 30.0 16.4 16.8 16.2 14.8 44.4 44.2 45.2 45.9 84.9 73.0 60.9 47.8 21.3 14.3 14.2 13.5 91.8 86.0 81.3 76.7 17.5 9.7 7.4 3 . 3
60.6 48.1 31.9 22.5
6 . 3 6.4 5.6 4 . 9
20.0 21.6 20.6 18.7 76.6 67.5 56.2 46.7 8.6 7.0 6.3 4 . 5
82.3 74.7 65.0 58.2
TABLE 4.2: AVERAGE AREA OF SELECTED CROPS GROWN PER HOLDING IN EACH SIZE GROUP I960, 1965, 1970 AND 197S
Size of holding (acres) Item and Year
2 < 15 15<30 30£ 50 50 3 100 100$ 200 Above200
Holdings above 1 acre Wheat Oats Malting Barley Other Barley Potatoes Sugar Beet Ploughed Land I960 1965 1970 1975 1960 1965 1970 1975 1960 1965 1970 1975 1960 1965 1970 1975 1960 1965 1970 1975 1960 1965 1970 1975 1960 1965 1970 1975 2.0 1.9 3.4 3.9 0.9 1.0 0.8 0.8 2.1 2.1 2.3 4 . 5
1.3 1.7 2.2 2.8 0.6 0.7 0.5 0.5 1.4 1.8 2.6 4 . 0
1.5 1.6 1.5 1.5 2.8 2.4 4 . 1 5.1 1.4 1.2 1.1 1.0 3.0 3.3 3.3 5.8 1.3 1.7 2.5 3.3 0.9 0.8 0.7 0.6 1.8 2 . 0 2.1 3.2 3.1 2.6 2.6 2.5
Average area grown*
3.6 3 . 2 5.9 5.5 2.0 1.7 1.5 1.5
4 . 0 4 . 5 5.4 6.7
1.8 2.7 3 . 4 4 . 2
1.0 0.9 0.8 0.7
2 . 0 2.5 2.8 3.9
5.0 4 . 4 4 . 5 3.9
6 . 2 5.6 9 . 2 9.1
3 . 1 2 . 7 2 . 3 2 . 4
6 . 0 6.5 7.2 10.3
3 . 4 5.0 6 . 4 7 . 5
1.2 1.0 1.0 0 . 8
2 . 6 3 . 1 3 . 6 6 . 2
9 . 3 8 . 3 8.6 8 . 0
(acres) 11.8 10.0 15.3 14.2 5.2 4 . 2 4 . 3 4 . 8
9 . 5 11.5 12.6 16.7
7 . 1 10.4 12.3 14.3 1.5 1.3 1.4 1.1
3 . 8 4 . 6 5.3 9 . 7
19.4 17.7 19.6 18.7 24.5 20.7 32.4 29.7 8.2 6.8 7.1 9 . 1
19.4 22.2 23.2 33.6 12.5 19.9 26.9 33.5 1.9 1.7 2 . 0 2 . 0
6 . 3 7 . 3 8.6 18.7 37.8 34.3 43.3 45.9 7.2 6.5 11.6 12.1
2 . 4 2 . 1 1.9 2 . 0
6 . 4 7.4 8.4 11.9
3 . 6 5.3 7 . 0 8.9
1.0 0 . 9 0.9 0.8
2.7 3 . 3 3 . 8 7.1
6.9 6.5 7.3 7.2
Per holding with
CATTLE
TABLE 5.1: ESTIMATED DISTRIBUTION OF HOLDINGS WITH AND NUMBERS OF CATTLE* CLASSIFIED BY SIZE OFHERD
Size of Herd
1 - 4 5 - 9 10 - 14 15 - 19 20 - 2 9 3 0 - 4 9 50 - 9 9 100 and over
Total
Average size of herd Holdings with cattle as per-centage of ail holdings
1970 Holdings No. (f000)
22.0 40.0 36.3 27.1 37.1 34.5 24.2 6.5 227.6 % 9.7 17.6 16.0 11.9 16.3 15.1 10.6 2.8 100.-26, 82, Animals No. (•000) 65.9 278.5 431.1 458.6 887.0 1,301.1 1,618.6 934.9 5,975.5 .3 .1% % 1.1 4.7 7.2 7.7 14,8 21.8 27.1 15.6 100.-1975 Holdings No. ('000) 17.5 32.2 30.3 25.7 37.2 39.1 31.7 11.1 224.8 % 7.8 14.3 13.5 11.4 16.6 17.4 14.1 4 . 9
100.-3 2 8 3 Animals No. ('000) 52.4 224.0 359.4 432.6 891.6 1,483.7 2,163.2 1,651.5 7,258.5 .3 .5% % 0.7 3 . 1 5.0 6 . 0 12.3 20.4 29.8 22.8
100.-* Raised estimates, not census totals - see Table 10.
COWS
TABLE 5.2: ESTIMATED DISTRIBUTION OF HOLDINGS WITH AND NUMBERS OF COWS* CLASSIFIED BY SIZE OF HERD
Size of Herd
1 - 2 3 - 4 5 - 9 10 - 1 4 15 - 19 20 - 2 9 30 - 4 9 50 and over
Total
Average size of herd Holdings with cows as per-centage of all holdings
1970 Holdings No. ('000) 48.0 41.4 51.0 24.9 12.3 13.2 6.6 1.9 199.2 % 24.1 20.8 25.6 12.5 6.2 6.6 3 . 3 1.0 100.-Animals No. ('000) 77.7 141.9 335.9 289.4 204.4 304.8 235.2 129.8 1,719.0 8.6 71 .8% % 4.5 8.3 19.5 16.8 11.9 17.7 13.7 7.6 100.-1975 Holdings No. ('000) 35.7 35.6 49.9 26.2 13.7 16.6 11.4 4 . 5
193.6 % 18.5 18.4 25.8 13.6 7.1 8.6 5.9 2 . 3
100.-11 71 Animals No. (•000) 56.9 123.8 329.6 304.2 227.0 384.9 413.4 312.9 2,152.7 .1 .9% %
2 . 6 5.7 15.3 14.1 10.5 17.9 19.2 14.5
TABLE S.3: ESTIMATED DISTRIBUTION OF MOLDINGS WITH DA8RY COWS* CLASSIF5ED BY S8ZE OF HERO AS^D SIZE OF HOLDING, JUNE 197S
Size of Holding (acres)
Size of Herd 1 « 1 5 15« 30 3 0 ^ 5 0 5 0 ^ 1 0 0 100^200Above 200
Total TotaJ
Dairy Cows
Number ("000)
1 - 2
3 - 4
5 - 9
10-14
15 -19
20 -29
30-49
50 and over
11.0 10,1 6.9 5.5 2.2 0.8
4,4 6.1 4.2 2.2 0.6 0.2
2.0 8.4 8.3 5.1 1.0 0.2
0.3 2.9 6.3 5.8 1.4 0.2
0.1 0.9 2.7 4.5 1.2 0.2
0.0 0.5 2.5 6.4 2.6 0.3
0.1 0.6 4.4 3.0 0.5
0.0 0.8 1.9 0.7
36.6
17.6
25.0
17.0
9.6
12.3
8.6
3.5
52c3
60.7
168.7
198.8
158.5
285.7
310.6
243.0
Total Holdings 17.8 28.9 31.6 34.6 14.0 3.1 130.1 1,478.2
Holdings with dairy cows as
percentage of all holdings 28.2% 47.1% 54.4% 61.1% 60.0% 47.5% 48.3%
Total number of dairy
<jows ('000) 48.7 151.4 280.8 548.9 352.7 95.9 1,478.2
Average size of herd (No.) 2.7 5.2 8.9 15.8 25.1 31.0 11.4
SHEEP
TABLE 6.1: ESTIMATED DISTRIBUTION OF HOLDINGS WITH AND NUMBERS OF SHEEP* CLASSIFIED BY SIZE OF FLOCK
Size of Flotf<
1 - 9 1 0 - 19 2 0 - 29 3 0 - 49 5 0 - 99 100 - 199 200 and over Total
Average size of flock Holdings with sheep as per-centage of all holdings
Holdings tlMo. (•000) 5.4 10.1 9.9 13.4 15.5 7.6 3.4 65.3 % 8 15 15 20 23 11 5 100 1970 .3 .5 .1 .5 .8 .7 .1 . -6c Animals No. (•000) 31.0 142.5 235.6 514.1 1,074.2 1,031.3 1,140.4 4,169.0 1.8 23.5% % 0.7 3.4 5.7 12.3 25.8 24.7 27.4 100.-1975 Holdings No. (•000) 5.1 8.2 7.3 10.3 13.2 7.3 3.5 54.8 % 9.2 15.0 13.4 18.7 24.0 13.3 6.4 100.-6S Animals No. (•000) 29.6 117.5 174.6 396.5 912.6 985.6 1,174.0 3,790.4 >.2 20.3% % 0.8 3.1 4.6 10.5 24.1 26.0 31.0
100.-Raised estimates, not census totals - see Table 10.
[image:33.475.50.423.72.321.2]EWES
TABLE 6.2: ESTIMATED DISTRIBUTION OF HOLDINGS WITH AND NUMBERS OF EWES* CLASSIFIED BY SIZE OF FLOCK
Size of Flock
1 - 9 1 0 - 19 2 0 - 29 30 - 49 50 - 99 100 - 199 200 and over
Total
Average size of flock Holdings with ewes as per-centage of all holdings
1970 Holdings No. (•000) 13.1 16.1 11.1 11.2 7.1 2 . 4 0.7 61.7 % 21.3 26.1 18.1 18.2 11.5 3 . 8 1.1
100.-30.
2 2 .
Animals No. ('000) 70.5 214.1 250.3 403.9 456.8 286.5 210.9 1,893.1 .7 .3% %
3 . 7 11.3 13.2 21.3 24.1 15.1 11.1 100.-1975 Holdings No. (•000) 11.1 12.2 9 . 5 9 . 5 6 . 7 2 . 5 0 . 8
52.2 % 21.2 23.4 18.2 18.1 12.7 4 . 8 1.6 100.-3c Animals No. (•000) 60.0 160.7 213.7 339.7 430.0 311.7 221.1 1,736.8 1.3 19.4% %
3 . 5 9 . 2 12.3 19.6 24.8 17.9 12.7
PIGS
TABLE 7.1: ESTIMATED DISTRIBUTION OF HOLDINGS WITH AND NUMBERS OF PIGS* CLASSIFIED BY SIZE OF HERD
Size of Herd
1 - 2 3 - 9 10 - 19 2 0 - 4 9 50 - 9 9 100 and over
Total
Average size of herd Holdings with pigs as per-centage of all holdings
1970 Holdings No, ('000) 16.1 19.4 16.4 12.4 2.6 1.1 67.9 % 23.7 28.5 24.1 18.3 3 . 8 1.7 100.-17. 2 4 Animals No. (•000) 25.3 97.6 222.3 364.0 169.5 310.4 1,189.1 .5 .5% % 2.1 8.2 18.7 30.6 14.3 26.1 100.-1975 Holdings No. ('000)
8 . 9 6 . 2 5.8 4 . 0 1.0 1.1 26.9 % 33.1 22.9 21.4 14.7 3 . 9 3.9 100.-29, 10. Animals No. C000) 12.6 31.7 76.6 117.1 68.6 478.1 784.5 .2 .0% % 1.6 4 . 0 9.8 14.9 8.7 60.9
100.-* Raised estimates, not census totals - see Table 10. 1975 figures for breeding pigs include gilts not yet served.
BREEDING PIGS
TABLE 7.2: ESTIMATED DISTRIBUTION OF HOLDINGS WITH AND NUMBERS OF BREEDING PIGS* CLASSIFIED BY SIZE OF HERD
Size of Herd
1970 1975
Holdings Animals Holdings Animals No.
('000)
No. No. No. (•000) ('000) ('000)
11.6 27.6 11.6 8.2 6.6 34.8 6.6 6.8
12.2 29.1 24.5 17.4 4.7 24.8 9.4 9.7
3 - 4
5 - 9
10.6 25.3 35.7 25.3 3.9 20.4 13.0 13.5
5.8 13.7 35.8 25.5 2.4 12.6 15.1 15.7
10 and over 1.8 4.3 33.2 23.6 1.4 7.5 52.3 54.2
Total
Average size of herd
Holdings with breeding pigs as percentage of all holdings
42.0 100.- 140.7 3 3 15.1%
100.- 19.0 100.-5 7 96.5 .1 .0%
WHEAT
TABLE 8.1: ESTIMATED DISTRIBUTION OF HOLDINGS WITH AND AREA UNDER WHEAT* CLASSIFIED BY AREA GROWN
Area Grown (Acres) Under 2 2 4 7 10 15 2 0 3 0 - 4 - 7 - 10 - 15 - 2 0 - 3 0 and over
1970 Holdings N o . ('000)
2.7 3 . 4 4 . 0 2.5 3 . 1 1.4 1.5 1.9 % 13.3 16.6 19.7 12.1 15.2 6.7 7.5 9.0 -Area Acres (•000)
2 . 4 8.5 20.1 19.9 35.6 22.9 34.8 94.5 % 1.0 3.6 8.4 8.3 14.9 9.6 14.6 39.6 1975 Holdings N o . (f000)
1.5 0.9 1.8 1.1 1.5 0.6 0.9 0.8 0 / vo 16.2 10.0 19.6 12.2 17.0 6.5 9.6 8.8 Area Acres (f000)
1.1 2.4 8.7 8.7 17.5 9.6 19.5 41.4 0 / VO 1.0 2.2 8.0 8.0 16.1 8.8 17.9 38.0 Total Average Area Holdings with centage of all
Grown (Acres)
wheat as per-holdings
20.5
100.-1 100.-1 .
7 238.5
6
. 4 %
100.- 9 . 0
100.-1 2
3 108.9
. 1
. 3 %
100.-Raised estimates, not census totals - see Table 10.
OATS
TABLE 8.2: ESTIMATED DISTRIBUTION OF HOLDINGS WITH AND AREA UNDER OATS* CLASSIFIED BY AREA GROWN
Area Grown (Acres) Under 2 2 4 7 10 15 2 0 3 0 - 4 - 7 - 1 0 - 15 - 2 0 - 3 0 and over 1970 Holdings No. ('000) 58.3 19.4 7.1 1.7 1.4 0.2 0.3 0.2 % 65.8 21.9 8.0 1.9 1.5 0.3 0.3 0.2 Area Acres ('000) 42.1 45.6 33.6 13.1 15.1 3.9 6.8 10.4 % 24.7 26.7 19.7 7.7 8.8 2 . 3 4 . 0 6.1 Holdings No. ('000) 41.6 11.3 4 . 7 1.0 1.2 0 . 4 0 . 3 0 . 3
% 6 8 18 7 1 1 0 0 0 1975 .6 .6 .8 .6 .9 .6 .6 .4 Area Acres ('000) 28.7 26.3 22.2 7.5 13.0 5.7 7.5 12.3 % 23:3 21.3 18.1 6.1 10.5 4 . 6 6.1 10.0
Total
Average Area
Holdings with centage of all
Grown (Acres)
oats as per-holdings . 88.6 100.-1 3 1 170.5 .9
. 9 %
100.- 60.6
100.-2
2 2 123.1
. 0
. 5 %
[image:35.470.51.415.368.591.2]
MALTING BARLEY
TABLE 8.3: ESTIMATED DISTRIBUTION OF HOLDINGS WITH AND AREA UNDER MALTING BARLEY* CLASSIFIED BY AREA GROWN
Area Grown (Acres)
Under 2 2 - 4 4 - 7 7 - 1 0 10 - 1 5 15 - 2 0 2 0 - 3 0 30 and over
Total
Average Area Grown (Acres) Holdings with malting barley as percentage of all holdings
1970 Holdings No. COOO) 1.9 3.9 3.4 1.9 2.1 0.8 0.8 0.7
1 5 . 5 % 12.5 25.3 21.7 12.2 13.7 5.3 5.0 4 . 3
100.-Area Acres C000)
1.9 9 . 7 16.6 15.0 24.1 13.5 17.5 31.1 129.4 8.4 5 .6% % 1.5 7.5 12.8 11.6 18.7 10.4 13.5 24.0 100.-1975 Holdings No. (f000) 1.3 1.8 2 . 8 1.8 2 . 2 1.0 1.2 1.1 13.2 % 9.5 14.0 21.4 13.5 16.7 7.6 8.9 8.3 100.-11 Area Acres COOO) 1.2 4.6 1 4 . 1 14.3 25.3 16.3 26.9 54.8 157.3 .9 4.9% % 0.7 2 . 9 8.9 9.1 16.1 10.3 17.1 34.8
100.-* Raised estimates, not census totals - se