Development of a 3D, Multi-Nuclear Continuous Wave
NMR Imaging System
Andrew J. Fagan 1, 2
, Gareth R. Davies 1
, James M.S. Hutchison 1
, Fredrik P. Glasser3, David J. Lurie 1*
1
Department of Bio-Medical Physics and Bio-Engineering, University of Aberdeen, Foresterhill, Aberdeen AB25 2ZD, U.K.
2
Current address: Trinity College Institute of Neuroscience, Lloyd Building, Trinity College, Dublin 2, Ireland.
3
Department of Chemistry, University of Aberdeen, Meston Walk, Aberdeen AB24 3UE, U.K.
Abstract
The development of a 3-D, multi-nuclear continuous wave NMR imaging
(CW-NMRI) system is described and its imaging capability is demonstrated on a range of materials exhibiting extremely short T2 relaxation values. A variety of
radio-frequency resonators were constructed and incorporated into a new gradient and field offset coil assembly, while the overall system design was modified to minimise microphonic noise which was present in an earlier prototype system. The chemically combined 27Al in a high temperature refractory cement was imaged, and the
CW-NMRI system was found to be sensitive to small differences in 27Al content in these samples. The penetration of 23Na in salt water into samples of ordinary Portland cement (OPC) was investigated, with enhanced uptake observed for samples with larger pore size distributions. The solid 13C component in a carbonated cement sample was also imaged, as were the 7Li nuclei in a sample of powdered Li2CO3. A
spatial resolution of 1 mm was measured in an image of a rigid polymeric material exhibiting a principal T2* value of 16.3 μs. Finally, a high-resolution 3-D image of
this rigid polymer is presented.
Keywords:
1. Introduction
The interest in imaging solid materials and liquids in confined geometries has led to the ongoing development of a range of solid state NMR imaging techniques over the past 20 years. Such systems present extreme difficulties for conventional NMR imaging due to the short T2 relaxation values and broad NMR linewidths which these
materials exhibit. These problems can be overcome, to some degree, by decreasing the effective linewidth of the sample using techniques which reduce the
line-broadening mechanisms within the sample, so that lower strength field gradients may be used (line-narrowing techniques). This can be achieved by using a range of special multi-pulse radio-frequency (RF) irradiation methods [1-6] or by physically spinning the sample at the magic angle [7-10]. Another approach to solid state NMR imaging which has been exploited in several techniques involves the application of sufficiently large magnetic field gradients to produce spatial localisation on the resonant spins, thereby retaining the broad linewidths which contain useful information from the T2
relaxation phenomena which broaden the lines. Examples include the stray field imaging (STRAFI) technique, which typically uses the extremely strong static field gradients present in the fringe field of solenoidal superconducting magnets [11,12], and the oscillating gradient technique, which produces large, sinusoidally-varying gradients by incorporating the gradient coils into a resonant circuit [13]. A further approach to solid state NMR imaging, which uses moderately strong gradients, is single point imaging (SPI, or its variant SPRITE, single-point ramped imaging with T1 enhancement). This technique uses pure phase encoding and effectively eliminates
the application of an RF pulse, which is repeated as the gradient is incremented [14-16].
Despite the wealth of techniques that have been developed to image materials in the solid state, no single technique has emerged as an all round gold standard, with each techniques demonstrating certain advantages and disadvantages compared to the others. For example, line narrowing techniques often require the application of high RF power and place severe restrictions on sample size. Together with the complexity of the experimental set-up and the demanding equipment requirements, their
application to the imaging of solid materials has been limited [17]. The unidirectional nature of the strong gradient in the STRAFI experiment makes it difficult and time consuming to acquire images in more than one dimension since both sample
translation and rotation is required, and consequently STRAFI has found application predominately in the imaging of materials where the process of interest has been reduced to 1-D, for example profiling perpendicular to thin films, where high resolution imaging of the in-plane processes is not so critical [18,19]. Nevertheless, some 3-D studies have been reported (for example, see [12,20]). The SPI/SPRITE technique, while perhaps the most successful technique to date from the point of view of its range of applications reported in the literature, is limited by equipment deadtime which imposes a lower limit on the shortest T2 value which can be studied [21,22].
A newly-developed approach to imaging materials in the solid state is continuous wave NMR imaging (CW-NMRI), a frequency encoding technique which uses continuous RF irradiation and detection in the presence of continuously-applied,
amenable to study using this technique due to the lack of experimental deadtime, although imaging using a prototype system have thus far been limited to one and two dimensions [25].. Its extension to 3-D imaging is described in this paper.
2. Experimental
2.1 CW NMRI Basics
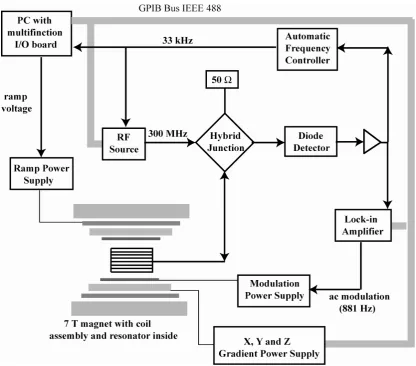
In continuous wave NMRI, a sample is exposed to continuous RF irradiation at one specific frequency, and its absorption signal is measured by sweeping the applied magnetic field through resonance. Operation of our spectrometer is described with reference to the block diagram in Figure 1. The RF, supplied by a synthesiser (Hewlett Packard, USA, Model HP8647A), is applied to one terminal of a hybrid junction (Lorch Electronics, USA, Model JH280E). The two neighbouring ports of
the hybrid junction are connected to a 50 Ω load and the resonator, which is matched
to 50 Ω, while the signal appearing on the opposite port is sent to a home-built diode
detector. When off-resonance, power from the synthesiser is divided equally between
the 50 Ω load and the resonator. Sweeping of the magnetic field via a solenoidal field offset coil then brings the spins in the sample into resonance, which results in a change in impedance of the resonator. The resulting impedance mismatch across the hybrid junction causes power to be transmitted through the junction into the detector. To improve signal sensitivity, a small-amplitude audiofrequency modulation
Imaging with the CW-NMRI technique is achieved by frequency encoding in one direction only, using a moderately strong, static magnetic field gradient. The excited plane of resonance is swept through the sample in the direction of the applied
magnetic field gradient by the effect of the ramped offset magnetic field. A one-dimensional line profile is thus acquired, with each point in the profile representing the first derivative of the spin density of the sample projected onto the axis of the gradient. The gradient direction is rotated around the sample by the combination of three orthogonal gradients, and thus two- and three-dimensional images can be reconstructed from a series of projections using filtered back-projection.
2.2 Apparatus
The system is based around a 7 T, 183 mm diameter horizontal bore superconducting magnet (Oxford Instruments, UK). The gradient, offset and modulation magnetic fields were produced using a custom-built water-cooled coil assembly (Laplacian Ltd., UK), which employed proprietary stream function designs to produce large gradient fields (maximum 400 mT/m for the Z and 300 mT/m for the X/Y gradients), together with two nested solenoids producing the ramped offset magnetic field (maximum ± 16 mT) and the superimposed audiofrequency modulation field
UK, Models AP90100 and AP5060) were used to power the gradient and offset coils (with maximum current capabilities of 90 A and 50 A respectively), while a home-built audiofrequency power supply was used to drive the modulation coil up to a maximum frequency of 15 kHz.
A range of birdcage resonators were built for studying the nuclei 1H, 13C, 7Li, 23Na and 27Al in a variety of materials (the same resonator was used to image 23Na and
27
Al, tuned appropriately). In each case, it was necessary to avoid using materials in the construction of the resonators which contained the nuclei of interest, since these would be detected by the system and hence contribute a significant background signal. Thus, PTFE was used to provide structural support for the 1H, 7Li and 23Na /
27
Al resonators, while the carbon-free glass ceramic Macor (Corning Inc., USA) was used in the construction of the 13C resonator. Specialised non-magnetic miniature chip ceramic capacitors (Tekelec, France) and variable capacitors (Voltronics, USA) were typically used throughout. The basic design of these birdcage resonators has been described previously [24], although some modifications were made here to suit specific applications. For instance, several 1H resonators were built to separately optimise SNR, RF uniformity and sample size. The legs and end rings of the
SNR-optimised resonator were made from 300 μm thick, 7 mm wide Cu foil, enabling an increase in surface area (hence decreased resistance) and a reduction in the number of solder joints compared to the original design, and with the end ring capacitors formed using appropriately-shaped strips of CuFlon (Polyflon, USA), which is comprised of
copper electroplated onto both sides of a 127 μm-thick layer of PTFE serving as the
accommodate a cylindrical sample with diameter 52 mm and length 100 mm. Similarly, the 13C, 7Li, and 23Na / 27Al resonators were built to suit specific experimental requirements. All of the resonators were placed into identical RF shields made from copper sheets of thickness 0.5 mm and length 200 mm, with a resultant outer diameter of 81 mm. It was necessary to split the shields along their length to prevent the audiofrequency magnetic field modulation causing eddy currents, which would introduce acoustic interference and prevent the modulation from penetrating the shield to the sample. For the 1H resonators, the split was closed to RF penetration by forming a capacitor comprising the shield itself and a strip of
copper (width 18 mm, thickness 40 μm) bridging the gap, with a strip of PTFE
(thickness 55 μm) in between acting as a dielectric. However, for the 13C, 7Li and
23
Na / 27Al resonators, some RF leakage from the shields was detected due to the larger skin depths at these lower frequencies, and consequently Cu strips of width
80 mm and thickness 80 μm were used to bridge the gaps in these shields, at which
point no RF leakage was detected. Measured Q-factors ranged from 132 for the 23Na /
27
Al resonator to 636 for the SNR-optimised 1H resonator (with corresponding
efficiencies of 1.7 and 14.4 μT/W½ respectively).
diode detector was used to convert the amplitude-modulated RF signal to a signal at the modulation frequency, which was subsequently amplified by a low-noise
preamplifier. The resulting signal was split between the lock-in amplifier and a home-built automatic frequency controller (AFC). The feedback loop to the RF synthesiser via this AFC was used to compensate for drifts in the tuning of the various resonators during an experiment by adjusting the RF source frequency (up to a
maximum of ± 50 kHz for 1H). Corresponding magnetic field offsets were performed by using the AFC feedback signal to modify the magnetic field ramp in software before it was sent to the ramp power supply. The sequence control, data acquisition and data processing was carried out using software written in LabVIEW (National Instruments, USA), while image reconstruction was carried out using Interactive Data language (Research Systems, USA).
The resonator/shields were mechanically decoupled from the main gradient, offset and modulation coil assembly by sliding them into a 1.6 m-long fibreglass tube (1 mm wall thickness, inner diameter 83 mm) which was suspended within the coil assembly using two support frames built at either end of the magnet. The frames did not touch either the coil assembly or the magnet at any point and furthermore were mounted on vibration-dampening feet, in an effort to minimise microphonic effects due to
2.3 Sample preparation and imaging parameters
2.3.1 27Al imaging experiments
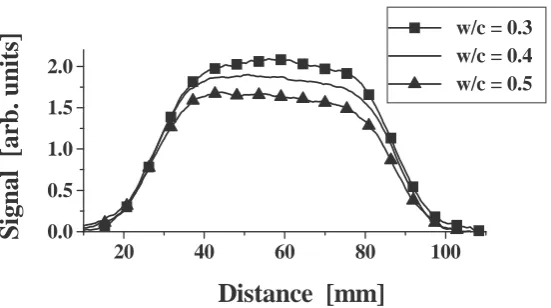
A series of samples with water/cement (w/c) ratios of 0.3, 0.4 and 0.5 were made using a high temperature refractory cement trademarked Secar 80® (Lafarge Aluminates, France). Chemically, this calcium aluminate cement consists of approximately 80 % Al2O3 and 17 % CaO, together with trace amounts of other
oxides. For 1-D profiling experiments, cylindrical samples measuring 44 mm in diameter and 60 mm in length were cast in cylindrical moulds and moist-cured in a wet environment (relative humidity > 95 %) for 28 days to ensure a homogeneous cure. The samples were imaged using a magnetic field gradient of 50 mT/m, an RF
power of 13 dBm, and a magnetic field modulation of 600 μT pk-pk. 100 signal
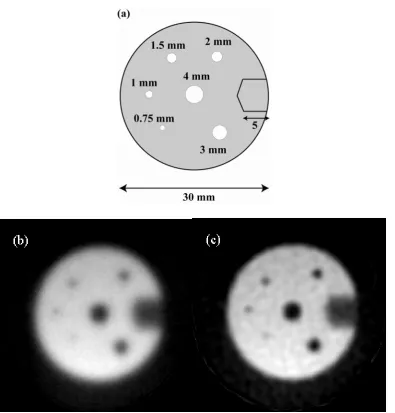
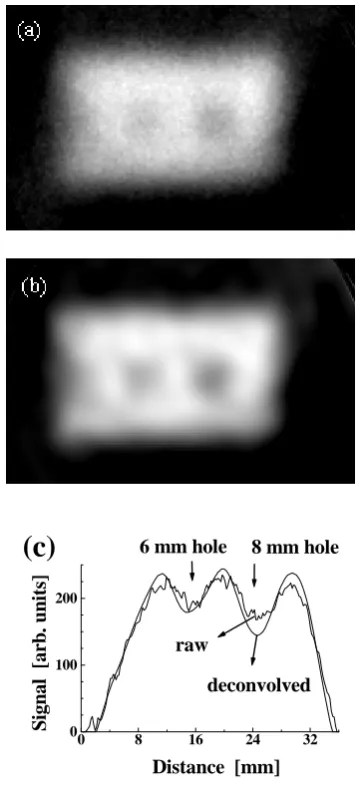
averages were typically used, resulting in an acquisition time of 10 minutes. For the 2-D imaging experiment, a sample with a rectangular cross-section was prepared (dimensions 60 x 34 x 32 mm) with a w/c ratio of 0.3 and again moist-cured in a wet environment (relative humidity > 95 %) for 28 days. Two holes with diameters 6 mm and 8 mm were drilled through the sample. The following parameters were used to acquire the 2-D image: a magnetic field gradient of 80 mT/m, an RF power of 13 dBm, a magnetic field modulation of 792 μT pk-pk, 150 signal averages, with 64
projections around the sample, resulting in a total acquisition time of 16 hours.
2.3.2 23Na imaging experiments
wet environment (relative humidity > 95 %) for 28 days. The samples were
subsequently dried in an oven at 105 °C for 3 days to remove all evaporable pore
water, and immediately placed into a saturated solution of NaCl for 4 days, after which they were found to be completely saturated. In a second experiment, a cured, dried sample with a w/c ratio of 0.4 was sealed using Parafilm on all but one end face, which was exposed to a saturated solution of NaCl. The subsequent uptake of Na into the sample was followed by 1-D profiling experiments following different periods of soaking. In both experiments, the following parameters were used to acquire the profiles: a magnetic field gradient of 50 mT/m, an RF power of 13 dBm, a magnetic
field modulation of 792 μT pk-pk, 300 signal averages, resulting in a total acquisition
time of 30 minutes.
2.3.3 13C imaging experiment
A cylindrical sample (diameter 44 mm, length 60 mm) with a w/c ratio of 0.35 was made from carbon-free Portland cement and cured in a desiccator with a relative humidity of 71 %, and exposed to a constant flow of CO2 gas for a period of 53 days,
which was expected to fully carbonate the sample (this was verified by carrying out a phenolphalein test on the sample after the imaging experiments were finished). The particular cement used for this experiment was chosen because it did not contain any calcite (i.e. calcium carbonate), which was verified by x-ray diffractometry. This was necessary in order to ensure that any measured 13C signal derived from the
carbonation reaction (i.e. from carbonated cement) rather than from admixtures within the cement. The sample was imaged using a magnetic field gradient of 30 mT/m, an
the extremely low signal, it was necessary to use 8000 signal averages, resulting in a total acquisition time of 10 hours.
For all images, the signal to noise ratio (SNR) was calculated as a ratio of the mean image intensity of a region of interest within the sample area compared to the standard deviation of the intensity.
3. Results and Discussion
3.1 Imaging of solid phase of Al in cement
In addition to their binding properties, modern cements are characterised by a range of physical properties such as their rate of hardening, their resistance to ageing and temperature extremes, their rheological properties, and their interaction with the fillers and additives typically used in the mix. These properties are determined by the mineralogical composition of the cement, which is generally tailored to suit the particular application. For example, for high temperature refractory applications, cements with high content of Al2O3 have been developed which combine rapid set
and strength gain with high temperature resistance in subsequent service.
Understanding the extent of the hydration reaction of the various components within these materials can aid in determining their long-term durability, and hence the ability to image the various phases in the cement is highly desirable.
should be pointed out that we are imaging 27Al nuclei predominately in the
chemically-combined Al2O3 phase in the cement, although other solid Al-containing
phases are also likely to contribute to the signal to a lesser extent. A T2* relaxation
time of 49 ± 1 μs was measured for the sample from the zero-gradient CW-NMR
3.2 Imaging of salt penetration into cement
The ingress of salty water into concrete structures is of major economic concern due to the depassivation of embedded steel reinforcement resulting in corrosion, as well as direct damage caused by the effects of salt crystallisation. Bridges and coastal
structures are particularly exposed to chloride attack via the ingress of salt water, while de-icing on concrete surfaces, e.g. bridge decks, via salt gritting can also cause significant problems. However, the movement of sodium and chloride ions within cements is still not fully understood, while the reactions which may take place between them and the cement material itself or additives within the cement are equally vague. Indeed, interactions involving chlorides may retard their rate of penetration and thus provide some measure of long-term protection [32]. Several studies have been reported in the literature investigating the penetration of NaCl into porous building materials such as calcium silicate bricks [33] and OPC [30]. The current study aimed to explore the potential of the CW-NMRI technique in the study of salt water penetration into such materials.
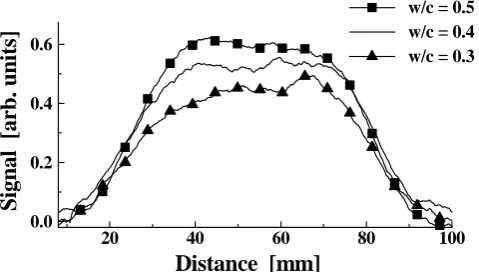
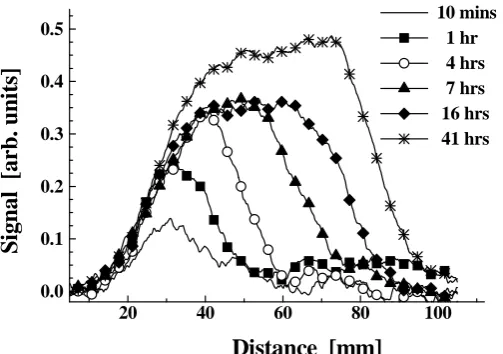
One-dimensional profiling experiments carried out on the dried OPC cement samples, subsequently immersed in a saturated NaCl solution, are presented in Figure 4. An increase in the 23Na signal was measured as the w/c ratio was increased, due to the increased percolation with increased uptake of brine. In a second experiment, the rate of penetration of a brine solution into a dried and sealed sample as a function of soaking time is presented in Figure 5. Spectral analyses indicated a 2-phase component of the Na in the cement samples, exhibiting T2* values of ~ 90 μs and
~ 180 μs with a relative intensity of approximately 1:2. The uncertainty in these
since it was necessary to use an extremely small modulation amplitude of ± 20 μT to avoid modulation-broadening effects in the spectra, which resulted in an extremely small signal from the samples.
3.3 Imaging of the 13C phase in carbonated cement
The carbonation of cement is another mechanism whereby the internal pH is lowered, thus depriving embedded steel of passivation. The process of carbonation typically takes place over a period of decades. Atmospheric CO2 gas dissolved in water at the
surface of the cement penetrates, initiating a chemical reaction involving the
conversion of all the calcium-containing phases to, amongst other substances, calcium carbonate. For example, calcium hydroxide (which comprises ca. 25% of commonly used cements such as OPC) is converted to calcium carbonate and water. The
resulting drop in pH levels within the cement exposes the steel reinforcement within the concrete structures to chemical attack by oxygen and chlorides [34]. However, the factors governing the rate of penetration of the carbonation front into cement materials are not fully understood and conventional techniques for measuring the rate of carbonation are destructive and hence prohibit repeat measurements on individual samples. The aim of the current study was therefore to investigate the feasibility of measuring a 13C profile in a cement sample undergoing carbonation.
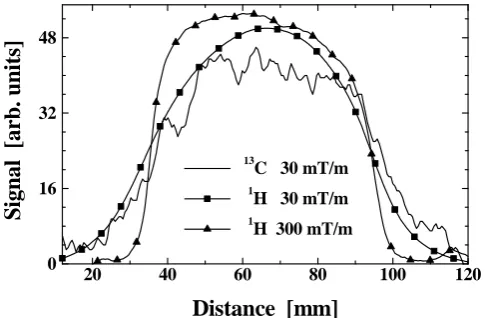
These profiles are presented in Figure 6, in which the profiles have been scaled
relative to each other for comparative purposes. The imaging of solid phases of 13C in various rigid polymers has previously been reported [35,36]; however, to the authors’ knowledge, this is the first time that a solid phase of 13C in a carbonated cement sample has been imaged using NMR techniques. Due to the extremely low signal from this sample, it was not possible to get a measure of the T2* of the 13C in this
sample.
3.4 Imaging of 7Li nuclei in powdered Li2CO3
A profile of the 7Li nuclei in a cylindrical sample of powdered Li2CO3 (diameter
20 mm, length 35 mm) is presented in Figure 7. The decrease in signal on the right side of the profile is an artefact caused by the severe signal saturation which occurred within this material, despite using an extremely low RF power of 1 mW (following base-line correction of the data, the right side of the profile was dropped onto the axis, artificially decreasing the signal in this part of the profile). The T2* of the 7Li in this
material was measured to be 55 ± 6 μs, with the relatively large error once again
attributable to the small spectral signal obtained when using a small modulation amplitude.
3.5 2-D and 3-D Imaging of a rigid polymer
amplitude of 264 μT pk-pk, 6 signal averages and 180 projections around the sample, resulting in a total acquisition time of 1.8 hours. Spectroscopic investigations carried out on this material using the CW-NMRI system indicated the presence of both crystalline and semi-amorphous phases (relative proportions 80:20), with T2* values
of 16.3 μs and 26.9 μs respectively. A schematic diagram of the phantom, together
with the raw and deconvolved images, is presented in Figure 8. A line profile taken through the 1 mm diameter hole in the raw image exhibited a decrease in signal intensity of 14 %, indicating that it is on the verge of being resolved. This increased to 30 % in the deconvolved image. The corresponding values for the 0.75 mm hole were 9 % and 17 % for the raw and deconvolved images respectively. A SNR of 82 was measured in the raw image of Figure 8(b). By way of comparison, an early implementation of the SPRITE technique achieved a SNR of only 7 for a sample of PMMA following an image acquisition time of 15 minutes [37]. Using the same image acquisition time, a SNR of 34.1 was obtained with the CW-NMRI system.
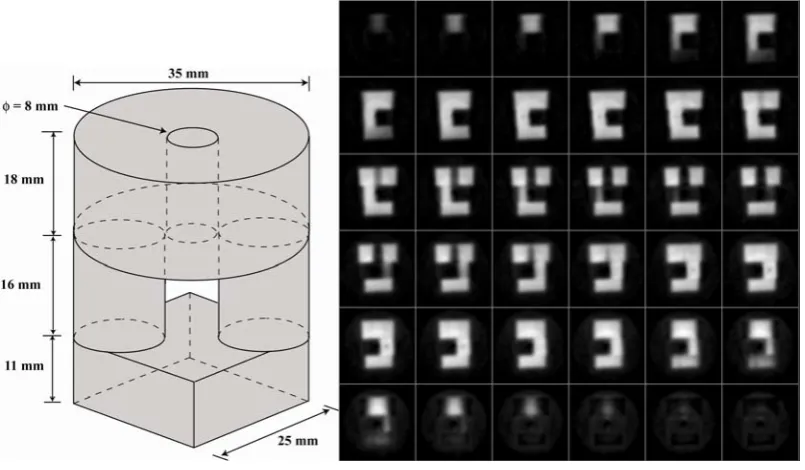
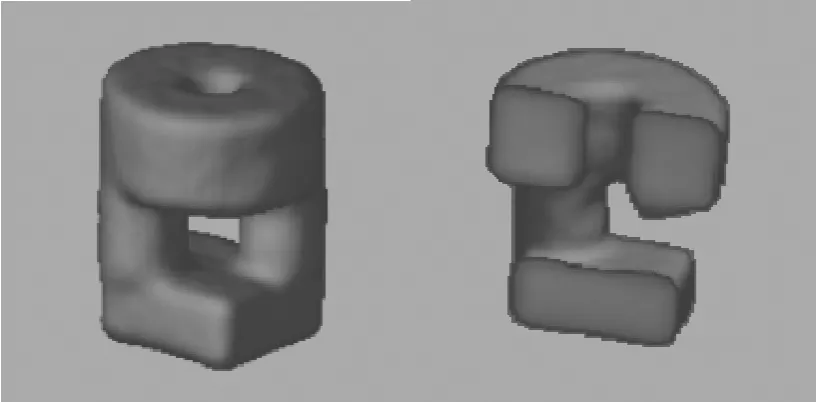
To demonstrate the 3-D imaging capabilities of the new CW-NMRI system, the PMMA phantom shown schematically in Figure 9(a) was constructed and imaged using a gradient strength of 300 mT/m, an RF power of 10 dBm, a modulation
amplitude of 317 μT pk-pk, and no signal averaging. The field of view was
(65 mm)3. In total, 5102 one-dimensional line projections were acquired at different angles around the sample, with the gradient direction stepped so as to produce isotropic resolution in the 3-D image. This resulted in an acquisition time of
roughly the mid-point through the 3-D dataset, with a resolution of approximately 1 mm. Comparisons with 3-D images of extremely short T2 materialssuch as PMMA
acquired using different solid imaging techniques are difficult due to the scarcity of published data in such materials. However, one such example was reported by Cory, who imaged a 6 mm diameter cylindrical PMMA phantom using a multipulse line narrowing technique with the acquisition of 64 x 64 in-plane data elements [38]. A 1 mm hole in this phantom was well resolved in an axial slice through the image dataset, although the signal uniformity was relatively poor and no SNR value was quoted for this image. More recently, Halse et al. acquired a 19F 3-D image of a sample of PTFE exhibiting a slightly longer T2* of 35 µs using the Centric SPIRTE
technique [31]. With a (64)3 image matrix and (8 cm)2 x 20 cm field of view, the resolution of this image was (1.25 mm)2 x 3.125 mm, with a quoted value of S/N (ratio of the mean intensity of the signal and the mean intensity of the background noise) of 10.5 and acquisition time of 40 minutes. Although the 3-D imaging
performance of the CW-NMRI technique compares reasonably well with these other techniques, the relatively lengthy acquisition time is perhaps prohibitive for most practical imaging applications. Strategies for reducing the acquisition time are currently being investigated, and it is expected that significant time savings will be possible in future experiments.
system. Furthermore, considerable scope exists for refinement of both resonator design and image reconstruction techniques. If such improvements can be implemented, the CW-NMRI technique may constitute a valuable addition to the arsenal of techniques currently available to study materials in the solid state.
Conclusions
The CW-NMRI technique has undergone a series of significant developments over recent years, to the point where complex, often heterogeneous materials with extremely short T2 relaxation values can now be imaged routinely. This paper
demonstrates, for the first time, continuous wave NMR imaging of nuclei other than
1
H, as well as the move into true 3-D imaging. The CW approach to imaging
together with the addition of 3-D, multi-nuclear imaging capabilities render should lead to a broad range of applications for CW-NMRI across materials science.
Acknowledgements
This work was funded by the UK Engineering and Physical Sciences Research Council (Grant Number GR/R02269/01). The authors would like to thank Mr. Jim Marr, Department of Chemistry, University of Aberdeen, for help with the cement carbonation experiments, and Dr. Yuanmu Deng, Ohio State University, for help with the reconstruction of the 3D dataset.
References
1. G. C. Chingas, J. B. Miller, and A. N. Garroway, NMR images of solids, J. Magn. Reson., 66, 530-535, (1986).
2. D. G. Cory, J. B. Miller, R. Turner, and A. N. Garroway, Multiple-pulse methods of H-1 NMR imaging of solids - 2nd averaging, Mol. Phys., 70, 331-345, (1990).
3. D. G. Cory, Distortions in multiple-pulse solid state NMR imaging: Gradient decoupling, time-sequenced second averaging, and over-sampling, Solid State Nucl. Mag., 6, 347-355, (1996).
4. K. Takegoshi and C. A. McDowell, A magic echo pulse sequence for the high-resolution NMR spectra of abundant spins in solids, Chem. Phys. Lett., 116, 100-104, (1985).
5. S. Matsui, Solid-state NMR imaging by magic sandwich echoes, Chem. Phys. Lett., 179, 187-190, (1991).
6. S. Hafner, D. E. Demco, and R. Kimmich, Magic echoes and NMR imaging of solids, Solid State Nucl. Mag., 6, 275-293, (1996).
8. S. Hafner and H. W. Spiess, Advanced solid state NMR spectroscopy of strongly dipolar coupled spins under fast magic angle spinning, Concept Magnetic Res., 10, 99-128, (1998).
9. H. Geen, R. Graf, A. S. D. Heindrichs, B. S. Hickman, I. Schnell, H. W. Spiess, and J. J. Titman, Spin counting with fast MAS, J. Magn. Reson., 138, 167-172, (1999).
10. F. De Luca and B. Maraviglia, Magic-angle NMR imaging in solids, J. Magn. Reson., 67, 169-172, (1986).
11. A. A. Samoilenko, D. Y. Artemov, and L. A. Sibeldina, Formation of sensitive layer in experiments of NMR subsurface imaging of solids, JETP Lett+, 47, 417-419, (1988).
12. P. J. McDonald and B. Newling, Stray field magnetic resonance imaging, Rep. Prog. Phys., 61, 1441-1493, (1998).
13. S. P. Cottrell, M. R. Halse, and J. H. Strange, NMR imaging of solids using large oscillating field gradients, Meas. Sci. Techol., 1, 624-629, (1990).
14. S. Emid, Ultra high-resolution multiple-quantum spectroscopy in solids, Physica B & C, 128, 79-80, (1985).
15. B. J. Balcom, R. P. MacGregor, S. D. Beyea, D. P. Green, R. L. Armstrong, and T. W. Bremner, Single-point ramped imaging with T-1 enhancement (SPRITE), J. Magn. Reson. A, 123, 131-134, (1996).
16. I. V. Mastikhin, B. J. Balcom, P. J. Prado, and C. B. Kennedy, SPRITE MRI with prepared magnetization and centric k-space sampling, J. Magn. Reson.,
136, 159-168, (1999).
17. B. Blumich, NMR Imaging of Materials, Clarendon Press, Oxford, (2000). 18. P. J. McDonald, Stray field magnetic resonance imaging, Prog. Nuc. Mag. Res.
Sp., 30, 69-99, (1997).
19. J. Godward, E. Ciampi, M. Cifelli, and P. J. McDonald, Multidimensional imaging using combined stray field and pulsed gradients, J. Magn. Reson., 155, 92-99, (2002).
20. M. A. Baumann, G. M. Doll, and K. Zick, Stray-field (STRAFI) imaging of teeth, Oral. Surg. Oral. Med. O., 75, 517-522, (1993).
21. S. D. Beyea, B. J. Balcom, T. W. Bremner, P. J. Prado, D. P. Green, R. L.
Armstrong, and P. E. Grattan-Bellew, Magnetic resonance imaging and moisture content profiles of drying concrete, Cement Concrete Res., 28, 453-463, (1998). 22. P. Szomolanyi, D. Goodyear, B. Balcom, and D. Matheson, SPIRAL-SPRITE: a
23. D. J. Lurie, S. J. McCallum, J. M. S. Hutchison, and M. Alecci, Continuous-wave NMR imaging of solids, MAGMA, 4, 77-81, (1996).
24. G. R. Davies, D. J. Lurie, J. M. S. Hutchison, S. J. McCallum, and I. Nicholson, Continuous-wave magnetic resonance imaging of short T-2 materials, J. Magn. Reson., 148, 289-297, (2001).
25. A. J. Fagan, G. R. Davies, J. M. S. Hutchison, and D. J. Lurie, Continuous wave MRI of heterogeneous materials, J. Magn. Reson., 163, 318-324, (2003).
26. E. W. Randall, Stray Field (STRAFI) NMR: Imaging in Large Field-Gradients, In: "Advances in NMR, Volume 9", Eds.: D. M. Grant and R. K. Harris, p. 150-164, John Wiley & Sons, (2002).
27. P. Bodart, T. Nunes, and E. W. Randall, Stray-field imaging of quadrupolar nuclei of half integer spin in solids, Solid State Nucl. Mag., 8, 257-263, (1997). 28. D. G. Gillies, B. Newling, and E. W. Randall, Phosporus-31 solid-state NMR in
high-field gradients: Prospects for imaging bone using the long echo-train summation technique (LETS), J. Magn. Reson., 151, 235-241, (2001). 29. E. W. Randall, A. A. Samoilenko, and R. Q. Fu, STRAFI imaging of
paramagnetic solids: P-31 paramagnetic displacements, Magn. Reson. Chem.,
40, 93-95, (2002).
30. F. D. Cano, T. W. Bremner, R. P. McGregor, and B. J. Balcom, Magnetic resonance imaging of H-1, Na-23, and Cl-35 penetration in Portland cement mortar, Cement Concrete Res., 32, 1067-1070, (2002).
31. M. R. Halse, D. J. Goodyear, M. MacMillan, P. Szomolanyi, D. Matheson, and B. J. Balcom, Centric scan SPRITE magnetic resonance imaging, J. Magn. Reson., 165, 219-229, (2003).
32. G. Hunter and R. Jones, In: "Network News - EPSRC Engineering Network for the Application of NMR Techniques to Improve Concrete Performance, Issue 2", EPSRC, UK, (2001).
33. L. Pel, K. Kopinga, and E. F. Kaasschieter, Saline absorption in calcium-silicate brick observed by NMR scanning, J. Phys. D: Appl. Phys., 33, 1380-1385, (2000).
34. A. M. Neville, Properties of Concrete, Longman Group, Harlow, (1995).
35. J. B. Miller and A. N. Garroway, C-13 Refocused Gradient Imaging of Solids, J. Magn. Reson., 85, 255-264, (1989).
36. Y. H. Sun, H. Lock, T. Shinozaki, and G. E. Maciel, Solid-state C-13 NMR imaging with magic-angle spinning, J. Magn. Reson. A, 115, 165-173, (1995). 37. C. B. Kennedy, B. J. Balcom, and I. V. Mastikhin, Three-dimensional magnetic
imaging with T-1 enhancement (SPRITE), Can. J. Chem., 76, 1753-1765, (1998).
38. D. G. Cory, Three-Dimensional NMR Imaging of Solids, In: "Magnetic Resonance Microscopy", Eds.: B. Blumich and W. Kuhn, p. 49-59, VCH, Weinheim, Germany, (1992).
Figure Legends
Figure 1 Block diagram of the principal components in the CW NMRI system
Figure 2 1-D profiles of the 27Al content in cylindrical Secar 80® cement samples
Figure 3 2-D image of the chemically combined 27Al component in a Secar 80® cement sample, illustrating a 6 mm and 8 mm hole on the left and right side
respectively. (a) raw image, (b) deconvolved image, and (c) a horizontal profile through the mid-point of the two holes for each image. A SNR of 19 was measured in the raw image.
Figure 4 Profiles of the 23Na concentration in OPC samples with w/c ratios of 0.3, 0.4 and 0.5 soaked in brine, showing enhanced uptake for larger w/c values.
Figure 6 1-D profiles of the carbonated cement sample, showing 13C and 1H profiles measured at 30 mT/m and a high resolution 1H profile measured at 300 mT/m. The 13
C profile was multiplied by 500 for comparative purposes.
Figure 7 1-D profile of the 7Li concentration measured in a sample of powdered Li2CO3.
Figure 8 (a) Schematic diagram of the PMMA resolution phantom, and (b) raw and (c) deconvolved images A SNR of 82 was measured in the raw image..
Figure 9 (a) Schematic and (b) coronal slices through the reconstructed 3-D dataset of the PMMA phantom A SNR of 32.8 was measured in a central slice.
Figure 2
20 40 60 80 100
0.0 0.5 1.0 1.5 2.0
w/c = 0.3 w/c = 0.4 w/c = 0.5
Si
gnal
[ar
b.
units]
Figure 3
0 8 16 24 32
0 100 200
(c)
raw
deconvolved 8 mm hole 6 mm hole
Si
gnal
[a
rb
. uni
ts
]
Figure 4
20 40 60 80 100
0.0 0.2 0.4 0.6
w/c = 0.5 w/c = 0.4 w/c = 0.3
Sign
a
l [a
rb
. u
n
it
s]
Figure 5
20 40 60 80 100
0.0 0.1 0.2 0.3 0.4 0.5
10 mins 1 hr 4 hrs 7 hrs 16 hrs 41 hrs
Si
gnal
[arb. uni
ts
]
Figure 6
20 40 60 80 100 120
0 16 32 48
13C 30 mT/m
1H 30 mT/m
1H 300 mT/m
Signal
[arb. uni
ts]
Figure 7
10 20 30 40 50 60
0.0 0.4 0.8 1.2 1.6
Si
g
n
a
l [arb.
uni
ts
]
![Figure 7 1.6Signal [arb. units]](https://thumb-us.123doks.com/thumbv2/123dok_us/998833.614419/32.595.184.412.110.235/figure-signal-arb-units.webp)