Diet and other risk indicators
associated with dental
problems in Irish preschool
children
A thesis submitted to the University of Dublin, Trinity College for the Degree of Doctor of Philosophy
Prepared by: Michael James Crowe B.Sc., B.Dent.Sc.
Division of Restorative Dentistry and Periodontology, Dublin Dental University Hospital, University of Dublin, Trinity College, Lincoln Place, Dublin 2
Declaration
I declare that this thesis has not been previously submitted as an exercise for a degree at this or another university.
I declare that this report is entirely my own work unless otherwise stated, and in which case, acknowledgements and references are given to the work of others.
I agree to deposit this thesis in the University’s open access institutional repository or allow the library to do so on my behalf, subject to Irish Copyright Legislation and Trinity College Library conditions of use and acknowledgement.
Summary
Investigations into the wider bioecological understanding of dental problems in early childhood are frequently limited in national surveys. Initially, this research used Classification tree analysis (CTA) and logistic regression to explore multilevel interactions among key aspects of child and primary caregiver (PCG) psychosocial and physical health affecting dental problems in preschool children. Data were derived from the Growing Up in Ireland (GUI) study, a nationally representative sample of 9 month olds (n=11,134) in 2007/2008 followed-up at age 3 years (n=9,793) in 2010/2011. Analysis included PCG reports of childrens’ dental problem visits, general health, temperament, emotional and behavioural difficulties as well as their own general health, stress and depression, relationship and sociodemographic variables. Dental problems were reported among 2.7% of infants at 9 months of age and 5.0% at 3 years. CTA identified infant temperament (ICQ unpredictable) as the primary predictor of dental problems at 9 months and child global health at 3 years of age. Key aspects of infant/child and PCG health, and psychosocial characteristics associated with reported dental problems should be considered in future multidisciplinary approaches to child health.
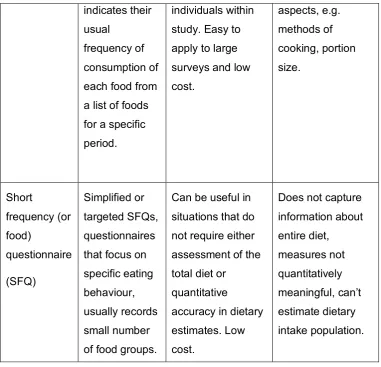
To further explore the pattern of cariogenic food intake data mapping protocols were developed to link dietary intake estimates for 3 year old children from the National Preschool Nutritional Survey (NPNS) and the second wave of the GUI infant cohort. The GUI survey used a short frequency questionnaire (SFQ) which provided a limited list of “healthy” and “unhealthy foods”. This limited dietary intake was augmented by unidirectional mapping from the more detailed National Preschool Nutrition Survey (NPNS) which used a detailed 4 day weighed food diary. Through mapping the food codes in this manner and estimating the degree of non-covered food it was possible to visualise the relative performance of the brief dietary instrument compared to the more detailed one especially in capturing specific food types, e.g., high sugar foods. The SFQ did not capture a substantial portion of habitual foods consumed by 3 year olds in Ireland. Researchers interested in focussing on specific foods, such as those high in sugar, could use this approach to easily assess the proportion of foods covered, non-covered or partially-covered by reference to the mapped food database
.
Acknowledgements
My sincere gratitude and thanks to all the wonderful people, who have made my PhD journey an interesting, enjoyable experience. In particular, I would like to thank my supervisor Michael O’ Sullivan, without whose constant motivation and guidance, I would neither have started nor finished this work. Many thanks Mike, for providing me firstly, with the opportunity, and secondly with the unwavering support to complete this research, it is greatly appreciated. Aifric O’ Sullivan was a wonderful co-supervisor and educator in understanding diet and nutrition. Thank you Aifric, for your clear, insightful supervision and constant willingness to go the extra mile. Oscar Cassetti, opened the world of data science to me. Anyone who makes statistics exciting has a special gift and I was fortunate to encounter a mathematician with a fascination for health and nutrition. Thank you, Oscar for helping me to learn so much from all those meetings and Skype calls across the world.
I am extremely grateful to Professor June Nunn for her encouragement in the early stages and to Professor Brian O’ Connell who provided continued inspiration and support. Many thanks to the Executive Team of the Dublin Dental University Hospital for funding this research. My thanks also to Professor Colman McGrath who helped originate the research topics and assisted greatly in the early stages of the work. Lorraine Swords provided insight into the fascinating world of psychology and I am very grateful for her guidance.
Thanks to all the staff in Department 2 and especially to Jeff for insights into his golf swing on late Friday evenings. To all the surgery staff for putting up with me (even more than usual) for the last 4 years and for pretending there has been no impact at work. My thanks to Catherine Lovett for her very helpful advice on formatting.
learning, your guiding hand will remain with me always and I will cherish our memories forever.
My joyous and extraordinary children, Séan, Aisling and David, without whose never-failing advice and help about statistics and life this thesis would have been finished in half the time.
Table of Contents
DECLARATION ... II
SUMMARY ... IV
ACKNOWLEDGEMENTS ... VII
TABLE OF CONTENTS ... IX
LIST OF FIGURES ... XIII
LIST OF TABLES ... XVII
LIST OF ABBREVIATIONS ... XIX
GLOSSARY ... XX
PUBLICATIONS ... XXVI
CHAPTER 1. INTRODUCTION ... 1
1.1. GENERAL INTRODUCTION... 1
1.2. DENTAL PROBLEMS IN PRESCHOOL CHILDREN ... 3
1.2.1. OVERVIEW ... 3
1.2.2. NATURAL HISTORY OF ECC ... 7
1.2.3. RISK FACTORS AND INTERDISCIPLINARY APPROACHES ... 8
1.2.3.1. Terminology ... 8
1.2.3.2. Food and drink factors and oral health ... 9
1.2.3.3. Interdisciplinary factors ... 9
1.2.3.4. Prevention of ECC and the common risk factor ...11
1.3. CONCEPTUAL MODELS OF CHILD ORAL HEALTH ...12
1.3.1. OVERVIEW ...12
1.3.2. NATIONAL CHILD SURVEYS ...15
1.3.3. GROWING UP IN IRELAND...15
1.3.4. NATIONAL PRESCHOOL NUTRITION SURVEY (NPNS) ...18
1.4. DIET, OBESITY AND DENTAL HEALTH- THE COMMON RISK FACTOR APPROACH ...19
1.5. CARIOGENIC FOOD AND DRINK ...22
1.5.1. OVERVIEW ...22
1.5.2. ASSESSING DIETARY INTAKE ...28
1.6. SUGARS CONSUMPTION AND DENTAL HEALTH... 32
1.6.1. SUGARS AND HEALTH ... 32
1.6.2. TERMINOLOGY AND CLASSIFICATION OF DIETARY SUGARS... 33
1.6.3. DIETARY RECOMMENDATIONS ... 34
1.6.4. FREE SUGAR ESTIMATION AND CONSUMPTION ... 35
1.7. DATA MINING AND DATA ANALYSIS TECHNIQUES ... 36
1.7.1. DATA PIPELINE ... 37
1.7.2. LEARNING FROM THE DATA: DECISION TREE METHODS ... 39
1.7.3. ASSOCIATION ANALYSIS... 42
1.7.4. VISUALISATION OF DATA ... 43
1.8. CONCLUSIONS ... 46
1.9. AIMS AND OBJECTIVES ... 47
CHAPTER 2. GENERAL METHODS ... 49
2.1. OVERVIEW ... 49
2.2. DATA SOURCES AND THE STUDY POPULATION ... 50
2.3. DATA PIPELINE AND ANALYTICAL TECHNIQUES ... 53
2.3.1. DATA PIPELINE ... 53
2.3.2. STATISTICAL PROGRAMMES... 54
2.3.3. ANALYTICAL TECHNIQUES ... 55
2.3.4. GRAPHICS VISUALISATION TOOLS ... 57
2.3.5. MAPPING/FILTERING ... 57
2.3.6. ASSOCIATION ANALYSIS... 57
2.4. EARLY CHILDHOOD DENTAL PROBLEMS: CLASSIFICATION TREE ANALYSES AT 9 MONTHS AND 3 YEARS OF AGE ... 58
2.4.1. DATA AND VARIABLES... 58
2.4.1.1. Sociodemographic variables ... 58
2.4.1.2. Variables related to health ... 58
2.4.1.3. Psychosocial variables/Behavioural habits ... 59
2.4.2. DATA ANALYSIS ... 59
2.5. WEIGHT STATUS AND DENTAL PROBLEMS AT 9 MONTHS AND 3 YEARS OF AGE: CLASSIFICATION TREE ANALYSIS ... 60
2.5.1. DATA AND VARIABLES... 60
2.5.1.1. Anthropometric measurements ... 60
2.5.1.3. CTA predictor variables ...62
2.5.2. DATA ANALYSIS ...63
2.6. MEASURING DIETARY INTAKE ...63
2.6.1. DATA COLLECTION AND PARTICIPANTS...63
2.6.2. FOOD INTAKE MEASUREMENT ...64
2.6.3. DATA PREPARATION AND MAPPING PROTOCOL ...65
2.6.4. ALIGNING TWO SURVEYS-GUI AND NPNS ...68
2.6.5. QUANTITATIVE ANALYSIS OF MAPPED DATA AND AUGMENTED DATABASE ...70
2.6.6. DATA PREPARATION AND ANALYSIS FOR CARIOGENIC FOOD INTAKE AND MEAL ANALYSIS ...71
2.6.7. MEAL AND CF PATTERN ANALYSIS ...73
2.7. SUGAR INTAKE AND FREE SUGAR MAPPING...73
CHAPTER 3. EARLY CHILDHOOD DENTAL PROBLEMS: CLASSIFICATION TREE ANALYSES OF TWO WAVES OF AN INFANT COHORT STUDY ...77
3.1. INTRODUCTION ...77
3.2. METHODS ...78
3.2.1. DATA AND VARIABLES ...78
3.2.2. DATA ANALYSIS ...79
3.3. RESULTS ...79
3.3.1. PROFILE OF THE SAMPLE ...79
3.3.2. CLASSIFICATION TREE AT 9 MONTHS OF AGE ...81
3.3.3. CLASSIFICATION TREE AT 3 YEARS OF AGE ...85
3.4. DISCUSSION ...89
3.5. CONCLUSIONS ...94
CHAPTER 4. WEIGHT STATUS AND DENTAL PROBLEMS IN EARLY CHILDHOOD: CLASSIFICATION TREE ANALYSIS OF A NATIONAL COHORT ...95
4.1. INTRODUCTION ...95
4.2. METHODS ...97
4.3. RESULTS ...97
4.3.1. COHORT PROFILE ...97
4.3.1. DIETARY INTAKE ... 100
4.3.2. CLASSIFICATION TREE ANALYSIS ... 101
4.4. DISCUSSION ... 104
CHAPTER 5. DATA MAPPING PROTOCOLS TO AUGMENT THE QUALITY OF REPORTED FOOD
INTAKE DATA IN A SHORT FOOD QUESTIONNAIRE ... 109
5.1. INTRODUCTION ... 109
5.2. METHODS ... 112
5.3. RESULTS ... 113
5.4. DISCUSSION ... 120
5.5. CONCLUSIONS ... 122
CHAPTER 6. PATTERNS OF SELECTED CARIOGENIC FOOD AND DRINK INTAKE IN PRESCHOOL CHILDREN: LINKING DATA FROM TWO NATIONAL SURVEYS ... 123
6.1. INTRODUCTION ... 123
6.2. METHODS ... 125
6.3. RESULTS ... 127
6.3.1. CARIOGENIC FOOD AND BEVERAGE INTAKE ... 127
6.3.2. ASSOCIATION ANALYSIS OF EATING OCCASIONS ... 137
6.4. DISCUSSION ... 149
6.5. CONCLUSIONS ... 154
CHAPTER 7. ESTIMATION AND CONSUMPTION PATTERN OF FREE SUGAR INTAKE IN 3 YEAR OLD PRE SCHOOLERS ... 156
7.1. INTRODUCTION ... 156
7.2. METHODS ... 158
7.2.1. DATA SOURCE ... 158
7.2.2. DATA WORK FLOW ... 158
7.3. RESULTS ... 160
7.3.1. FS MAPPED DATABASE ... 160
7.3.2. KEY SUGAR FOOD SOURCES ... 166
7.4. DISCUSSION ... 170
7.5. CONCLUSIONS ... 175
CHAPTER 8. GENERAL DISCUSSION ... 176
REFERENCES ... 186
APPENDIX A ... 216
List of Figures
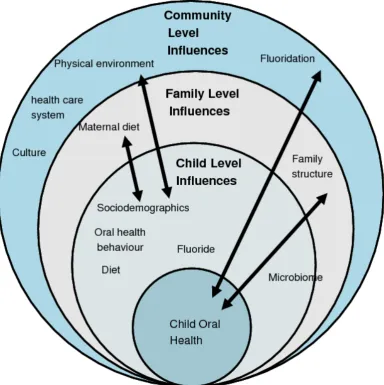
Figure 1.1 The VicGeneration Causal Model of child, family and community influences on oral health outcomes for children. Amended from Johnson et al. (2016).
Figure 1.2 Infant Cohort Longitudinal Sample, Growing Up in Ireland.
Figure 1.3 Bronfenbrenner’s Bioecological Model of Human development. Amended from Garbarino (1982).
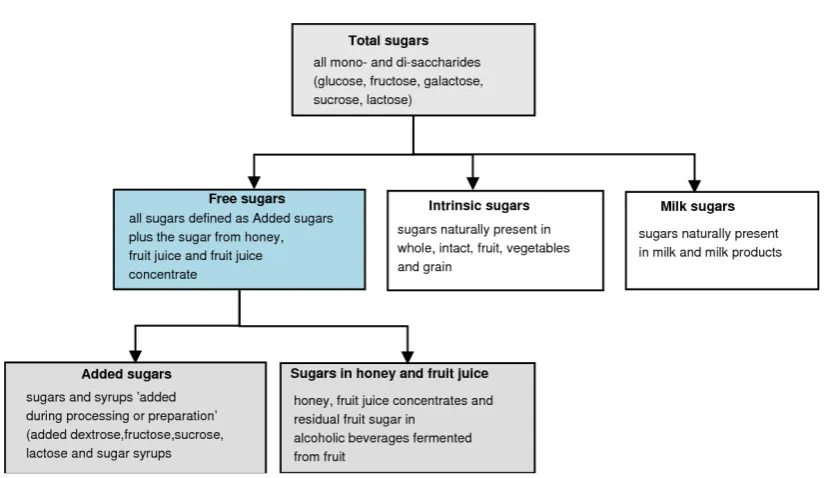
Figure 1.4 Classification of dietary sugars. Amended from Moynihan et al. (2018)
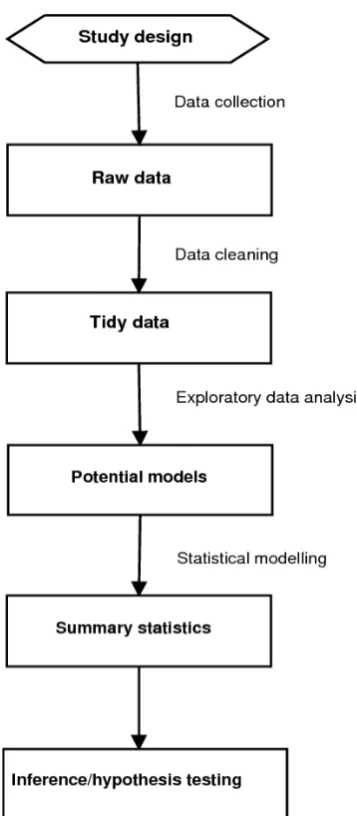
Figure 1.5 Data pipeline in the design and analysis of a successful study. Adapted from Leek and Peng (2015).
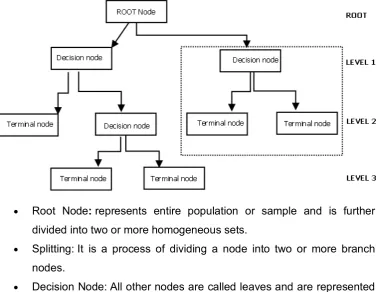
Figure 1.6 Graphical illustration of the components and structure of a decision tree. Amended from Rokach and Maimon (2009).
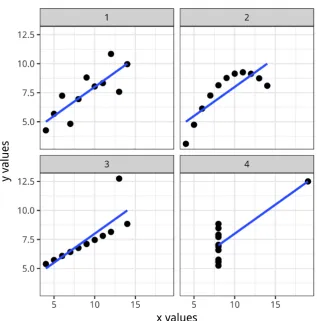
Figure 1.7. Graphs in statistical analysis. Amended from Tufte (2001).
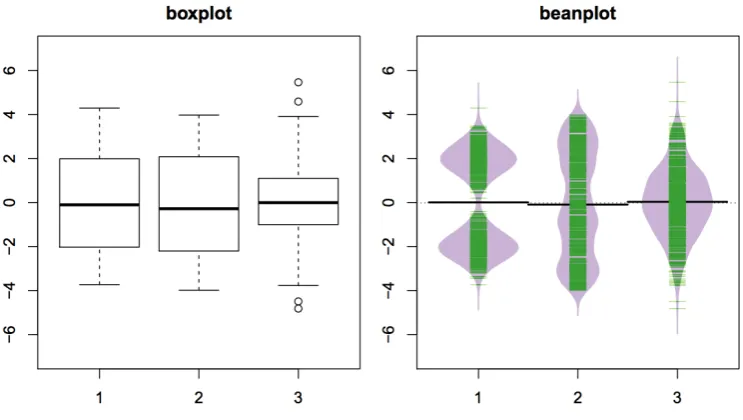
Figure 1.8 Comparison of boxplots and beanplots for a biomodal, a uniform and a normal distribution. Green lines in the beanplots show individual observations, while the purple area shows the distribution. Amended from Kampstra (2008).
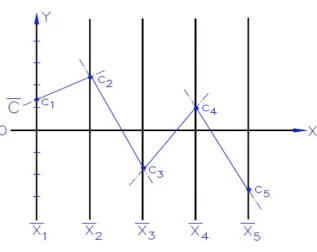
Figure 1.9 Parallel coordinates: illustration of mapping on the plane with x y-Cartesian, starting on the y-axis, N copies of the real line, labelled x1, x2…,.xN are placed equidistant and perpendicular to the x-axis. The point C = (c1, c2, c3, c4, c5) is represented by the polygonal line shown. Amended from Inselberg (1985).
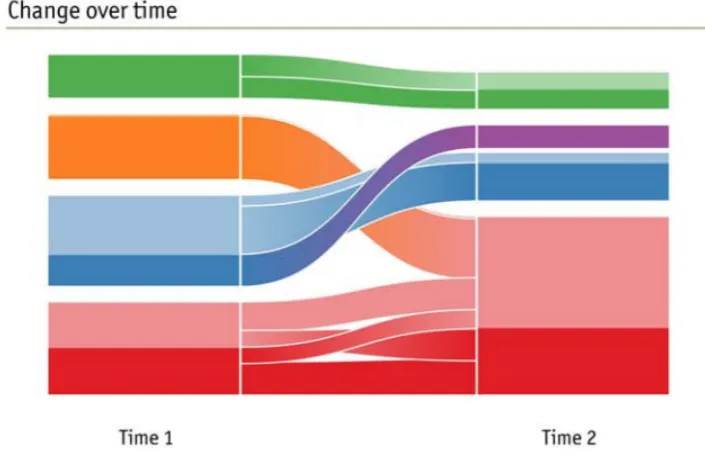
Figure 1.10 Alluvial diagram mapping change in networks. The height of each block represents the volume of flow though each cluster, with significant subsets in darker colour. Amended from Rosvall and Bergstrom (2010). Figure 2.1 Data access protocol for Growing Up in Ireland (GUI) and the National Preschool Nutrition Survey (NPNS) datasets.
Figure 2.3 Flow diagram showing data processing steps for unidirectional mapping of GUI food codes with NPNS food codes. GUI: Growing Up in Ireland; NPNS: National Preschool Nutrition Survey.
Figure 2.4 Code snippet illustrating manual mapping of GUI food codes and an example of a partially-covered group (Fruit purees and smoothies), showing the food name, cooking method, NPNS food group code (n=77), NPNS individual food code, food description and GUI food code.
Figure 2.5 Protocol for aligning GUI and NPNS surveys.
Figure 2.6 Decision algorithm for estimating free sugars content of national preschool nutrition survey (NPNS) foods. Amended from Louie et al. (2015). Figure 3.1 Prevalence of reported dental problems at 9 months of age among classification tree subgroups, percentage (%) and number (N) in each class. Figure 3.2 SPSS output showing prevalence of reported dental problems at 9 months of age among classification tree subgroups, percentage (%) and number (N) in each class, adjusted p-value and chi-square statistic.
Figure 3.3 Prevalence of reported dental problems at 3 years of age among classification tree subgroups, percentage (%) and number (N) in each class; PCG highest education level subgroups – Edu_1: Lower secondary; Non Degree; Postgrad Certificate; Upper secondary and Technical; Professional qualification; Edu_2: Primary education; Masters Degree; Primary Degree; Degree and Professional qualification; Edu_3: No education; Technical or vocational qualification; Doctorate; <missing>. PCG, primary caregiver.
Figure 3.4 SPSS output showing prevalence of reported dental problems at 3 years of age among classification tree subgroups, percentage (%) and number (N) in each class, adjusted p-value and chi-square statistic.
Figure 4.1 Food and drink items consumed in the previous 24 hours by the Growing Up in Ireland infant cohort at 3-years of age.
Figure 4.2 Prevalence of reported dental problems by the Growing Up in Ireland infant cohort at 3-years of age among classification tree subgroups, percentage (%) and number (n) in each class.
(Figure 5.2a) or weight (Figure 5.2b) of a food item consumed in NPNS that were non-covered by the mapped GUI data model.
Figures 5.2a and 5.2b Food frequency and consumption weight non-covered by GUI survey by the day of the week representing the distribution of the ratio of consumption counts* (Figure 5.3a) or weight (Figure 5.3b) of a food item consumed in NPNS that were non-covered by the mapped GUI data model over the total food covered.
Figures 6.1a and 6.1b Bean plots illustrating the distribution patterns (kernel density estimates) of weight of food consumed (Figure 6.1a) and frequency of consumption (Figure 6.1b) of snacks and main meals estimated using the mean daily intake method.
Figures 6.2a and 6.2b Bean plots illustrating the distribution patterns (kernel density estimates) of weight of food consumed (Figure 6.2.a) and frequency of consumption (Figure 6.2.b) of snacks and main meals estimated using the average consumption method.
Figure 6.3 Alluvial plot of association analysis of the 10 most frequent eating occasions of cariogenic food using keys* for NPNS†-derived food codes for cariogenic and non-cariogenic descriptors.
Figure 6.4 Alluvial plot illustrating association analysis of 2 eating occasions with cariogenic food using keys* for NPNS†-derived food codes for cariogenic and non-cariogenic descriptors.
Figure 7.1 Flow chart depicting the processes in the mapping and analysis of free sugar intake using the Growing Up in Ireland (GUI) database augmented with the national preschool nutrition survey (NPNS).
Figure 7.2 Snippet illustrating the free sugar mapping procedure of the NPNS food data.
Figure 7.3 Sample of dataframe in RStudio, illustrating the mapped GUI database (from NPNS) with mean total sugar content of food items (g/100g) and amount of free sugar in the meal (g).
List of Tables
Table 1.1 Selected International Child Cohort Studies.
Table 1.2 Summary of studies reporting caries in preschool children in Ireland. Table 1.3 Selected foods and drink that are potentially cariogenic.
Table 1.4 Dietary assessment methods and their application in dental-related nutrition research.
Table 2.1 Confusion matrix for model performance evaluation.
Table 2.2 International Obesity Task Force (IOTF) Body Mass Index Cut-Offs for Thinness, Overweight and Obesity in 3 year old Children.
Table 2.3 Food consumption entries for day 1 of survey for child subject ID 108 showing time, meal type, NPNS food code, food weight, GUI food code where mapped and NA indicating non-covered.
Table 3.1 Demographics and profile of Growing Up in Ireland Infant Cohort Study Participants.
Table 4.1 Weighted * Sample Characteristics, Growing Up in Ireland infant cohort participants 2010/11 (Child 3-years of age).
Table 4.2 Confusion matrix showing selected performance measures for Classification tree analysis of dental problem prevalence in the Growing Up in Ireland infant cohort at 3-years of age.
Table 5.1 Comparison of survey characteristics of National Preschool Nutritional Survey (NPNS) and Growing Up in Ireland (GUI) national infant cohort survey.
Table 5.2 Number of Eating Occasions (EO), Food amount (g/day) and Standard Deviation (SD) of selected non-covered food items in augmented food database.
Table 6.2 Cariogenic food eating occasions [frequency and amount (Food wt, g/d)] estimated using mean daily intake method for consumers only.
Table 6.3 Cariogenic food eating occasions [frequency and amount (Food wt, g/d)] estimated using average consumption method for consumers only. Table 6.4 Association analysis, using keys* for GUI†-derived food codes, showing the number of subjects and food amount for the most commonly consumed main meal or snack and total number of eating occasions (EO) covered and non-covered by GUI food codes.
Table 6.5 Association analysis, using keys* for NPNS† -derived food codes, showing the most commonly consumed main meal or snack, total number of eating occasions (EO), number of subjects who consumed the meal and weight of food.
Table 6.6 Association analysis of 20 most frequent eating occasions using keys* for NPNS†-derived food codes for cariogenic and non-cariogenic descriptors.
Table 7.1 Summary statistics for comparison of free sugar estimations (g) carried out in this analysis (a) and that carried out by a previously reported mapping (b).
Table 7.2 Daily intake of total and free sugar for 3 year old children by amount (g/day), frequency (as a meal or snack), as a percentage of Total Energy Intake (TEI) and the proportion of the sample population with free sugars (FS) intake ≥10% and ≥5% of TEI
List of Abbreviations
BMI Body mass index
CART Classification and regression tree analysis
CF Cariogenic Food and Drink
CHAID Chi-square Automatic Interaction Detection
CTA Classification Tree Analysis
ECC Early Childhood Caries
EO Eating Occasions
FD Food Diary
FS Free Sugars
GUI Growing Up in Ireland
IOTF International Obesity Task Force
KDD Knowledge Discovery in Databases
NPNS National Preschool Nutrition Survey
NCF Non-Cariogenic Food and Drink
NLP Natural Language Processing
RTEBC Ready To Eat Breakfast Cereals
TEI Total Energy Intake
TS Total Sugars
Glossary
Accuracy; this is by far the most widely known measure of classifier performance. For a classifier, accuracy is defined as the number of items categorised correctly divided by the total number of items. It is simply what fraction of the time the classifier is correct. At the very least, a classifier must be accurate. In terms of a confusion matrix, accuracy is (TP+TN)/ (TP+FP+TN+FN). Accuracy used in a classification sense is not to be confused with accuracy used in a numeric sense which is defined as score-based accuracy as a numeric quantity that can be decomposed into numeric versions of trueness and precision.
Accuracy paradox; states that predictive models with a given level of accuracy may have greater predictive power than models with higher accuracy. Despite optimizing classification error rate, high accuracy models may fail to capture crucial information transfer in the classification task. This is why it is important to use parameters other than accuracy to evaluate model performance.
Algorithm; a series of repeatable steps for carrying out a certain type of task with data.
Association analysis; used to find objects or attributes that frequently occur together. The algorithms look for all the itemsets (subsets of transactions) that occur more often than in a minimum fraction of the transactions and then turn those itemsets into rules.
Bagging; stands for “Bootstrap Aggregating” whereby bootstrap samples are drawn randomly with replacement.
Bar chart; this is a histogram for discrete data: it records the frequency of every value of a categorical variable.
Binning; data binning is a data pre-processing technique used to reduce the effects of minor observation errors. Statistical data binning is a way to group a number of more or less continuous values into a smaller number of "bins". Histograms are an example of data binning.
Boosting; machine learning algorithms that try to improve the accuracy of a classifier by a reweighting of misclassified samples.
Black-box; many machine learning applications involve predictive analytic modelling using black-box techniques. Breiman (2001) stated- “the analysis in this culture considers the inside of the (black) box complex and unknown”. The approach is to find a function or algorithm that operate on independent variables to predict the response variables.
Bootstrap; a popular method for variance estimation in surveys. Data are resampled repeatedly, and a statistic is calculated for each resampling to form an empirical distribution for that statistic.
Bonferroni adjustment; the Bonferroni correction adjusts probability (p) values because of the increased risk of a type I error when making multiple statistical tests.
Code fragment; also described as code snippet, is a piece of executable code. Code chunks, can be used to render R output into documents or to display code for illustration.
Cross-validation; a widely used method for estimating prediction error for a model, Ideally, if there is enough data, we would set aside a validation set would be set aside and used to assess the performance of the prediction model. Since data are often scarce, this is usually not possible. In this situation, a K-fold cross- validation can use part of the available data to fit the model, and a different part to test it.
Data.frame; the main data type in R, similar to a spreadsheet with tabular columns and rows.
Data.table; a high speed extension of data.frames.
Data Science; the merging sciences of statistics, machine learning, computer engineering and visualisation.
Data mining; data mining (DM) is the core of the KDD process, involving the inferring of algorithms that explore the data, develop the model and discover previously unknown pattern.
Decision tree; modern technique for performing nonlinear regression or classification by iteratively splitting predictors.
Dependent variable; see output.
Determinant: an attribute or exposure that increases the probability of occurrence of a specified outcome.
Dispersion; refers to the variation within a sample or a population and standard measures include the variance and the range.
Eating occasions: all snacks and main meals were collectively described as eating occasions.
Fitted model; a fitted model is just the closest model from a family of models. That implies that one has the “best” model (according to some criteria); it doesn’t imply that model is “good” and it certainly doesn’t imply that the model is “true”.
Greedy (algorithm); a programming technique which always seems to make the locally optimal choice at each stage in the hope of finding a global optimum. Histogram; an accurate representation of the distribution of numerical data. It is an estimate of the probability distribution of a continuous variable. Histograms display the distribution of a continuous variable by dividing up the range of scores into a specified number of bins on the x-axis and displaying the frequency of scores in each bin on the y-axis. A basic histogram bins a variable into fixed-width buckets and returns the number of data points that falls into each bucket.
Independent variable; see input.
Input; often called predictor or independent variable in statistical literature, also called features in the pattern recognition literature.
a nonparametric method for estimating the probability density function of a random variable.
K-fold cross-validation; practice of splitting the derivation data into K equal parts. The model is then trained on K-1 parts and validated on the remaining part.
Knitr; modern package for interweaving R code with Markdown.
Knowledge Discovery in Databases (KDD); an automatic, exploratory analysis and modelling of large data repositories. KDD is the organized process of identifying valid, novel, useful, and understandable patterns from large and complex data sets.
LMS parameters; the LMS parameters are the power in the Box-Cox transformation (L), the median (M) and the generalised coefficient of variation (S).
Markdown; simplified formatting syntax used to produce elegant HTML documents in simple fashion.
Model; a statistical model makes assumptions about the generation of sample data and embodies an expectation of the relationships between the data and various factors in the actual population data.
Machine learning; modern, computationally heavy statistics, set of tools ranging from artificial neural networks to random forests and decision trees. Used in ‘data mining’, knowledge discovery in databases’ and pattern recognition. Non-parametric model; a model where the response does not necessarily follow the regular GLM distributions such as Normal, Logistic or Poisson Outcome criteria; output variables used to rank or measure the desirability or undesirability of possible model outcomes. Their values are determined by the input quantities and the models that use them.
Output variable; also called outcome, target, response or dependant variable Overfitting; an analysis that corresponds too exactly to a particular set of data and may therefore fail to fit additional data or predict future observations reliably. Essentially, an overfit model appears promising on the training data and performs poorly on new data.
described by its probability distribution. If y is discrete, often called the probability distribution of y, say p(y), the probability mass function of y. If y is continuous, the probability distribution of y, say f(y), is often called the probability density function for y.
Random error; also known as variability, random variation, or ‘noise in the system’. The heterogeneity in the human population leads to relatively large random variation in clinical trials. Random error corresponds to imprecision. Recursive partitioning; where the feature space is recursively split into regions containing observations with similar response values. Decision trees are an example of recursive partitioning. As each sub-population may in turn be split an indefinite number of times until the splitting terminates it is described as recursive.
Risk indicator; an exposure that is associated with an outcome only in cross-sectional data. A risk indicator may be a probable, or putative, risk factor. Risk factor; Risk factor: an environmental, behavioural, or biologic factor confirmed by temporal sequence, usually in longitudinal studies, which if present directly increases the probability of a disease occurring, and if absent or removed reduces the probability.
Risk marker; an attribute or exposure that is associated with increased probability of disease but is not necessarily a causal factor. Sampling techniques include random oversampling and random undersampling. Oversampling randomly duplicates the minority class samples, while undersampling randomly discards the majority class samples in order to modify the class distribution.
Sensitivity; also called recall or True positive ratio (TPR) = TP/TP+FN. Calculates proportion of positives correctly identified.
Specificity; also called True Negative Ratio (TNR) =TN/TN+FP. Measures proportion of negatives correctly identified.
Stratification; grouping the study population into subgroups by their homogenous characteristics before sampling so as to improve the representativeness of a sample.
the predictor measurements there is an associated response measurement. Systematic error or bias; refers to deviations that are not due to chance alone. Bias corresponds to inaccuracy.
Total energy intake: the sum of all daily energy (kilojoules/kilocalories) from fat, protein, carbohydrates and alcohol consumption.
Publications
Presentations and proceedingsCROWE, M., O’ SULLIVAN, M., NUNN, J.H., MCGRATH. Dental Problems in Early Childhood Are Associated with Health and Relationships. International Association for Dental Research/Pan European Regional Congress Dubrovnik, Croatia.
CROWE, M., O’ SULLIVAN, M., NUNN, J.H., MCGRATH. 2014. Dental Problems During Early Childhood Associated with Caregiver and Child Health. International Association for Dental Research/Pan European Regional Congress Dubrovnik, Croatia.
CROWE, M., O’ SULLIVAN, M., NUNN, J.H., MCGRATH. 2014. Maternal and Child Psychosocial Factors associated with Dental Problems During Early Childhood. Growing Up in Ireland Sixth Annual Research Conference.
CROWE, M., O’ SULLIVAN, M., MCGRATH, C., CASSETTI, O. & O’ SULLIVAN, A. 2015. Diet, Dental Problems and Obesity in 3 year old Children in Ireland: Classification and Regression Tree Analysis of selected independent variables. Growing Up in Ireland Seventh Annual Research Conference. CROWE, M., O’ SULLIVAN, M., CASSETTI, O. & O’ SULLIVAN, A. 2016. Links between diet, dental and weight problems in 3-year-old children? Irish Division, Annual Scientific Meeting of the International Association for Dental Research. University College, Cork.
CROWE, M., O’ SULLIVAN, M., CASSETTI, O. & O’ SULLIVAN, A. 2016. Data mapping to augment dietary intake values from a nutritional database to a national cohort survey: protocols to improve quality of reported food intake (OCE3) doi: 10.1017/S0029665116002032. Nutrition Society Summer meeting- New technology in Nutrition research and practice, Joint British and Irish Conference, University College Dublin.
CROWE, M., O’ SULLIVAN, M., CASSETTI, O. & O’ SULLIVAN, A. 2016. Combining nutritional data from two surveys to augment dietary intake estimates. Growing Up in Ireland Eighth Annual Research Conference.
presentation. UCD Childhood and Human Development Research Centre Launch, CHD-RC, University College Dublin.
CROWE, M., O’ SULLIVAN, M., CASSETTI, O. & O’ SULLIVAN, A. 2016. Combining data from a nutritional database to a national cohort survey using a data mapping protocol. Poster presentation, Faculty of Health Sciences Research Meeting, Trinity College, Dublin.
CROWE, M., O’ SULLIVAN, M., CASSETTI, O. & O’ SULLIVAN, A. 2017. Cariogenic food and drink consumption and dental problems in 3 and 5-year olds in the GUI Infant Cohort. Growing Up in Ireland Ninth Annual Research Conference.
Journal Publications
CROWE, M., O’SULLIVAN, A., MCGRATH, C., CASSETTI, O., SWORDS, L. & O’SULLIVAN, M. 2016. Early Childhood Dental Problems Classification Tree Analyses of 2 Waves of an Infant Cohort Study. JDR Clinical & Translational Research, 1, 275-284.
CROWE, M., O’ SULLIVAN, M., CASSETTI, O. & O’ SULLIVAN, A. 2017. Weight Status and Dental Problems in Early Childhood: Classification Tree Analysis of a National Cohort. Dentistry Journal, 5, 25.
CROWE, M., O’ SULLIVAN, M., CASSETTI, O. & O’ SULLIVAN, A. 2017.Data mapping protocols to augment reported food intake. Submission March 2018, Frontiers in Nutrition, Nutrition Methodology.
Chapter 1. Introduction
1.1. General Introduction
Although dental caries is a diet mediated disease there is a recognised need for more studies investigating the complex relationship between diet and dental caries in the context of the child’s living environment and especially focussing on modifiable risk factors (Wagner and Heinrich-Weltzien, 2017, Lee and Divaris, 2014, Casamassimo et al., 2014). It has been argued that for preschool children, in particular, the mechanisms for understanding how dietary intake affects ECC risk are poorly understood (Amezdroz et al., 2015, Johnson et al., 2016) and that most of the data relating to risk or protective factors have accumulated from cross sectional studies or from older child cohorts (Johnson et al., 2016, Gussy et al., 2016).
The global burden of dental disease and the urgent need to continue to untangle the complex nature of behavioural and physiological risk factors and socioeconomic determinants has been highlighted recently as crucial for reducing disease burden (Dye, 2017). The rapid growth of data science suggests that all health care disciplines need to be aware of these developments and integrate new data analysis techniques when addressing research questions (Wickham and Grolemund, 2016, Khoury et al., 2013). In epidemiology and population health, this impacts on academic training, knowledge integration, expertise and implementation of “Big Data” science, bioinformatics and other emerging technologies (Khoury et al., 2013). To advance population oral health the translation of knowledge discovery in these areas will still require an improvement of more upstream factors such as social determinants of health (Casamassimo et al., 2014).
Table 1.1. Selected International Child Cohort Studies.
Growing Up in Australia: The Longitudinal Study of Australian Children” (LSAC)
http://www.growingupinaustralia.gov.au/
Millennium Cohort Study (UK) http://www.cls.ioe.ac.uk
Growing Up in New Zealand (GUiNZ)
http://www.growingup.co.nz/en.html
Growing Up in Ireland (GUI) http://www.esri.ie/growing-up-in-ireland/
Large national longitudinal child surveys have attracted significant funding in recent years in many “developed countries” and provide a rich source of scientific data in multiple domains including health, wellbeing and nutrition. As many countries do not carry out regular national oral health surveys, which are resource intensive, combining oral health variables within these wide-domain child cohort surveys is a useful approach to interdisciplinary research within the framework of strong conceptual models of oral health (Divaris, 2016, Fisher-Owens et al., 2007, Kim Seow, 2012, Dye, 2017).
Using a data science approach to epidemiologic cohort analysis could yield valuable insight into multilevel interactions between variables and enable assessment of the contribution of each in causal models. Developing a predictive model for dental disease will require more longitudinal studies, high quality data measures and selection of the most suitable data-driven or investigator defined techniques (Divaris, 2016, Krebs-Smith et al., 2015, Harris et al., 2004).
The aim of this thesis was to utilise data analysis techniques, particularly decision tree methods, data mapping and association analysis, to explore multilevel interactions among key aspects of child and primary caregiver (PCG) psychosocial, behavioural and physical health affecting dental problems in a large national cohort of Irish preschool children. A specific emphasis was placed on investigating the role of diet as a common risk factor for weight status in the children and using meal association analysis to understand the pattern of cariogenic food intake. It was intended to explore the role of significant risk indicators in the context of previously published conceptual models for child oral health and development.
1.2. Dental problems in preschool children
1.2.1.
Overview
in attempting to integrate oral and general health policy and research strategies has, arguably, hampered efforts to prevent oral diseases (Lee et al., 2016, Sheiham, 2005, Jin et al., 2016). The lack of robust epidemiological data in the EU has also not assisted efforts to compare the current state of oral health across different countries and facilitate planning and resource allocation (Patel, 2012). In most countries, reliable and accurate data on the oral health-related problems and behaviours of children less than 5 years of age (preschoolers) is scarce. As with other chronic diseases, the early childhood dental problems are often neglected until later in the life-course when their sequelae are more expensive to treat and may have already caused significant social, psychological and emotional damage (Dye et al., 2010, Wagner and Heinrich-Weltzien, 2017).
Despite decades of reductions in dental caries levels ECC is a pandemic disease worldwide (Spencer, 2012, Bagramian et al., 2009, World Health Organization, 2017b). The prevalence of ECC is estimated to range from 12% to 70% depending on the population (Declerck et al., 2008, Gussy et al., 2016, Dye et al., 2015, Bourgeois and Llodra, 2014) with the highest rates occurring among those in immigrant and lower socioeconomic groups (Public Health England, 2013b, Dye et al., 2010).
There is a distinct lack of high quality data to describe the distribution of ECC in Ireland at a national level. A recent summary by O’Connell and Harding (2017) of the limited data from small sample size studies is shown in Table 1.2. The most notable outcome in those studies is that children with a lower socioeconomic status had higher mean d3vcmft (decayed missing or filled primary teeth at visible, cavitated or non-cavitated, dentinal caries level) than those from a higher socioeconomic background and that ECC levels in those with disabilities was low when compared with that found in the general population.
In the last National Survey of Children’s Dental Health (sampling occurred between 2001 and 2002), it was reported that 37% of 5-year-olds in fluoridated areas and 55% in non-fluoridated areas had experienced decay, i.e. they have one or more teeth that were decayed, filled or extracted as a result of decay (Whelton et al., 2006). Approximately 42% of children at 5 years of age had experienced dentinal caries and had a mean d3vcmft of 1.3.
Table 1.2 Summary of studies reporting caries in pre-school children in Ireland.
Authors Sample % children with caries*
Holland, Houlihan and O’Mullane 1988
Pre-school children mean age 45
months (29 – 55 months) 38%
O’Connor 1996 Playschool children (mean age 4.1 yrs) 36% Fluoride group, 26% Non-Fluoride group
Tuohy 2000 3-year old healthy children 27.4%
41.5% Medical card 18% Non-Medical card
O’Connell et al. 2010
Children born small for gestational age (age 4-7 years)
53%
Happy teeth
(baseline) 2013 Disadvantaged pre-school children n = 233 18.5%
Sagheri,
McLoughlin and Nunn 2013
Children with disabilities >4 years old, n=337
Age 3 = 0% Age 4 = 18.2% Age 5 = 24.6% Stapleton 2015 Children with disabilities age 0-6
years, n = 178
Age 3 = 0%
Source: Adapted from O’Connell and Harding (2017).
* Caries recorded at the dentine level, with or without cavitation (d3vcmft)
The last National Survey of Children’s Dental Health in Ireland indicated that approximately 83% of dentinal caries present in 5- year olds was untreated (Whelton et al., 2006). Consequently, it is more usual for most preschool children with extensive ECC to attend for emergency care which often results in dental extractions and sometimes requires hospitalisation for general anaesthesia (Smith et al., 2014, Slack-Smith et al., 2009, O’Connell and Harding, 2017). One of the key recommendations of the report from the ‘WHO expert consultation on public health intervention against early childhood caries’ was to include the three-year-old age group as one of the index ages recommended for population surveys in the next edition of WHO’s Oral health surveys: basic methods (World Health Organization, 2017b).
VicGeneration (VicGen) study of an Australian oral health birth cohort are much needed to develop a solid understanding of risk and protective factors for the development of ECC (Gussy et al., 2016, Johnson et al., 2016). Child oral health research should be integrated within other health and development research frameworks to fully elucidate any common risk factors and causal pathways (Casamassimo et al., 2014, Divaris, 2016, Lee and Divaris, 2014).
1.2.2.
Natural history of ECC
as cariogenic food and drink) and protective factors (such as tooth brushing with fluoridated toothpaste) (Gussy et al., 2016). These findings and others from studies of early life feeding behaviours (Chaffee et al., 2015) emphasise the importance of preventive and behavioural interventions at this critical period of development to change the life-course trajectory of dental problems.
1.2.3.
Risk
factors
and
interdisciplinary
approaches
1.2.3.1. Terminology
The Rose hypothesis suggested that as long as disease risk is widespread, then adopting measures that decrease risk for everyone is more effective in reducing disease burden than taking a ‘high risk’ approach, in which measures are targeted only to those individuals with a substantially increased risk for disease (Rose, 1992). A combination of both the “high risk strategy” and population oral health approaches has been adopted by many countries, but some have argued that measures for identifying the high-risk subgroup in a population are neither sufficiently accurate or reliable (Tickle and Milsom, 2008, Hausen, 1997). However, to advance the potential of both approaches in ECC risk assessment key steps are required which include large longitudinal cohorts with high-quality clinical examinations, valid preclinical disease markers and rigorous predictive modelling (Divaris, 2016).
1.2.3.2. Food and drink factors and oral health
A clearer understanding of how modifiable and non-modifiable factors affect oral health problems is necessary so that appropriate intervention policy and strategies can be developed to maximum effect. (Leong et al., 2013, Chi et al., 2017, Chankanka et al., 2015). Much of the early research in ECC focused only on the contribution of cariogenic food and drink to the aetiology and prevention of lesions (Gussy et al., 2006, Leong et al., 2013). While the availability of refined carbohydrate is required for ECC to occur there is now an increased understanding of the interactions between other biological, behavioural and psycho-social risk factors. The potential cariogenicity of frequently provided human milk or infant formula or cow’s milk given in a bottle is controversial (Leong et al., 2013, Gussy et al., 2006, Harris et al., 2004). The current evidence indicates that breastfeeding up to 1 year of age is associated with a reduction in dental caries risk while there may be an increased risk of ECC with on-demand breast feeding or nocturnal feeding and sleeping with the breast in the mouth (Tham et al., 2015). While the addition of sugars in bottle feeding is strongly associated with ECC the lack of good quality studies and control of confounding factors suggests that further research is required to inform feeding guidelines (World Health Organization, 2017b, Gussy et al., 2016).
1.2.3.3. Interdisciplinary factors
multidisciplinary approach although the VicGen study is an example of one which has measured maternal and child health, oral health related behaviours, behaviours, attitudes, knowledge, socio-demographics and diet, carried out oral assessments and taken saliva samples to determine the microbiome (Johnson et al., 2016).
1.2.3.4. Prevention of ECC and the common risk factor
In the early preschool stage of development, the infant is totally reliant on the mother or PCG in determining the dietary intake, oral hygiene behaviours and health care needs of the child (Wagner and Heinrich-Weltzien, 2017). Even in the first year of life the infant vertical transmission of oral cariogenic bacteria can occur in the pre-dentate stage and play an important role in development of dental caries while protective maternal interventions such as healthy eating habits and regular toothbrushing with fluoridated toothpaste can reduce the risk of ECC (Leong et al., 2013). Early intervention is crucial to establish good oral hygiene and dietary practices, especially as studies have reported that consumption of “unhealthy” or discretionary choice foods and beverage is higher than the recommended guidelines in 20-49% of children even before 3 years of age (Amezdroz et al., 2015, Crowe et al., 2017). While dental caries can be arrested and, under the appropriate conditions, even reversed in its early stages, it is often allowed develop further by inappropriate feeding practices and significant infection with cariogenic bacteria (mutans streptococci) (Gussy et al., 2006, Johnson et al., 2016, Chaffee et al., 2015). Other risk factors for ECC include genetics, saliva, enamel hypoplasia, oral hygiene behaviour and family environment (Gussy et al., 2006, Kim Seow, 2012). While dental plaque and poor toothbrushing habits are strong risk factors for ECC (Meurman and Pienihäkkinen, 2011, Gussy et al., 2006, Harris et al., 2004) baseline experience of dental caries is still the single most important predictor of future caries experience (Gussy et al., 2006, Harris et al., 2004).
of fluoride. Clearly, current strategies to prevent ECC have not been fully successful (Harris et al., 2004) and adopting the common risk factor approach and integrating interdisciplinary aspects of managing risk factors within primary health care is needed (World Health Organization, 2017b).
Many of the steps to progress the development of valid and efficient predictive modelling of ECC are already well elucidated by other researchers (Divaris, 2016, Casamassimo et al., 2014). A clear understanding of the differences between “ECC risk assessment at the population level and ‘precision dentistry’ at the person level and personal” is required to advance these steps (Divaris, 2016).
1.3. Conceptual models of child oral health
1.3.1.
Overview
The development of strong conceptual models for children’s oral health in recent years has been a feature of dental epidemiology in researching multilevel factors that can have an impact at the early life stage and throughout the life course (Nicolau et al., 2007, Ben-Shlomo and Kuh, 2002, Fisher-Owens et al., 2007). The role of social and behavioural factors in developing ECC has become more evident in the last decade (Ismail et al., 2009, Ismail, 2003, Finlayson et al., 2007, Reisine et al., 1994). Similarly, research in child health and development has focussed on broader bioecological models with the child at the centre of a complex, multi-layered, interconnected, environmental system which influences child development. “The bioecological model, together with its corresponding research designs, is an evolving theoretical system for the scientific study of human development over time” (Bronfenbrenner and Morris, 2007). Upstream factors such as family functioning (Castilho et al., 2013, Duijster et al., 2013b, Duijster et al., 2013a), social class (Gibson and Williams, 1999, Boyce et al., 2010), parental influences (Renzaho and Silva-Sanigorski, 2013, Hooley et al., 2012b) and psychosocial factors (Quinonez et al., 2001b, Reisine et al., 1994, Finlayson et al., 2007) have all been studied in relation to child dental health. Recent commentaries (Lee and Divaris, 2014, Sniehotta et al., 2017, Divaris, 2016) have highlighted the need for an integrated multidisciplinary approach to population-based health/oral health research rather than individually examining the effects of upstream or downstream risk factors (Krieger, 2008).
based on repeated collection of comprehensive survey data, including oral health assessments, of the VicGen birth cohort over an eight year period (Johnson et al., 2016). This type of causal pathway should allow for a predictive modelling approach to determine the contribution of the relevant risk factors on child oral health.
Figure 1.1 The VicGeneration Causal Model of child, family and community influences on oral health outcomes for children. Amended from Johnson et al. (2016).
importance of “transforming epidemiology for 21st century medicine and public health” and highlighted the need to focus on interdisciplinary collaboration, greater access to data to ensure reproducibility, expand cohort studies across the lifespan and integrate “big data” science into epidemiological practice. The report also recommended the promotion of cross-study best practices for managing datasets and development of novel analytic strategies.
1.3.2.
National child surveys
There is, currently, no national data in Ireland on early childhood dental health and the last national dental survey, which only included children five years of age and older, was carried out 15 years ago (Whelton et al., 2006). Few countries have measured or surveyed dental related measures or outcomes at a national level for preschool children. However, many countries have developed and funded national cohort surveys and most of these have included some oral health related measures. Some (e.g. LSAC) have also carried out subgroup clinical examinations or nested studies within the cohorts (Wake et al., 2014). Some of these nested studies include a wide range of physical health measures and biosamples which can be stored for biochemical, genetic and epigenetic analysis. As mentioned earlier, preschool children have not been previously included in national oral health surveys in Ireland. In recent years one of the best opportunities for capturing nationally representative data on oral health related measures such as diet, oral hygiene and dental problems in preschool children derived from cohort surveys such as GUI (Quail et al., 2011, Murray et al., 2013) (http://www.esri.ie/growing-up-in-ireland) and the National Preschool Nutrition Survey (NPNS) (Irish Universities Nutrition Alliance, 2012) (http://www.iuna.net).
1.3.3.
Growing Up in Ireland
research project ever carried out in the state. Key outcome domains include physical health and development and socioemotional well-being (Williams et al., 2013). GUI is a national longitudinal study following the progress of two groups of children: the Child Cohort includes 8,500 nine-year-olds; and the Infant Cohort includes 11,000 nine-month-olds born in the Irish Republic who participated in the study at 9 months, 3 years and 5 years of age (Figure 1.2) (http://www.growingup.ie). The study is being carried out by a group of researchers led by the Economic and Social Research Institute (ESRI) and Trinity College Dublin (TCD). Funding is provided by the Department of Children and Youth Affairs in association with the Department of Social Protection and the Central Statistics Office. GUI began in 2006 and currently the members of the infant cohort are 10 years old while those of the child cohort are approximately 20 years old.
Figure 1.2 Infant Cohort Longitudinal Sample, Growing Up in Ireland Survey. Note: 11,134 questionnaires issued at Wave 2; 10,587 issued at Wave 3. Questionnaires not completed at Wave 2= 794; not completed at Wave 2 but included in Wave 3=289.
The study emphasises the bioecological approach to understanding child development which places the child at the centre surrounded by multiple influencing layers that include the child’s characteristics, family, neighbours and community services that occur over time (Figure 1.3) (Bronfenbrenner and Morris, 2007).
Figure 1.3 Bronfenbrenner’s Bioecological Model of Human development. Amended from Garbarino (1982).
[image:46.595.163.548.242.628.2]GUI has concentrated on three main aspects of child development: • Physical health and development
• Social, emotional and behavioural well-being • Educational achievement
From the perspective of examining oral health issues, a key strength of this nationally representative study is the multidisciplinary nature of the data collected. The dataset contains a comprehensive range of measures related to both parents and children concerning general, psycho-social and behavioural health. The themes of the health domain included: Pregnancy / pre-natal care; Child’s birth; Child’s health/healthcare utilisation; Child’s nutrition/diet/ breastfeeding; Child’s physical activity levels/exercise; Child’s physical development; Physical measures and Parental health and lifestyle.
In the infant cohort, questions related to the child’s oral health included dental problem visits, oral behavioural habits including frequency of tooth brushing and how often the child sucked a soother or finger/thumb at 9 months of age and accessing dental care at 5 years of age. Information relating to diet was also collected using a food frequency questionnaire. Other measures included global health rating, detailed data on breastfeeding, illness/hospital attendance, socio-demographics and psycho-social variables including temperament and behaviour. The only physical measures taken were the length and weight of the infant. There are multiple publications arising from this cohort including investigations of infant feeding (Castro et al., 2015, Castro et al., 2014) and obesity (Layte et al., 2014a).
1.3.4.
National Preschool Nutrition Survey
(NPNS)
information on nutrient intake, food safety, informed food policy and development of food based dietary guidelines. National dietary surveys among preschool children are necessary for understanding and describing food consumption patterns and nutrient intake and allow identification of consumption that does not meet recommended dietary goals (Gibney and Wolmarans, 2004). The NPNS also collected anthropometric measures and information related to child health and lifestyle.
1.4. Diet, obesity and dental health- the
common risk factor approach
Oral health is inextricably linked with general health, especially with self-reported health status (Lee et al., 2013, Sheiham, 2005, US Department of Health and Human Services, 2000, Fisher-Owens et al., 2007). Poor nutritional behaviours established in preschoolers are associated with an increased risk of obesity and dental caries that can affect the individual throughout the life course (World Health Organization, 2002, Kuh et al., 2003).
(less than 5 years) have not previously been included in national dental surveys. Given the relatively sparse studies of obesity in preschool children globally it has been suggested that population surveys of this age group are urgently required to both assess prevalence of overweight and obesity and also attempt to identify potential patterns and susceptibility of subgroups (Wake et al., 2007).
The primary caregiver (PCG) plays a key role in facilitating prevention of both obesity and ECC through feeding patterns and other behaviours in the preschool period (Wake et al., 2008, Pine, 2013, Gussy et al., 2006, Dye et al., 2004, Chaffee et al., 2015). Obesity and dental caries share some common risk factors such as food choice, patterns of dietary intake, poor quality diet and socioeconomic factors such as education level of PCG and household income (Marshall et al., 2007b, Kantovitz et al., 2006, Sheiham and Watt, 2000, Watt and Sheiham, 2012). Dental caries and weight status are diet-related, and patterns of nutritional behaviours are established in early life (Wake et al., 2007, Chaffee et al., 2015). However, very few epidemiological studies have reported anthropometric and dental health measures of preschool children, despite the fact that both early childhood obesity and dental caries are strong predictors of these respective conditions throughout the life course (Dye et al., 2015, Wake et al., 2007).
Rothman et al., 2008, Goodson et al., 2013). Recently, there appears to be an increasingly controversial focus in identifying sugar as the primary cause of obesity and a significant contributing factor to many non-communicable diseases in the so-called “developed” world (Lustig et al., 2012, Stanhope, 2015, Pereira, 2006). It is generally accepted that excess caloric intake from any macronutrient can lead to conditions such as overweight and obesity. However, the current controversy relates to the argument that dietary sugar is uniquely toxic and addictive and an independant cause of obesity (Lustig et al., 2012, Bray and Popkin, 2014) while others have argued that obesity and overweight continue to increase in countries where, at the same time, there have been substantial declines in sugar consumption (Barclay and Brand-Miller, 2011, Brand-Miller and Barclay, 2017).
Interestingly, there have been few reports on the oral health status of underweight children and it is uncertain whether they have a low caries risk (Tramini et al., 2009). It has been suggested that dental caries risk factors for underweight children needs to be assessed independently and not included in the “normal” weight category (Hooley et al., 2012a). There is some evidence to suggest that dental caries may be associated with children who are underweight and suffer with slow growth due to pain on mastication (Wagner and Heinrich-Weltzien, 2017, Hooley et al., 2012c, Sheiham, 2006, Tramini et al., 2009). This may inhibit growth hormone release via pain inducing altered sleep patterns and increased glucocorticosteroid secretion, (Vania et al., 2011) the effects of which may be further heightened by undernutrition due to an inability to chew more healthy foods (Gussy et al., 2006).
were mainly compiled using cross-sectional data it was not possible to conclude if “an individual who is overweight or obese is at higher risk of dental caries or vice-versa” (Public Health England, 2015a).
Given the associations that exist between oral health and general health (Sheiham, 2005, Pine, 2013) there is growing interest in utilising a common risk factor approach to investigate the multidimensional causes of dental and weight status problems, particularly in preschool children (Vania et al., 2011, Hooley et al., 2012a, Hooley et al., 2012c, Hayden et al., 2012, Costacurta et al., 2014, 2015a). The main focus of what is described as the “common risk factor” approach is to control a small number of overlapping or shared risk factors between chronic diseases by promoting general health and thus exert a greater, more efficient, impact than disease specific approaches (Sheiham and Watt, 2000).
The Global Burden of Disease (GBD) study has indicated that the transition of less developed countries to more economically developed, will also result in an increase in chronic disease while infectious disease declines. The only feasible long-term strategy for global oral health “must focus on health promotion and disease prevention, through controlling the modifiable common risk factors” (Jin et al., 2016). It is vitally important to identify common risk factors to accelerate future oral health research targeted at prevention of ECC and childhood obesity (Chi et al., 2017, Divaris, 2016, Watt and Sheiham, 2012). Using a common risk factor approach to address both conditions is sensible as long as the evidence for the role of sugar in causing obesity is convincing (Watt and Sheiham, 2012). As highlighted by Dye (2017), the “epidemiological transition” will impact on oral health globally as oral diseases share common risk factors such as an unhealthy diet with other non-communicable diseases (NCDs).
1.5. Cariogenic food and drink
1.5.1.
Overview
World Health Organization, 2017b, Kassebaum et al., 2015). The carious process occurs through the metabolism of fermentable dietary carbohydrates at the plaque-biofilm interface resulting in localised demineralisation and destruction of hard dental tissues over time (Selwitz et al., 2007, Bradshaw and Lynch, 2013). While evidence describing the impact of nutrition intervention during crucial growth periods is well established (Bhutta et al., 2013), it appears to be surprisingly little known that the early stages of dental caries can be halted and potentially reversed (Selwitz et al., Lingström, 2009, Moynihan and Petersen, 2004) and that food intake patterns play a key role in dictating the progression or reversal of the disease (Moynihan and Kelly, 2014, Gussy et al., 2016, Chaffee et al., 2015, Tinanoff et al., 2002).
In a sufficient-cause model (Rothman et al., 2008) dental caries cannot occur without consumption of CF, especially sugar, and it is generally accepted that this is a ‘necessary cause’ of dental caries (Tinanoff et al., 2002, Sheiham and James, 2015). However, despite improvements in understanding many of the proximal and distal determinants of ECC, (Selwitz et al., 2007, Divaris, 2016, Fisher-Owens et al., 2007) an observation made more than 50 years ago remains valid today: “no one yet knows the precise nature of dental caries and all of the ramifications of the consumption of carbohydrates that influence caries” (Peterson, 1963). While some studies have explored the relationship between the pattern of consumption of CF and dental caries in young children (Chaffee et al., 2015, Dye et al., 2004, Johansson et al., 2010, Marshall et al., 2005, Llena and Forner, 2008, Hooley et al., 2012b) detailed understanding of the frequency, amount and pattern of intake of CF in preschool children is still limited (Marshall et al., 2005, Dye et al., 2004, Chankanka et al., 2015, Moynihan and Kelly, 2014). While a wide range of risk indicators have been found to be associated with ECC such as a cariogenic diet, poor oral hygiene, low fluoride exposure, inappropriate feeding methods, poor parental education and household income, very few studies have looked at risk factors using the appropriate longitudinal study design and validated dietary instruments (Hooley et al., 2012b, Harris et al., 2004, Selwitz et al., 2007).
childhood (Fisher et al., 2015). While infants are born with an innate preference for sweet taste (Stephen et al., 2012) there is strong evidence to suggest that learning to develop a liking for “healthy” foods is modifiable early in life (Mennella, 2014). The early introduction of CF can foster a long-term pattern of preference for the consumption of CF (Marshall et al., 2007a) and also increase the virulence and levels of cariogenic bacteria such as mutans streptococci and lactobacili (Marsh, 2006, Chaffee et al., 2015). However, this is also a crucial period where the deleterious effects of a cariogenic diet could be modified by the plaque disrupting beneficial effects of toothbrushing with fluoridated toothpaste and exposure to fluoridated water (Gibson and Williams, 1999, Harris et al., 2004, Gussy et al., 2006, Gussy et al., 2016). Children with a history of snacking once or more per day or who consumed sweets a minimum of once a day have higher rates of dental caries (Abreu et al., 2015, Bonotto et al., 2017). Bonotto et al (2017) recently found that snack limits established by parents were associated with a lower prevalence of untreated dental caries in preschool children. Obviously, the parent or primary caregiver largely controls the amount and frequency of food the preschool child may consume. Given that food and drink items consumed between the traditional main meal patterns typically contributes more than 25% of the daily energy intake of preschoolers it is surprising that the determinants of snacking at this age are not well established (Fisher et al., 2015, Jacquier et al., 2017).
sucrose exposure on the cariogenicity of a biofilm-caries model and concluded that even one daily exposure to sugar can initiate a carious lesion. Although confirmation would require clinical trials to account for other protective factors such as saliva, the results suggested that higher exposure to sugar increases the acidogenicity and virulence of the Streptococcus mutans biofilm in a frequency-dependant manner. Establishing what the threshold is for the number of “exposures” and/or frequency of intake of CF per day to induce ECC is difficult but has obvious implications for health education and advice on caries risk. Other factors affecting cariogenicity include the physicochemical properties of the food item (e.g. texture, stickiness), sequence and timing of consumption, duration in the mouth and physical and chemical interactions with other food components (Moynihan, 2002, Marshall et al., 2005, Lingström, 2009, Bradshaw and Lynch, 2013).
In nutritional epidemiology there has been considerable focus, and controversy, on the role of “unhealthy” and “high- sugar” food and beverages in relation to obesity (Hall et al., 2015, Erickson et al., 2017, Erickson and Slavin, 2015b, Farpour-Lambert et al., 2015, Hu, 2013, Lustig et al., 2012) but comparatively little emphasis on assessing if the pattern of consumption of CF can be further defined to optimise dietary advice and reduce the risk of ECC (Johansson et al., 2010, Marshall et al., 2005, Amezdroz et al., 2015, Chaffee et al., 2016). People tend to consume combinations of food items as snacks or main meals rather than individual nutrients (Leech et al., 2015) and recent research has focussed on meal composition and eating patterns to explore diet-disease relationships (Faber et al., 2013, Golley et al., 2017). There are many obstacles to investigating consumption patterns of preschool children including instrument selection, proxy reporting and seasonal variations in consumption (Magarey et al., 2011). Even accepting the limitations of measuring food intake in young children there is no universal, standardised method for reporting the data and comparisons between studies can be very difficult (Faber et al., 2013). Instrument selection and study design can impact on the quality of data collected and interpretation of results is often dependant on how the data is reported. For example, Faber commented that a study on young children in South Africa sugar was ranked 17th based on the total amount consumed yet 3rd based on most frequently consumed (Faber et al., 2013).
tool for use in the dental setting (Arheiam et al., 2016a,