Abstract - The performance of a laboratory-scale aerobic sequencing batch reactor based on COD removal and hydraulic retention time (HRT) was assessed in this study. The wastewater used for the experiment was brewery wastewater from a local brewery. The reactors were operating under continuous low oxygen dosing concentration and cyclic aeration schemes. The performance of the SBRs on optimum HRT was analyzed in terms of COD removal. The generated data showed that treatment efficiencies in terms of COD and BOD were 94 % and 85 % respectively for the reactor operated under continuous aeration configuration while 81 % and 65 % was achieved respectively for the reactor operated in cyclic aeration. Therefore, this study has established that the performance of the reactor under the continuous aeration scheme was more effective than the one operating in cyclic configuration. This has also statistically exhibited significant difference from the performance of the reactor working under cyclic aeration.
Index Terms: Sequencing Batch, Reactor, Hydraulic Retention Time, Biological Oxygen Demand, Chemical Oxygen Demand and Laboratory-scale.
I. INTRODUCTION
HE discharge of industrial effluent has caused many issues that have risen in environmental pollution causing the alteration of the surface water, plant and soil. The wastewater treatment industry faces many challenges such as increasing energy costs and the presents of organics and heavy metals. These aspects are becoming more critically investigated. Also, there are aspects such as the depletion of resources, the increasing water demand and its conservation, the management of freshwater water resources as well as more stringent regulations on disposal and environmental management that require more attention to regulate the issue
Manuscript received July 30, 2017. This work was supported in part by the Research Department of Faculty of Engineering in Mangosuthu university of Technology, South Africa.
Khaya Pearlman Shabangu is with 1Faculty of engineering, department of Chemical Engineering, Mangosuthu University of Technology, P.O. Box 12363 Jacobs, Durban 4026, South Africa, and Email: [email protected].
Babatunde Femi Bakare is with 1Faculty of engineering, department of Chemical Engineering, Mangosuthu University of Technology, P.O. Box 12363 Jacobs, Durban 4026, South Africa, and Email: [email protected].
of wastewater and related pollution. Also, wastewater can be considered as a resource than as a waste with recovery possibilities for clean water, energy and various materials satisfied by novel approaches and emerging technological development (Ronald, 2005). According to Driessen (2003) during the last 20 years environmental awareness of the brewing industry has grown significantly leading to increasing investment in environmental protection measures. Important internal drivers for the brewing industry are implementation of environmental management systems (EMS) like ISO 14001 as well the need for conducting of benchmark studies for brewery process optimization. Knowledge about environmental emissions e.g. effluent quality and quantity) can become management information which may help to improve the efficiency of in-plant brewery processes (minimize product losses, spill of water and energy). Important external drivers for environmental investments are local legislation and environment taxation system (discharge levies). The overall result is growing interest within the brewery. Industry in environmental pollution controls systems. According to Driessen (2003), the quality and quantity of brewery effluent can fluctuate significantly as it depends on various processes that take place within the brewery raw material handling, wart preparation, fermentation, filtration, calf intestinal alkaline phosphate (CIP) and packaging. The amount of wastewater produced is related to the specific water consumption expressed as liters per hour of brewed beer. Organic compounds in brewery effluent (expressed as Chemical Oxygen Demand (COD) are generally easily biodegradable as these mainly consist of sugars, soluble starch, ethanol, volatile fatty acids. It is then represented by the relatively high BOD/COD ratio of 0.6 - 0.7. The brewery solids are expressed as total suspended solids (TSS) which mainly consist of spent grains, waste yeast and hot trub. Brewery effluent pH levels are mostly determined by the amount and type of chemicals used at the CIP units for example caustic soda, phosphoric acid, nitric acid. Brewery wastewater requires substantial removal of organic pollutants prior to discharge into receiving bodies to minimize environmental pollution. To accomplish the aim of this research study, the following objectives were investigated and considered: To evaluate the performance of the two laboratory scale sequencing batch reactors treating brewery wastewater based on different aeration schemes namely; continuous aeration scheme and cyclic aeration scheme. In line to the high organic content and high biodegradability of brewery wastewater, biological treatments are usually an appropriate treatment method
Khaya Pearlman Shabangu and Babatunde Femi Bakare, Member, IAENG
Study of an SBR Treating Brewery Wastewater:
Case of COD-HRT and BOD Removal
(Driessen and Vereijken, 2003, Enitan et al., 2015, Doubla et al., 2007). Biological treatment implicates the removal and maintenance of organic matter existent in wastewater using microorganism. Previous studies presented on brewery wastewaters contain the preparation of anaerobic treatment for brewery wastewater as its energy saving due to methane gas which is in turn used as a source of fuel for this process. This paper, the presentation of two laboratory scale aerobic sequencing batch reactors for the treatment of brewery wastewater was investigated.
II. EXPERIMENTALPROCEEDURE A. Materials and Methods
The wastewater used during the experimental phase was collected from a local brewery in Durban. Samples collected were kept in the cold room in the laboratory at 4 oC and analyses were conducted within 48 hours of sample collection. The acclimation was undertaken continuously with aeration at low oxygen dosing concentrations of about 7.5 L/min after inoculating with raw brewery. Microorganisms were acclimated for over 21 day’s period in a 5 L bucket. Acclimated microorganisms were used as the source of inoculum for subsequent biodegradation of batch runs in which carbon dioxide evolution was measured in the form of organic carbon as chemical oxygen demand (COD) and biological oxygen demand (BOD).
B. Experimental Set-up
There were two reactors operating in two different aeration schemes: one with cyclic aeration and the other with constant low-level aeration. Other than the aeration schemes, the reactors were identical. The reactor tanks were standardized at18 L with clear PVC tanks, with the bottom of each tank having a slope of 60 o. The HRT was conducted based on an experimental as per operation procedure. A daily working volume per batch was set at 13 L. Both reactors were seeded with 2.5 L of the heterotrophic mixed culture microorganisms. The drainage of the effluent after solids settling was done through two spigots added to the side of each tank. This is intended to reduce the scouring
during the removal of the supernatant. Tank drainage occurred manually by opening the spigot valve and collecting the desired volume of sample. Fig 1 demonstrates the piping and instrumentation design configuration of the SBR tanks.
C. Experimental Approach
The sequencing batch reactors are characterized by a series of steps or phases, each lasting for a specific period of time, in sequential manner as below: Filling was done to add substrate or wastewater into SBRs; the reaction purpose was done to complete the reactions that were initiated during filling phase. Drawing of the treated effluent, which is the supernatant that forms during the settling. Experimentation of the hydraulic retention time had to be conducted to experimentally determine the optimum treatment time. The experimental HRT and precise data was obtained in terms of COD biodegradation which presented a Hydraulic Retention Time of 5 days. A fixed sludge retention time (SRT) of about 28 days was implemented, a standard operating pH value of 6.0 ~ 9.0 were maintained though fluctuating due to the alkalinity of the microbial mass. Samples were analyzed using (Association, 1998) which include the following physicochemical parameters; pH, conductivity (CD). Data was entered into SPSS version 23 (Statistical Packages for the Social Sciences) for analysis. A value P < 0.05 was considered as statistically significant. Data analysis was initiated with a check of the data for outliers, missing data, and normality through skewness and kurtosis values that could affect relations between variables. A descriptive statistical analysis of the data such as means, standard deviations, ranges, frequencies, percentages and confidence intervals was initially conducted prior to conducting the multivariate analysis. The choice of these statistical parameters was undertaken to attain an efficient assessment of the different aeration schemes on the aerobic SBRs.
III. RESULTSANDDISCUSSIONS Variation of HRT and COD removal Efficiency
The effect of hydraulic retention time on the performance of the SBRs under different aeration scheme in-terms of COD removal is presented in Fig 2.
Fig.2: Variation of COD removal efficiency with HRT.(Shabangu et al.,
2016). HOLDING TANK
FEED VALVE FEED PUMP
SBR 2: ANOXIC REACTOR
SBR 1: AEROBIC REACTOR VALVE 9
VALVE 8
VALVE 6 VALVE 7
VALVE 5
VALVE 4
VALVE 2 VALVE 3 FEED STREAM
FEED LINE: 1 FEED LINE: 2
AIR SUPPLY
SAMPLE POINT: 2
SLUDGE REMOVAL POINT SAMPLE POINT: 1
AIR SUPPLY
SAMPLE POINT: 2
SLUDGE REMOVAL POINT SAMPLE POINT: 1
AERATION PUMP
TT TI
TT TI
SBRs P&ID BWW Treatment (SAB) 01/08/2016 By: K.P. Shabangu
Dr M Chetty Dr BF Bakare
As can be seen, the COD removal in terms of the hydraulic retention time in the continuous low aeration scheme (CON SBR1) was significantly different from the cyclic aeration scheme (CYC SBR2). A polynomial fit correlation constant R2 = 0.9281 for the continuous low aeration as compared to R2 = 0.9026 for the cyclic aeration schemes. The R2 values proved significant percentage COD removal fit in relation to the HRT between the two aeration configurations and the second order polynomial approximation. However, a similar trend in COD removal was reported during the experiment for both aeration configuration schemes as a function of the hydraulic retention time, as is shown in Fig 2. Upon viewing the experimental data; it appeared that the most significant difference in percentage COD removal was for HRTs 3 days and 4 days as is in Fig 2. Although, due to less percentage COD removal observed from HRT 5 days till 7 days, a supposition that optimum high strength organic removal was accomplished after 5 days was reached. The COD measurements carried out during all batch experiments were conducted in triplicate for accuracy check purposes. This was used to estimate the uncertainty and through standard error propagation rules. Hence as shown in Fig 3, at higher HRTs, there was more percentage COD removal. Perhaps it was perceived from the standard error bars that higher HRTs resulted to higher errors as well. It was hypothesized that this could be due to the sampling technique that was employed during experimentation even though the accuracy check was conducted in all measurements. The experimentations mode of operation as batch, and the aeration configuration could also contribute to the magnitude of error that increased with higher HRTs as presented in Fig 3. Therefore all batch experiments for both aerobic SBRs were conducted over 5 days HRT. This was perceived to avoid the magnitude of uncertainty levels in percentage COD removal with increased HRTs.
Fig.3: variation of COD and HRT within 7 batches runs.
Based on the data presented in Fig 3. it was established that the percentage for COD removal for the continuous aeration scheme (CON SBR1) are more significant compared to the cyclic aeration scheme (CYC SBR2). Therefore, further assessment of the (CON SBR1) was
DATA ON BATCH RUNS:CONTINUOUS AERATION HRT,COD,CODREMOVAL.
TABLEI:BATCH1
HRT
(Days) COD % REMOVAL
0 12315 0
1 8752 29
3 5620 54
4 3215 74
5 1520 88
6 523 96
TABLE II BATCH 2 HRT
(Days) COD % REMOVAL
0 15454 0
1 10013 35
3 6485 58
4 3324 78
5 1545 90
6 548 96
TABLE III: BATCH 3 HRT
(Days) COD % REMOVAL
0 12296 0
1 8548 30
3 6580 46
4 2504 80
5 1648 87
6 586 95
TABLE IV: BATCH 4 HRT
(Days) COD % REMOVAL
0 9472 0
1 6945 27
3 4521 52
4 2645 72
5 1542 84
6 654 93
TABLE V: BATCH 5 HRT
(Days) COD % REMOVAL
0 19568 0
1 13205 33
3 7584 61
4 3645 81
5 950 95
6 547 97
TABLE VI: BATCH 6 HRT
(Days) COD % REMOVAL
0 18006 0
1 12345 31
3 7458 59
4 3578 80
5 1052 94
6 348 98
TABLE VII: BATCH 7 HRT
(Days) COD % REMOVAL
0 14968 0
1 10455 30
3 6458 57
4 3641 76
5 1458 90
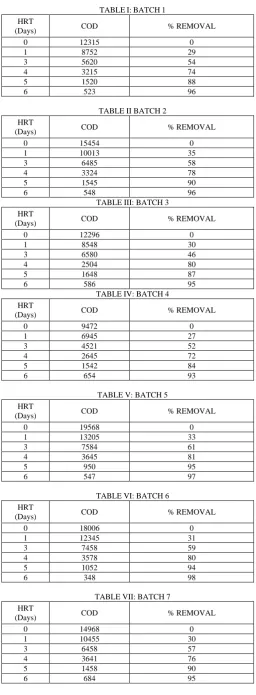
[image:3.595.306.563.65.762.2] [image:3.595.60.278.509.677.2]undertaken for another phase involving 7 experimental batch runs for maximum HRT of 7 days. Figure 3 represents the profile of these 7 batches conducted under continuous aeration. Tables I – VII denote the data generated during the trials. Day 0 represents the inlet COD, the remaining values of COD are the values recorded as the HRT is increasing. Analyzing these tables and Figure 3.2, it was found that the higher the HRT the higher the COD removal efficiency. However, day 5 was found to be the optimum HRT. This was obtained through a student T-Test analysis (P ˂ 0.05). This statistical significance was performed on between the HRT and percentage COD removal.
COD Mass balance
Tables VIII – IX presents the COD mass balance for CON SBR1 and CYC SBR2 based on the averages of all batch experiments. As is shown, the total input COD with 100 % basis before treatment in SBRs was an average of 0.126 kg. It was observed that after treatment in CON SBR1, an output of 0.007 kg, representing 6 % was achieved. This result stimulates the implication that a total COD mass of 0.119 kg representing 94 % was accrued in CON SBR1. This total biological organic pollutant in terms of COD accumulation was due to solids retention and biological degradation activity in CON SBR1. CYC SBR2 presented a total mass output of 0.023 kg, demonstrating 19 %. An accumulation of 0.103 kg, representing 81 %, was attained in this reactor, showing that most of the organic pollutants in terms of COD were removed through solids retention and a high level of biological degradation within the reactor. This result also inferred that COD removal was achieved through solids retention and biological degradation within CYC SBR2, as achieved in CON SBR1.
PRESENTS THE BOD MASS BALANCES FOR CON SBR1 AND CYC SBR2 (Shabangu et al., 2016).
TABLE VIII
Continuous Aeration SBR1 Material Balance
COD Input (kg)
COD Accumulation (kg)
COD Output Stream (kg)
0.126 0.119 0.007
% Removal
100 94 6
TABLE IX
Cyclic Aeration SBR2 Material Balance
COD Input (kg)
COD Accumulation
(kg)
COD Output Stream (kg)
0.126 0.103 0.023
% Removal
100 81 19
BOD Mass balance
As displayed, Table X and XI present the BOD mass balance for CON SBR1 and CYC SBR2 of overall batch averages. Both SBRs presented great significance in BOD removal. As presented, a total of 100 % BOD input before treatment in SBRs was 0.037 kg on mass basis. It was
observed that after treatment in the CON SBR1, an output of 0.007 kg was achieved representing 20 %. It was thus concluded that a total mass of 0.029 kg, demonstrating 80 % was accumulated in CON SBR1. This total biological organic pollutant accumulation was due to solids retention and the biological degradation activity in CON SBR1. CYC SBR2 showed a total mass output of 0.014 kg, representing 36 %. An accumulation of 0.023 kg, representing 64 %, was achieved in this reactor, proving that most of the organic pollutants in terms of BOD were removed through solids retention and biological degradation within the reactor.
TABLE X
Continuous Aeration SBR1 Material Balance
BOD Input (kg)
BOD Accumulation
(kg)
BOD Output Stream (kg)
0.037 0.029 0.008
% Removal
100 80 20
TABLE XI
Cyclic Aeration SBR2 Material Balance
BOD Input (kg)
BOD Accumulation
(kg)
BOD Output Stream (kg)
0.037 0.024 0.013
% Removal
100 64 36
Summary of independent samples T-Test performed on SPSS
SUMMARY OF INDEPENDENT SAMPLES OF BOTH CON SBR1 AND CYC SBR2 CHARACTERISTIC (Shabangu et al., 2016).
TABLE XII:
Characteristic CON SBR1 CYC SBR2 P-Value
COD (mg/L) 594 ± 621 1885± 1649 0.011
BOD (mg/L) 609 ± 424 1067 ± 775 0.050
In evaluating the performance of the two laboratory-scales sequencing batch reactors on treating brewery wastewater, an independent sample T-Test to match parameter levels between the two laboratory-scale SBRs was conducted. It was established that CON SBR1 had statistically significantly greater COD Removal (594 ± 624.1 mg/L) matched to CYC SBR2 (1885.2 ± 1649.1 mg/L), P ˂ 0.011. A better BOD removal on CON SBR1 of (608.8 ± 423.5 mg/L) related (1067.7± 1649.1 mg/L), P ˂ 0.057 was statically attained. The above statistical analysis performed on SPSS, CON SBR1 indicated better-quality organic pollutant removal competence than CYC SBR2.
IV. CONCLUSIONS
that the continuously aerated reactor had more capable biodegradation activity of the microbial mass due to oxygen abundance. Optimum HRT was achieved within 5 days of treatment time in both aeration schemes as is shown in Fig 2 and Fig 3. A firm assumption based on multiple experimentally conducted batch runs verified that there was high levels of uncertainty propagated by errors as the treatment time was prolonged. It was clearly established that 5 days HRT time was the optimum treatment time containing a more balanced level of uncertainty and errors. The results acquired through mass balances, also displayed that treatment efficiencies in terms of COD and BOD was 94 % and 85% respectively for continuous aeration configuration and 81 % and 65 % for the cyclic aeration scheme. SPSS analysis on mentioned parameters presented a strong significant difference between the two aeration configuration schemes, with a value of P ˂ 0.05. This was an indication that the continuous aeration reactor had better removal ability.
ACKNOWLEDGEMENTS
The authors wish to acknowledge the Research Directorate in Mangosuthu University of Technology, for the funding of this research work. Much thanks to Mr Joseph Bwapwa, for his valued involvement and assistance in the compilation of this paper.
REFERENCES
[1] ALVARADO-LASSMAN, A., RUSTRIÁN, E.,
GARCÍA-ALVARADO, M., RODRÍGUEZ-JIMÉNEZ, G. & HOUBRON, E. 2008. Brewery wastewater treatment using anaerobic inverse fluidized bed reactors. Bioresource Technology, 99, 3009-3015.
[2] ASSOCIATION, A. P. H. APHA. 1998. Standard methods for the
examination of water and wastewater, 20.
[3] ASSOCIATION, B. 2013. Water and Wastewater: Treatment/Volume
Reduction Manual. Brewers Association A Passionate Voice for Craft Brewers.
[4] BENNETT, T. A. 2007. Evaluation of Bench-Scale Sequencing Batch
Reactor Swine Waste Treatment Under Continuous and Cyclic Aeration.
[5] BENSTAALI, B., MOUSSA, D., ADDOU, A. & BRISSET, J.-L.
1998. Plasma treatment of aqueous solutes: some chemical properties of a gliding arc in humid air. The European Physical Journal Applied Physics, 4, 171-179.
[6] BLOOR, J. C., ANDERSON, G. & WILLEY, A. 1995. High rate
aerobic treatment of brewery wastewater using the jet loop reactor. Water Research, 29, 1217-1223.
[7] BRAEKEN, L., VAN DER BRUGGEN, B. & VANDECASTEELE,
C. 2004. Regeneration of brewery waste water using Nanofiltration. Water Research, 38, 3075-3082.
[8] BRIGGS, D. E., BROOKES, P., STEVENS, R. & BOULTON, C.
2004. Brewing: Science and Practice, Elsevier.
[9] CHAN, Y. J., CHONG, M. F., LAW, C. L. & HASSELL, D. 2009. A
review on anaerobic–aerobic treatment of industrial and municipal wastewater. Chemical Engineering Journal, 155, 1-18.
[10] CORSINO, S., CAMPO, R., DI BELLA, G., TORREGROSSA, M. &
VIVIANI, G. 2016. Study of aerobic granular sludge stability in a continuous-flow membrane bioreactor. Bioresource Technology, 200, 1055-1059.
[11] CRONIN, C. & LO, K. 1998. Anaerobic treatment of brewery
wastewater using UASB reactors seeded with activated sludge. Bioresource Technology, 64, 33-38.
[12] DAI, H. 2002. Carbon nanotubes: opportunities and challenges.
Surface Science, 500, 218-241.
[13] DOUBLA, A., LAMINSI, S., NZALI, S., NJOYIM, E.,
KAMSU-KOM, J. & BRISSET, J.-L. 2007. Organic pollutants abatement and biodecontamination of brewery effluents by a non-thermal quenched plasma at atmospheric pressure. Chemosphere, 69, 332-337.
[14] DRIESSEN, W. & VEREIJKEN, T. 2003. Recent developments in
biological treatment of brewery effluent. Proceedings of the 9th Brewing Convention, Victoria Falls, Zambia, Institute & Guild of Brewing Africa Section.
[15] DRIESSEN, W., YSPEERT, P., YSPEERT, Y. & VEREIJKEN, T.
2000. Compact combined anaerobic and aerobic process for the treatment of industrial effluent. Colombia-Canada: Solutions to Environmental Problems in Latin America.
[16] DWAF & RACTLIFFE, G. 2007. Berg River Baseline Monitoring
Programme. Final report-Volume1: Introduction to the Berg River Catchment; Groundwater and Hydrology. DWAF Report No. P WMA 19/G10/00.1707.
[17] DWAF, S. 2004. National Water Resource Strategy. Department of
Water Affairs and Forestry Pretoria.
[18] ENITAN, A. M., ADEYEMO, J., KUMARI, S., SWALAHA, F. M. &
BUX, F. 2015. Characterization of Brewery Wastewater Composition. World Academy of Science, Engineering and Technology, International Journal of Environmental, Chemical, Ecological, Geological and Geophysical Engineering, 9, 1015-1018.
[19] FAO, U. 2004. UNEP. 1994. Land degradation in south Asia: Its
severity causes and effects upon the people. World Soil Resources Report.1-3,200-216.
[20] FENG, Y., WANG, X., LOGAN, B. E. & LEE, H. 2008. Brewery
wastewater treatment using air-cathode microbial fuel cells. Applied microbiology and biotechnology, 78, 873-880.
[21] FERNANDES, L. 1994. Effect of temperature on the performance of
an SBR treating liquid swine-manure. Bio resource Technology, 47, 219-227.
[22] GOLDAMMER, T. 1999. The brewers' handbook, KVP Publishers.
[23] INCE, B. K., INCE, O., SALLIS, P. & ANDERSON, G. 2000. Inert
COD production in a membrane anaerobic reactor treating brewery wastewater. Water Research, 34, 3943-3948.
[24] IRVINE, R. L. & BUSCH, A. W. 1979. Sequencing batch biological
reactors: an overview. Journal (Water Pollution Control Federation), 235-243.
[25] IRVINE, R. L., KETCHUM JR, L. H. & ASANO, T. 1989.
Sequencing batch reactors for biological wastewater treatment. Critical Reviews in Environmental Science and Technology, 18, 255-294.
[26] JANG, H. M., LEE, J. W., HA, J. H. & PARK, J. M. 2013. Effects of
organic loading rates on reactor performance and microbial community changes during thermophilic aerobic digestion process of high-strength food wastewater. Bioresource Technology, 148, 261-269.
[27] KANAGACHANDRAN, K. & JAYARATNE, R. 2006. Utilization
potential of brewery waste water sludge as an organic fertilizer. Journal of the Institute of Brewing, 112, 92-96.
[28] KETCHUM JR, L. H., IRVINE, R. L. & LIAO, P.-C. 1979. First cost
[29] KIM, B., KALIS, E., FLORKEY, D., SWATSENBARG, S., LUCIW, L., BAILEY, C., GAINES, W., PHILLIPS, J. & KOSOKOWSKY, G. 1998. Evaluation of commercial ultrafiltration systems for treating automotive oily wastewater. Water Environment Research, 70, 1280-1289.
[30] LATIF, M. A., GHUFRAN, R., WAHID, Z. A. & AHMAD, A. 2011.
Integrated application of upflow anaerobic sludge blanket reactor for the treatment of wastewaters. Water Research, 45, 4683-4699.
[31] LE CLAIR, B. 1984. Performance monitoring program: Molson's
Brewery deep shaft treatment system. Proceedings of the Industrial Waste Conference, Purdue University (USA).
[32] LING, L. 1998. Brewery Wastewater Treatment Using Aerobic
Sequencing Batch Reactors with Mixed Culture Activated Sludge. University of British Columbia.
[33] LING, L., LO, K. V., LING, L. & LO, K. V. 1998. Brewery
wastewater treatment using suspended and attached growth sequencing batch reactors. Journal of Environmental Science and Health Part A, 34, 341.
[34] LIU, Y.-J. & SUN, D. D. 2011. Development of denitrifying granules
in sequencing batch reactors. Journal of Environmental Science and Health, Part A, 46, 518-525.
[35] MADAENI, S. & MANSOURPANAH, Y. 2006. Screening
membranes for COD removal from dilute wastewater. Desalination, 197, 23-32.
[36] MANKIEWICZ, R. 2000. The Story of Mathematics, Princeton
University Press.
[37] MATA, T. M. & COSTA, C. A. 2001. Life cycle assessment of
different reuse percentages for glass beer bottles. The International Journal of Life Cycle Assessment, 6, 307-319.
[38] MATSUMOTO, M., UMEDA, Y., MASUI, K. & FUKUSHIGE, S.
2012. Design for Innovative Value Towards a Sustainable Society: Proceedings of EcoDesign 2011: 7th International Symposium on Environmentally Conscious Design and Inverse Manufacturing, Springer Science & Business Media.
[39] METCALF, Eddy, B. 1991. Wastewater Engineering: Treatment.
Disposal, and Reuse. 3rd edition. McGraw Hill Higher Education.
[40] MEYERS, R. A. 1998. Environmental Analysis and Remediation.
Wiley Encyclopedia Series in Environmental Science, New York.
[41] MORGENROTH, E., SHERDEN, T., VAN LOOSDRECHT, M. C.
M., HEIJNEN, J. J. & WILDERER, P. A. 1997. Aerobic granular sludge in a sequencing batch reactor. Water Research, 31, 3191-3194.
[42] NEL, R. 2014. SABMiller: The Internationalization of a Brewing
Giant. University of Stellenbosch.
[43] PARAWIRA, W., KUDITA, I., NYANDOROH, M. & ZVAUYA, R.
2005. A study of industrial anaerobic treatment of opaque beer brewery wastewater in a tropical climate using a full-scale UASB reactor seeded with activated sludge. Process Biochemistry, 40, 593-599.
[44] PETRUCCIOLI, M., DUARTE, J. C., EUSEBIO, A. & FEDERICI, F.
2002. Aerobic treatment of winery wastewater using a jet-loop activated sludge reactor. Process Biochemistry, 37, 821-829.
[45] RAO, A. G., REDDY, T., PRAKASH, S. S., VANAJAKSHI, J.,
JOSEPH, J. & SARMA, P. 2007. pH regulation of alkaline wastewater with carbon dioxide: A case study of treatment of brewery wastewater in UASB reactor coupled with absorber. Bioresource Technology, 98, 2131-2136.
[46] RIS, C. 2007. US EPA health assessment for diesel engine exhaust: a
review. Inhalation Toxicology, 19, 229-239.
[47] KLIJNHOUT. A.F., BEHEER, H.T., VAN EEDE, P., 1986.Basic
Biological Processes. Centenary Review some characteristics of brewery effluent. Hallard.
[48] RAMALHO, R.S., 1999.Introduction to waste water treatment
process. 2ndedition. Centenary review.
[49] ROLNALD, F., 2005.Sequencing Batch Reactor Design and
Operational Considerations. New England and Interstate Water Pollution control Commission. Lowell, MA-01852-1124.
[50] SHABANGU, K., 2016. Aerobic Sequencing Batch Reactor for the