ISSN Print: 2161-4717
DOI: 10.4236/ijaa.2019.91004 Mar. 7, 2019 39 International Journal of Astronomy and Astrophysics
Spitzer
IRAC Colors of Nebulae Associated with
Star-Forming Regions
Yoichi Itoh
1, Yumiko Oasa
21Nishi-Harima Astronomical Observatory, Center for Astronomy, University of Hyogo, Sayo, Hyogo, Japan
2Faculty of Education, Saitama University, Saitama, Japan
Abstract
Star-forming regions are often associated with nebulosity. In this study, we investigated infrared diffuse emission in Spitzer IRAC images. The infrared nebula L1527 traces outflows emanating from a low-mass protostar. The ne-bular color is consistent with the color of a stellar photosphere with large ex-tinction. Nebulae around the HII region W5-East are bright in the infrared. These colors are consistent with the model color of dust containing polycyclic aromatic hydrocarbon (PAH). The strength of ultraviolet irradiation of the nebulae and the small dust fraction were deduced from the infrared colors of the nebulae. We found that the edges of the nebulae are irradiated by strong ultraviolet radiation and have abundant small dust. Dust at the surface of the molecular cloud is thought to be destroyed by ultraviolet radiation from an early-type star.
Keywords
Interstellar Medium, Dust, Extinction, HII Regions
1. Introduction
Dust is one of the most fundamental solid materials in the universe. It is ubi-quitous, but dust grains have diverse sizes. It is widely believed that small dust is abundant in the interstellar medium. Interstellar extinction increases with de-creasing wavelength in the ultraviolet (UV) and optical wavelengths, with a cha-racteristic bump at 2175 Å [1] claimed that this wavelength dependence of the extinction is well reproduced by graphite dust with a power law size distribution between 0.005 and 1 μm in diameter with an exponent of ~−3.5. On the other hand, an overabundance of large dust has been observed in dense regions. [2]
How to cite this paper: Itoh, Y. and Oasa, Y. (2019) Spitzer IRAC Colors of Nebulae Associated with Star-Forming Regions. International Journal of Astronomy and Astrophysics, 9, 39-50.
https://doi.org/10.4236/ijaa.2019.91004
Received: January 27, 2019 Accepted: March 4, 2019 Published: March 7, 2019
Copyright © 2019 by author(s) and Scientific Research Publishing Inc. This work is licensed under the Creative Commons Attribution International License (CC BY 4.0).
DOI: 10.4236/ijaa.2019.91004 40 International Journal of Astronomy and Astrophysics
found that the Lupus 3 dark cloud shines in near-infrared wavelengths. They at-tributed the nebular emission to scattering of starlight by dust. The observed near-infrared color was reproduced by an interstellar dust model with a higher number density for a larger size regime. [3] conducted polarimetric imaging ob-servations of a T Tauri star, UX Tau. With a spatial resolution of 0.1” (14 AU), they detected a strongly polarized circumstellar disk surrounding UX Tau A. It extends to 120 AU with a polarization degree ranging from 1.6% to 66%. The observed azimuthal profile of the polarization degree was not consistent with dust models using Rayleigh scattering or Mie scattering approximations. A thin disk model with nonspherical dust having a diameter of 60 μm reproduced the observed azimuthal profile.
Polycyclic aromatic hydrocarbon (PAH) is a major component of dust. PAH has many broad emission features in the near- and mid-infrared wavelengths. The strength of the PAH features depends on the number of molecules, degree of ionization, and strength of the UV radiation. [4] conducted Spitzer Infrared Spectrograph (IRS) observations of NGC 7023, a reflection nebula irradiated by a Herbig Be star, HD 200775. They observed a 72” × 54” region northwest of the exciting star in the slit-scan mode. This region contains a photodissociation re-gion (PDR) and a molecular cloud. They detected PAH emission bands between 5 and 15 μm and fitted them by model spectra to determine the size, charge, composition, and hydrogen adjacency of the dust. The boundary between the PDR and the molecular cloud showed a distinct discontinuity in the PAH cha-racteristics. In the molecular cloud, small, neutral PAHs account for the emis-sion, whereas stable, large, symmetric, and compact PAH cations are abundant in the PDR. They also found enhancement of the 6.2 and 11.0 μm emission close to the exciting star, indicating PAH photodehydrogenation and frag-mentation.
DOI: 10.4236/ijaa.2019.91004 41 International Journal of Astronomy and Astrophysics
We investigate the infrared colors of nebulae irradiated by a nearby star using archival Spitzer IRAC data. By comparison with the model colors, we consider the properties of dust in molecular clouds. In this paper, the phrase “small dust” is used for dust with less than 103 C atoms, which corresponds to a diameter of
~13 Å, as it is used in DL07.
2. Data
Infrared data were taken from the Spitzer Archive Center. We used the reduced data [post-basic calibrated data (PBCD)] of 3.6 μm images, 4.5 μm images, and 5.8 μm images (PI: Fazio Giovanni). The spatial resolution of the data is about 1.8 arc seconds. We measured the average and standard deviation of the sky re-gion or the HII rere-gion adjacent to the nebula and then subtracted the average count from the image. Next, we made three types of mask images. The first mask image was designed to reject low signal-to-noise regions. We made it from the sky-subtracted image by replacing counts more than 10σ above the sky count with one and counts less than 10σ above the sky count to zero. The second mask image was designed for point source rejection. Point sources were identified on the sky-subtracted image by the DAOFIND task in the IRAF software, and the flux of each source was measured by aperture photometry. A mask was created for each source, as a large aperture mask was made for a bright object. The mask regions were set to zero, and the other regions were set to unity. We also made another point source mask image using Sextractor with the SEGMENTATION option in the CHECKIMAGE_TYPE parameter. These three types of mask im-ages were multiplied by the sky-subtracted image so that only diffuse emission appears in the final image.
3. Results
3.1. L1527
DOI: 10.4236/ijaa.2019.91004 42 International Journal of Astronomy and Astrophysics Figure 1. Infrared color of reflection nebula L1527 (filled circles). The nebular colors are measured for every 3.0”× 3.0” region. Stellar photospheres are located close to (0, 0) for any spectral type. A solid red line from the origin indicates the direction of interstellar ex-tinction. Filled red squares correspond to AV = 100, 200, and 300 mag, respectively. Filled blue triangles show colors of blackbodies with temperatures between 1000 and 500 K. The PAH colors predicted by the model are also shown at bottom right. The color of L1527 is consistent with the colors of Class I and Class II sources.
diagram distinguishes between a reflection nebula and an emission nebula con-taining PAH features.
From the figure, the amount of extinction is estimated. The photospheric col-or of the protostar IRAS 04368 + 2557 is assumed to be (0, 0), the same colcol-or as dwarfs and giants. We consider that the distance from the points of the nebular color to the line perpendicular to the extinction vector and through the origin corresponds to the extinction in the path from the central star through the ne-bula to us. Figure 2 shows the extinction map of the nebula L1527. The outflows sweep up the material in the envelope of the protostar, forming a cavity. The wall of the cavity or the residuals in the cavity reflects the light from the central star. Near the central star, the extinction is as large as 150 mag in the V band. The extinction of the eastern outflow is slightly less than that of the western out-flow. This estimate is consistent with a near-infrared image showing that the eastern outflow is brighter than the western outflow [10].
3.2. W5-East
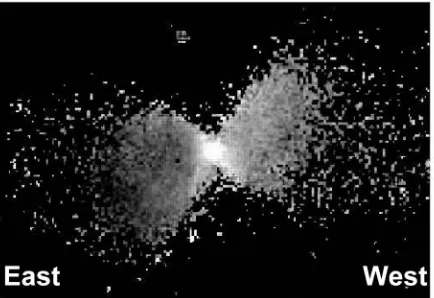
DOI: 10.4236/ijaa.2019.91004 43 International Journal of Astronomy and Astrophysics Figure 2. Extinction map of protostar in L1527. The field of view is 179” × 123”. A pro-tostar is located at the center of the image. AV = 20 mag and AV = 150 mag are shown in black and white, respectively. Near the protostar, the extinction is as large as 150 mag in the V band. Outflows are located to the east (left) and west (right) of the central star and sweep up the material in the envelope of the protostar. The extinction of the eastern out-flow is slightly less than that of the western outout-flow. In near-infrared wavelengths, the eastern outflow is brighter than the western outflow.
[11] searched for point sources in this region using Spitzer IRAC and MIPS im-ages. They identified 2064 young stellar objects on the basis of their infrared spectral energy distributions. The majority of young stellar objects with infrared excess belong to clusters with more than 10 members.
W5 consists of two circular H II regions, W5-East (W5-E) and W5-West. The ionizing star in W5-E is an O7V star, BD +59˚ 0578. We investigate the diffuse emission of the nebulae in the northeast region of W5-E. In this region, two bright rim clouds (BRCs) have been identified [12]. BRC 13 is classified as a Type B cloud, and BRC 14 is identified as a Type A cloud according to their morphology. It is believed that a BRC evolves from Type A through Type B and then Type C [13]. A cluster of massive young stars, AFGL 4029, is located in BRC 14. [14] revealed sequential formation of low-mass stars in this cluster.
Figure 3 is a pseudo-color map of the northeast region of W5-E. Nebulae facing the HII region are bright in the IRAC 3 bands. We selected several small regions to investigate the nebular color (Figure 4). Figure 5 shows a color-color dia-gram of the selected regions of W5-E. The colors of the nebulae are not consis-tent with the color of the photosphere with extinction or with blackbody radia-tion. The [4.5] - [5.8] colors of the nebulae are redder than the colors of the photosphere and a blackbody.
DOI: 10.4236/ijaa.2019.91004 44 International Journal of Astronomy and Astrophysics Figure 3. Pseudo-color image of northeast region of W5-E constructed from IRAC 3.6, 4.5, and 5.8 μm images. The field of view is 22.1’ × 14.3’. The regions whose colors are discussed on the color-color diagram are indicated by boxes (red: BRC 14, green: bay-like region, blue: B- and C-like BRCs). The exciting star is located outside the frame below the bottom of the figure.
Figure 4. Close-up view of the marked regions in Figure 3. The field of view of both im-ages is 2.7’ × 3.6’. The bay-like region is indicated by a green box, and B- and C-like BRCs are indicated by blue boxes.
Heating of dust by starlight is considered. Its strength is parameterized by the factors of the interstellar radiation field (UISRF, [16]). They presented infrared spectra of dust with various mass fractions of small dust and starlight intensities. The vibration modes of PAH produce strong emission features at 3.3, 6.2, 7.6, 8.6, and 11.3 μm. The intensities of these features change with the temperature of the dust. A small dust grain is easily heated by absorption of a few UV pho-tons or a single UV photon and then emits strong PAH features at short wave-lengths. Thus, the ratio of the PAH emission feature and the color of specific photometric bands is a function of the fraction of small dust and the intensity of the UV radiation.
[image:6.595.242.506.328.503.2]DOI: 10.4236/ijaa.2019.91004 45 International Journal of Astronomy and Astrophysics Figure 5. Infrared colors of the marked regions of the nebulae in W5-E. Colors of differ-ent nebulae are shown by differdiffer-ent symbols. Over plotted are the model color of dust containing PAH. The solid lines show the model colors of various small dust fractions (q
= 0.47%, 1.12%, 1.77%, 2.50%, 3.19%, 3.90%, and 4.58%). The nebula containing abun-dant small dust is bluer. The dotted lines indicate the model colors with various UV radi-ation levels between 102 times and 3 × 10⁵ times the interstellar UV radiation in steps of 0.5 on a logarithmic scale. The nebulae are bright with PAH emission bands.
DL07 (Figure 5). The nebulae are emission nebulae. The colors at different posi-tions in the nebulae are located at different loci in the diagram. The colors of the bay-like region are located at the top-left position representing a part of BRC 14 in the color-color diagram. This indicates that the small dust fraction is small and the UV radiation is strong in the bay-like region compared to those in BRC 14. The colors of the B- and C-like BRCs are located below and to the left of the color of BRC 14 in the diagram. This indicates that the B- and C-like BRCs have an abundant population of small dust irradiated by or a single UV photon and then emits strong PAH features at short wavelengths. Thus, the ratio of the PAH emission feature and the color of specific photometric bands is a function of the fraction of small dust and the intensity of the UV radiation.
DOI: 10.4236/ijaa.2019.91004 46 International Journal of Astronomy and Astrophysics
an abundant population of small dust irradiated by strong UV radiation.
The strength of the UV radiation is estimated from the nebular color. We calculated the mean color of 5 × 5 pixel (3.0” × 3.0”). The observed colors of the nebulae are compared with the model color of DL07. The model-calculated PAH fluxes for single UV strengths are up to 3 × 10⁵ times the interstellar value. We
excluded a pixel if its observed color did not match the model color of DL07. We also ignored pixels near the bright stars, which are masked in the data reduction procedure. Figure 6 shows the spatial distribution of the UV strength. As ex-pected, the edge of the nebulae facing the HII region show colors indicating strong UV radiation. At the inner part of the nebulae, the colors are consistent with the model color with weak UV radiation. Most of the UV photons from the exciting star are thought to be absorbed and scattered by dust in the molecular cloud. We also estimate the small dust fraction as described above. Figure 7 shows
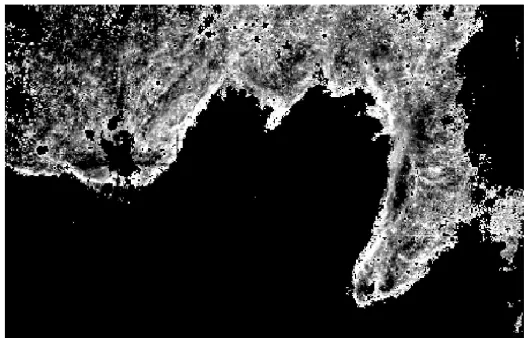
Figure 6. UV irradiation of the nebulae. log
( )
U =5.15 mag and log( )
U =5.30 mag [image:8.595.242.507.275.446.2]are depicted in black and white, respectively. The edge of the nebulae facing the HII re-gion are irradiated by strong UV radiation.
Figure 7. Spatial distribution of small dust fraction. q=1.5% mag and q=3.0% mag
[image:8.595.241.506.508.677.2]DOI: 10.4236/ijaa.2019.91004 47 International Journal of Astronomy and Astrophysics
the spatial distribution of the small dust fraction in W5-E. The distribution is not uniform in the nebulae. At the inner part of the nebulae, the small dust frac-tion is small, and at the edge of the nebulae, it is large. This inhomogeneity is especially obvious for BRC 13, a Type B BRC.
The fact that small dust is more abundant at the edge of the nebulae than in the inner part of the nebulae indicates that large dust grains at the surface of the molecular clouds are reduced to small dust grains by UV radiation from the ear-ly-type star.
4. Discussion
Our claim that dust grains at the surface of the molecular cloud are destroyed by UV radiation emanating from an early-type star is deduced from the nebular color in the flux-calibrated images. To estimate the precise flux of the nebulae, we subtracted the flux of the HII region adjacent to the nebulae. We examined whether the uncertainty in the flux of the HII region challenges our claim. We added or subtracted a flux representing 5 times the standard deviation of the flux of the HII region and then estimated the strength of the UV radiation and frac-tion of small dust. Even after we added or subtracted the flux, the claim that small dust is abundant at the surface of the molecular cloud remained valid. Diffuse emission appears even in the HII region (see Figure 1 of [11]). Even if the UV strength and dust population are estimated using the original PBCD im-ages, the spatial distribution of the dust population does not change; i.e., small dust is abundant at the surface of the molecular cloud.
The overabundance of small dust at the surface of the molecular cloud is de-duced from the “blue” infrared colors at the edge of the nebula. Nebulae have different infrared colors not only with different small dust fractions and different UV radiation strengths but also with different amounts of extinction. The blue color at the edge of the nebula is naturally thought to be produced by the low ex-tinction. At the edge of the nebulae, the small dust fraction is as high as 4%, whereas at the inner part of the nebulae, the fraction is as low as 2% and reaches 1.5% locally. The [4.5] - [5.8] color difference between the edge and the region with q=1.5% is about 0.2 mag (Figure 5). These observations can be repro-duced if the inner part of the nebulae has an extinction of 30 mag in the V band.
DOI: 10.4236/ijaa.2019.91004 48 International Journal of Astronomy and Astrophysics
color difference of the infrared nebula is totally reproduced by the difference in the extinction. We think that the observed color difference is caused, at least partially, by the spatial inhomogeneity of the small dust fraction.
The process of dust destruction has been intensively investigated. [17] claimed that thermal evaporation of dust due to strong radiation from an exciting star is likely to be unimportant even in an HII region. Similar arguments were given in
[18]. On the other hand, recent observational studies indicated spatial variation of the physical or chemical state of PAH. [19] observed the M17-Southwest photodissociation region with the Infrared Space Observatory Short Wavelength Spectrometer. They found that all the PAH features peak at the boundary of the HII region and the molecular cloud, indicating spatial variation of the PAH ab-undance. From the flux ratios of the PAH features, they concluded that most of the PAHs are ionized and almost fully hydrogenated in the HII region and at the boundary. [20] constructed a radiative transfer model of ionized hydrogen re-gions and fitted it to the infrared spectra of the HII region RCW 120. From the spatial variation of the PAH emission features, they concluded that PAHs are destroyed in the ionized region on a timescale of 30 Myr. Observational study of spatially resolved dust size distributions in molecular clouds under different UV environments will conclusively identify the dust destruction process.
5. Conclusions
We investigated the infrared colors of nebulae associated with star-forming re-gions using Spitzer IRAC images.
• The color of the diffuse emission of L1527 is consistent with a photospheric color with large extinction. The central source of the emission is a low-mass protostar, which does not emit strong UV radiation that excites PAHs.
• The nebulae in W5-E facing the HII region are bright in the infrared. Their color is not uniform. A comparison with the model color of small dust emis-sion revealed that the nebulae are bright in PAH emisemis-sion features. The ne-bular color indicated that the nebulae facing the HII region are irradiated by strong UV radiation and contain a large population of small dust. We claim that the dust grains at the surface of the molecular cloud are destroyed by UV radiation from an early-type star.
Acknowledgements
We thank the editor and the referee for their comments. This work is based on observations made with the Spitzer Space Telescope, which was operated by the Jet Propulsion Laboratory, California Institute of Technology under a contract with NASA. This work was supported by JSPS KAKENHI Grant Number JP24540231.
Conflicts of Interest
DOI: 10.4236/ijaa.2019.91004 49 International Journal of Astronomy and Astrophysics
References
[1] Mathis, J.S., Rumpl, W. and Nordsieck, K.H. (1977) The Size Distribution of Inters-tellar Grains. Astrophysical Journal, 217, 425-433. https://doi.org/10.1086/155591 [2] Nakajima, Y., et al. (2003) Deep Imaging Observations of the Lupus 3 Cloud: Dark
Cloud Revealed as Infrared Reflection Nebula. Astrophysical Journal, 125, 1407-1417. https://doi.org/10.1086/367913
[3] Tanii, R., et al. (2012) High-Resolution Near-Infrared Polarimetry of a Circumstel-lar Disk around UX Tau A. Publ. of Astronomical Society of Japan, 64, Article ID: 124. https://doi.org/10.1093/pasj/64.6.124
[4] Boersma, C., Bregman, J.D. and Allamandola, L.J. (2013) Properties of Polycyclic Aromatic Hydrocarbons in the Northwest Photon Dominated Region of NGC 7023. I. PAH Size, Charge, Composition, and Structure Distribution. Astrophysical Jour-nal, 769, Article ID: 117. https://doi.org/10.1088/0004-637X/769/2/117
[5] Draine, B.T. and Li, A. (2007) Infrared Emission from Interstellar Dust. IV. The Si-licate-Graphite-PAH Model in the Post-Spitzer Era. Astrophysical Journal, 657, 810-837. https://doi.org/10.1086/511055
[6] Draine, B.T., et al. (2007) Dust Masses, PAH Abundances, and Starlight Intensities in the SINGS Galaxy Sample. Astrophysical Journal, 663, 866-894.
https://doi.org/10.1086/518306
[7] Megeath, S.T. et al. (2004) Initial Results from the Spitzer Young Stellar Cluster Survey. Astrophysical Journal, 154, 367-373. https://doi.org/10.1086/422823
[8] Chapman, N.L. and Mundy, L.G. (2009) Deep JHKs and Spitzer Imaging of Four Isolated Molecular Cloud Cores. Astrophysical Journal, 699, 1866-1882.
https://doi.org/10.1088/0004-637X/699/2/1866
[9] Hartmann, L., et al. (2005) IRAC Observations of Taurus Pre-Main-Sequence Stars.
Astrophysical Journal, 629, 881-896.https://doi.org/10.1086/431472
[10] Tamura, M., et al. (1996) Interferometric Observations of Outflows from Low-Mass Protostars in Taurus. Astrophysical Journal, 112. 2076-2085.
https://doi.org/10.1086/118164
[11] Koenig, X.P., et al. (2008) Clustered and Triggered Star Formation in W5: Observa-tions with Spitzer. Astrophysical Journal, 688, 1142-1158.
https://doi.org/10.1086/592322
[12] Sugitani, K., et al. (1989) Star formation in Bright-Rimmed Globules—Evidence for Radiation-Driven Implosion. Astrophysical Journal, 342, L87-L90.
https://doi.org/10.1007/BFb0119459
[13] Miao, J., et al. (2009) An Investigation on the Morphological Evolution of Bright-Rimmed Clouds. Astrophysical Journal, 692, 382-401.
https://doi.org/10.1088/0004-637X/692/1/382
[14] Matsuyanagi, I., et al. (2006) Sequential Formation of Low-Mass Stars in the BRC 14 Region. Publications of the Astronomical Society of Japan, 58, L29-L34.
https://doi.org/10.1093/pasj/58.4.L29
[15] Weingartner, J.C. and Draine, B.T. (2001) Dust Grain-Size Distributions and Ex-tinction in the Milky Way, Large Magellanic Cloud, and Small Magellanic Cloud.
Astrophysical Journal, 548, 296-309. https://doi.org/10.1086/318651
DOI: 10.4236/ijaa.2019.91004 50 International Journal of Astronomy and Astrophysics [17] Salpeter, E.E. (1977) Formation and Destruction of Dust Grains. Annual Review of
Astronomy & Astrophysics, 15, 267-293.
https://doi.org/10.1146/annurev.aa.15.090177.001411
[18] Draine, B.T. and Salpeter, E.E. (1979) Destruction Mechanisms for Interstellar Dust.
The Astrophysical Journal, 231, 438-455.
[19] Verstraete, L., et al. (1996) SWS Spectroscopy of Small Grain Features across the M17-Southwest Photo Dissociation Front. Astronomy & Astrophysics, 315, L337-L340.
[20] Pavlyuchenkov, Y.N., Kirsanova, M.S. and Wiebe, D.S. (2013) Infrared Emission and the Destruction of Dust in HII Regions. Astronomy Reports, 57, 573-585.