ISSN Online: 2333-9721 ISSN Print: 2333-9705
DOI: 10.4236/oalib.1105002 Nov. 14, 2018 1 Open Access Library Journal
Analysis on the Structure and Competitiveness
of Shaanxi’s Manufacturing Industry—Based on
SSM Analysis
Bingzhou Wen, Jiaoyang Du
School of Xi’an University of Science and Technology, Xi’an, China
Abstract
This paper focuses on the manufacturing industry in Shaanxi Province, and selects 2003-2016 as the whole period of the study. In this paper, SSM analysis is used to reveal the comprehensive situation of the overall manufacturing industry and 17 specific industries in Shaanxi Province. On this basis, in or-der to ensure that the research results are more illustrative, the whole interval is divided into three annual intervals. The SSM analysis method is used to study the three annual intervals, and the results are compared and analyzed. Reveal the changes of manufacturing structure and competitiveness in Shaanxi Province during the past 13 years. It is concluded that although in the manufacturing industry in Shaanxi Province the results are good, but the manufacturing industry in Shaanxi Province has been declining in recent years, so it is urgent to adjust and optimize the structure. At the same time, measures should be taken to prevent the decline of competitive advantage. At the same time, different industries also have different problems. According to the results, 17 industries are divided into different industry types, and differ-ent suggestions are put forward for each type of industry.
Subject Areas
Business Analysis, Business Communication, Business Research Methods, Business and Economics Education
Keywords
SSM Analysis, Shaanxi Manufacturing Industry, Industrial Structure, Industrial Competitiveness
1. Introduction
Shaanxi Province, as a well-known old industrial base, is also an important
eco-How to cite this paper: Wen, B.Z. and Du, J.Y. (2018) Analysis on the Structure and Competitiveness of Shaanxi’s Manufacturing
Industry—Based on SSM Analysis. Open
Access Library Journal, 5: e5002.
https://doi.org/10.4236/oalib.1105002
Received: October 26, 2018 Accepted: November 11, 2018 Published: November 14, 2018
Copyright © 2018 by authors and Open Access Library Inc.
This work is licensed under the Creative Commons Attribution International License (CC BY 4.0).
http://creativecommons.org/licenses/by/4.0/
DOI: 10.4236/oalib.1105002 2 Open Access Library Journal nomic province in the west of China. It is now in a crucial period of industriali-zation, and the important industrial pillar industry in Shaanxi Province is the manufacturing industry, in promoting economic growth and other aspects played a very important role. In the context of the country’s strategy of imple-menting the large-scale development of the western region, the manufacturing industry in Shaanxi Province has ushered in a period of rapid development in the past decade. Compared with the previous period, during this period, the total manufacturing economy of Shaanxi Province accelerated growth; the scale of manufacturing industry increased from small to large; the pillar industry grew strongly, leading products grew rapidly; and the energy and chemical industry developed rapidly; the proportion of the market share and the national economy of the province has obviously increased, forming a certain scale, horizontal and complete manufacturing system.
In December 2016, the “13th Five-Year Plan” of Shaanxi Province for strategic development of famous brands (2016-2020) was issued with the consent of the Shaanxi Provincial Commission for the Promotion of work of a strong Province of quality. It will take five years to build a group of Shaanxi brands with core competence and famous brands at home and abroad to set up the new images of “made in Shaanxi”, “created in Shaanxi” and “Shaanxi service” [1]. For the cur-rent Shaanxi manufacturing industry, the policy support of the state and the sustained growth of market demand is a rare opportunity for development. We must firmly grasp the opportunity to realize the strategic transformation and upgrading from middle and low to high end. This paper uses SSM analysis me-thod to find out the whole development of Shaanxi manufacturing industry and the problems existing in the specific industry, and puts forward the correspond-ing adjustment direction.
2. Methods and Data Processing
2.1. SSM Analysis
2.1.1. Meaning of SSM Analysis
DOI: 10.4236/oalib.1105002 3 Open Access Library Journal evaluate the strength of the competitiveness of the region. According to the re-sults of the analysis, adjust and optimize the industrial structure, grasp the rea-sonable direction of regional economic development in the future.
2.1.2. Model Principle of SSM Analytic Method
The study time interval [0, t] is chosen, and it is assumed that the economic aggregate and structure of the region named I after the interval are different [3]. The total economic volume of region I base period and final year is bi, 0, bi, trespectively. In addition, there are several industrial sectors in the region to jointly develop the economy, bij, 0, bij, t (j = 1, 2, ..., m) respectively indicates the size of the economy in the base and end years of the jth industrial sector in the selected region named I. And use B0, Bt, Bj, 0 and Bj, t represents the total economic volume and the size of the j sector in the reference area at the same time [4].
The rate of change within the study interval for sector j in region i:
(
, ,0)
ij ij ij ij
r = b t b− b , 0 (j = 1, 2, ..., m) (1)
The rate of change of the jth industrial sector in the reference area within the study area:
(
, ,0)
j ij ij ij
R = B t B− B , 0 (j = 1, 2, ..., m) (2)
Standardization of the share of sectors in the reference area in accordance with the share of each sector of the region:
0
,0 ,0
ij i i
b′ =b ×B B (j = 1, 2, ..., m) (3)
Total growth Gij in sector j of the region i will be studied divided into growth share deviations Nij =b Rij′× j; the deviation component of industrial structure is Pij =
(
bij,0−bij′)
×Rj and the deviation component of competitive-ness is Dij =bij,0×(
rij−Rj)
.The total deviation is equal to the sum of the structural deviation component and the competitive deviation component in the interval
(
PDij =P Dij+ ij)
.On this basis, the formula L = W × U [5] is constructed. W denotes the ence of industrial structure on regional economic growth, U indicates the influ-ence of the speed of industrial growth on competitiveness, and L indicates the growth rate of the studied region relative to the reference region. If the Gi is greater, L > 1, it indicates that the level of growth of the study area is faster than that of the reference area; the Pi is greater, W > 1, this shows that the large proportion of the regional economic and industrial sectors is the fast-growing sector, the overall economic structure of the region is relatively good, and the structure plays a more active role in the economic growth. The Di is larger, U > 1, shows that the industrial departments in the study area have a rising trend and strong competitiveness.
2.2. Data Selecting
DOI: 10.4236/oalib.1105002 4 Open Access Library Journal the specific conditions of our country, the National Bureau of Statistics of China revised the Industrial Classification of National economy [6] three times in 1994, 2002 and 2011 respectively. The 2002 revision has only made certain cuts and modifications in the manufacturing subcategories, while the 2011 revision re-sults show that compared with 2002, the classification of the manufacturing sec-tor in the broad category has more obvious changes. For example, the rubber and plastic products industries are merged into rubber and plastic products, and transportation equipment manufacturing is split up into automobiles and other transport equipment and so on. The subjects of this study are between 2002 and 2016, so in order to maintain the accuracy and consistency of the data as much as possible, and to maintain the consistency of the industry, we will consolida-tion of general equipment manufacturing and specialized equipment manufac-turing into machinery manufacmanufac-turing according to the different situations of the manufacturing industry classification in the 2002 and 2011 revision of the In-dustry Classification of Nationaleconomy [7]. Merging the agro-food processing industry and the food manufacturing industry into food processing and manu-facturing, the combined manufacturing of automobile and railway, ships, aero-space and other transport equipment shall be the manufacturing of transporta-tion equipment, the plastics and rubber manufacturing industries are merged into plastics and rubber manufacturing industries, the combination of textile industry and textile clothing, clothing industry for the textile industry.
According to the Statistical Yearbook of Shaanxi Province, we calculated the proportion of the total industrial output value of manufacturing industries in Shaanxi Province from high to low in 2003, 2008, 2012 and 2016, and the indus-tries that accounted for more than 1% of the total output value of manufacturing industries in Shaanxi Province were taken as research objects. As shown in Ta-ble 1.
3. Using SSM Model to Analyze the Manufacturing Industry
in Shaanxi Province
The study period selected from 2003 to 2016 as a whole, spanning 13 years. In order to guarantee the research results more clearly, in applying the model, this 13 years is not simply studied as a whole, but the 13 years are divided into 2003-2008, 2008-2012, 2012-2016, andcompared with the reporting period, the total growth of 17 industries in Shaanxi manufacturing industry is revealed in the 13 years. Structural deviations and competitive deviations [8]. The data are derived from the Statistical Yearbook of Shaanxi Province and the Statistical Yearbook of China. The final results after data analysis and calculation are shown in Table 2.
3.1. Total Annual Results
DOI: 10.4236/oalib.1105002 5 Open Access Library Journal Table 1. Industry research object.
1. Non-ferrous metals smelting and
calendering industry 2. Nonmetallic mineral products industry 3. Wine, beverage and refined tea Industry
4. Manufacturing of communications equipment, computers and other electronic equipment
5. Pharmaceutical
manufacturing industry 6. Food processing and manufacturing
7. Chemical raw materials and
chemical products manufacturing 8. Textile manufacturing industry
9. Electrical machinery and equipment manufacturing industry
10. Ferrous metal smelting and
calendering industry 11. Tobacco products industry
12. Transportation equipment manufacturing industry
13. Petroleum processing, coking and nuclear fuel processing industry
14. Mechanical manufacturing
industry 15. Reproduction of printing and recording media
16. Instrumentation and culture,
office machinery manufacturing 17. Paper and paper products industry
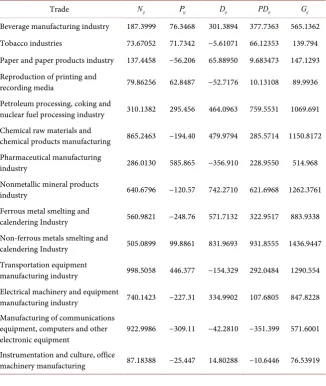
Table 2. Total annual industry deviation of manufacturing industry IN Shaanxi Province: analysis table of share.
Trade Nij Pij Dij PDij Gij
Beverage manufacturing industry 187.3999 76.3468 301.3894 377.7363 565.1362
Tobacco industries 73.67052 71.7342 −5.61071 66.12353 139.794
Paper and paper products industry 137.4458 −56.206 65.88950 9.683473 147.1293
Reproduction of printing and
recording media 79.86256 62.8487 −52.7176 10.13108 89.9936
Petroleum processing, coking and
nuclear fuel processing industry 310.1382 295.456 464.0963 759.5531 1069.691
Chemical raw materials and
chemical products manufacturing 865.2463 −194.40 479.9794 285.5714 1150.8172
Pharmaceutical manufacturing
industry 286.0130 585.865 −356.910 228.9550 514.968
Nonmetallic mineral products
industry 640.6796 −120.57 742.2710 621.6968 1262.3761
Ferrous metal smelting and
calendering Industry 560.9821 −248.76 571.7132 322.9517 883.9338
Non-ferrous metals smelting and
calendering Industry 505.0899 99.8861 831.9693 931.8555 1436.9447
Transportation equipment
manufacturing industry 998.5058 446.377 −154.329 292.0484 1290.554
Electrical machinery and equipment
manufacturing industry 740.1423 −227.31 334.9902 107.6805 847.8228
Manufacturing of communications equipment, computers and other
electronic equipment 922.9986 −309.11 −42.2810 −351.399 571.6001
Instrumentation and culture, office
[image:5.595.212.539.349.736.2]DOI: 10.4236/oalib.1105002 6 Open Access Library Journal
Continued
Machine building industry 854.1146 178.400 −15.4121 162.9884 1017.103
Food processing and manufacturing 937.0164 −54.261 763.6808 709.4194 1646.4349
Textile manufacturing industry 590.5345 −320.64 11.18894 −309.451 281.083
Amount to 8777.02 260.189 3954.711 4214.899 12991.92
structure deviation and competitiveness deviation of the manufacturing industry in Shaanxi Province during the past 13 years. According to the model, the effect index is calculated in Table 3.
3.2. Annual Results
Taking the whole country as the reference area, the total growth, structure devi-ation and competitiveness devidevi-ation of Shaanxi manufacturing industry in these three periods are analyzed.
Call 2003-2008 the first year, 2008-2012 the second year and 2012-2016 the third year. A summary of the total share deviation of Shaanxi’s manufacturing sector in these three annual periods is given in Table 4. According to the model, the effect index is calculated in Table 5, and then the deviation of specific indus-tries in these three periods is summarized, as shown in Table 6.
3.3. Synthesize Analysis
3.3.1. Ensemble AnalysisAccording to Table 2, in the total annual period, the total economic increment of Shaanxi’s manufacturing industry Gi is 12,991.92, Ni is 8777.02, Pi is 260.189 and Di is 3954.711. According to the results, the economic growth in Shaanxi Province during the last 13 years from 2003 to 2016, Ni’s contribution to growth accounts for a considerable portion of the growth. And Pi for only 2% of the total economic growth, the results show that the positive effect of in-dustrial structure on the overall development of manufacturing industry in Shaanxi Province is minimal, and the positive growth of manufacturing industry in Shaanxi Province mainly depends on the pull effect of the national manufac-turing industry growth [9]. Di for 30.4% of the total economic growth, this shows that the overall competitiveness of Shaanxi’s manufacturing industry has a competitive advantage over that of the whole country.
DOI: 10.4236/oalib.1105002 7 Open Access Library Journal Table 3. Total annual effect index of manufacturing industry in Shaanxi Province.
L W U
[image:7.595.207.540.169.239.2]1.4219187 1.026045 1.38582
Table 4. Annual deviation of Manufacturing Industry in Shaanxi Province: an Analytical Table of share.
i
N Pi Di PDi
First year 2987.7168 −53.3129 368.2585 314.9456
Second year 3732.1813 197.9967 1691.184 1889.181
Third year 3061.8191 −432.714 1438.793 1006.079
Table 5. The annual effect index of Shaanxi manufacturing industry.
L W U
First year 1.0749775 0.9873080 1.0887965
Second year 1.2290567 1.0240064 1.2002431
Third year 1.0762258 0.9672152 1.1127056
Table 6. Annual deviation of Manufacturing Industry in Shaanxi Province Analytical Table of share.
(a) Beverage manufacturing industry Tobacco industries Paper and paper products industry Reproduction of printing and recording media Petroleum processing, coking and nuclear fuel
processing industry
Chemical raw materials and chemical products
manufacturing
ij
N
First year 43.101 24.533 57.526 18.0826 178.975 267.223
Second year 85.714 41.869 58.709 22.8051 200.166 399.321
Third year 85.299 13.460 33.432 53.5953 −72.723 299.324
ij
P
First year 17.559 23.888 −23.52 14.2303 170.503 −60.041
Second year 81.108 33.801 −30.70 3.74397 478.074 −144.48
Third year 57.107 7.2870 −18.15 −2.9577 −169.43 −124.42
ij
D
First year 46.248 −1.527 −6.666 −15.658 419.218 −32.851
Second year 16.723 8.2774 12.690 −0.1596 328.772 63.5569
Third year 132.27 −11.79 63.824 −3.6883 −463.86 483.201
ij
PD
First year 63.808 22.361 −30.19 −1.4277 589.722 −92.892
Second year 97.831 42.079 −18.01 3.58435 806.846 −80.931
Third year 189.37 −4.509 45.664 −6.6460 −633.29 358.772
(b) Pharmaceutical manufacturing industry Nonmetallic mineral products industry Ferrous Metal smelting and Calendering Industry Non-ferrous Metals smelting and Calendering Industry Electrical machinery and equipment manufacturing industry Manufacturing of communications equipment, computers
[image:7.595.210.539.270.340.2] [image:7.595.56.539.385.753.2]DOI: 10.4236/oalib.1105002 8 Open Access Library Journal
Continued
ij
N
First year 53.015 165.678 378.255 187.531 244.672 305.006
Second year 113.10 284.487 290.103 205.850 293.726 317.666
Third year 168.83 277.923 −115.13 166.558 293.613 426.066
ij
P
First year 108.59 −31.180 −167.73 37.0861 −75.142 −102.14
Second year 84.839 −61.585 −139.31 106.457 −75.531 −204.85
Third year 60.525 15.3082 31.0754 148.743 −116.63 −316.95
ij
D
First year −97.17 6.90891 1.08548 98.0766 34.8596 −135.36
Second year −16.31 271.123 307.905 363.668 −1.3055 −33.569
Third year 39.538 39.5385 297.681 122.971 249.564 315.763
ij
PD
First year 11.417 11.4178 −166.64 135.162 −40.283 −237.51
Second year 68.538 68.5389 168.599 470.126 −76.837 −236.42
Third year 100.06 100.063 328.756 271.715 132.931 −1.1964
(c) Transportation
equipment manufacturing industry
Instrumentation and culture, office machinery
manufacturing
Machine building
industry and manufacturing Food processing
Textile manufacturing
industry
ij
N
First year 243.20812 35.80631 319.8183 251.8284 213.4518
Second year 398.45491 21.48400 337.7672 434.7550 226.1982
Third year 508.1820 41.47542 290.78161 370.9375 220.1942
ij
P
First year 108.72506 −10.4512 66.80104 −14.5830 −115.897
Second year 304.89340 3.852643 −16.2882 −56.4554 −169.560
Third year 196.82480 14.42374 −46.1984 −10.2248 −159.0112
ij
D
First year 164.78270 30.05087 −78.5509 −2.30118 −62.87055
Second year −47.58252 37.79425 64.98596 261.2152 53.38722
Third year −586.93429 −97.89678 77.98638 411.2641 75.19058
ij
PD
First year 273.50777 19.59958 −11.7499 −16.8842 −178.7677
Second year 257.3108 41.6468 48.6977 204.7597 −116.1729
Third year −390.10949 −83.47303 31.78796 401.0392 −83.82066
From the results of Table 4 and Table 5, during these three years, the total growth of Shaanxi manufacturing economy [11] is mostly contributed by the na-tional growth share, followed by the contribution of competitive deviation ad-vantage.
In the first year, the proportion of the manufacturing industry with fast growth in the manufacturing industry in Shaanxi Province is small, the overall structure is not good, to a certain extent, it brings negative effect to the econom-ic growth, has the competitive advantage, and can make up for the negative ef-fect brought by the structure.
expe-DOI: 10.4236/oalib.1105002 9 Open Access Library Journal rienced a strong momentum of development and structural optimization and reform, which was better than the national average, and was more obvious than the competitive advantage of the previous year, and the contribution of the na-tional share was the highest of the three years. It shows that during this year, the development of manufacturing industry in the whole country is very good, and Shaanxi Province as a whole presents a very good development situation under this situation.
During the third year, the national growth share Ni was lower than that of the previous year, indicating that the national manufacturing industry developed more slowly than the previous year. Pi and Di all smaller than the previous year. Especially Pi has changed from positive to negative, lagging behind the national level of development. It shows that the industrial structure of the na-tional manufacturing industry is continuously optimized and upgraded, and the rapid development of Shaanxi Province, but Shaanxi Province has not been able to keep up with the current situation of national development, has been a lot left behind, lagging the economic development of the manufacturing industry in Shaanxi Province. Although there have always been advantages in competitive-ness, but the negative effect of the structure is also getting stronger and stronger. To sum up, from the total annual results, the overall level of manufacturing industry in Shaanxi Province is really good, its structure and competitiveness have advantages, although the contribution of structural advantages is small. However, from the analysis of three years, we can see that the structural devia-tion of the manufacturing industry in Shaanxi Province in the third year has changed from the positive value in the second year to a negative value, which has pulled down the economic growth driven by the competitive advantage, and has continued to develop according to this trend. Not only that, but also the overall competitive advantage of the manufacturing sector in Shaanxi Province, which is bound to offset the existing advantages and then lower the overall level of eco-nomic growth. Especially in recent years, the manufacturing industry in Shaanxi Province has been on the decline, so Shaanxi Province. It is urgent to adjust and optimize the structure of manufacturing industry in West China, and measures should be taken to prevent the decline of competitive advantage.
3.3.2. Industry Situation Analysis
Results shows that during the total year 2003-2016, 14 of the 17 manufacturing industries in Shaanxi Province have certain advantages in their development, which are in line with the demand of current economic growth, and to a certain extent have promoted the economic development of Shaanxi. Have certain ad-vantage. The development of three industries is lower than the national average, to some extent, the economic growth of Shaanxi has been delayed.
DOI: 10.4236/oalib.1105002 10 Open Access Library Journal 1) In the total annual situation, there are 14 industries whose total deviation is greater than 0, in which the total deviation of 8 industries is growing conti-nuously in three years, and these eight industries have some advantages after development. It can be called as the key industry of Shaanxi Province in recent years: beverage manufacturing; pharmaceutical manufacturing; papermaking and paper products; chemical raw materials and chemical products manufac-turing; electrical machinery and equipment manufacmanufac-turing; ferrous metal smelting and calender processing industry; non-metallic mineral products in-dustry; food processing and manufacturing.
In the eight industries, the structural deviation and competitiveness deviation are positive, which seems to be a well-structured, competitive and sustainable industry. But it can be seen from the annual situation that its structural devia-tion is decreasing and its contribudevia-tion to economic growth is decreasing.
Paper and paper products industry; chemical raw materials and chemical products manufacturing; non-metallic mineral products industry; ferrous metal smelting and calender processing industry; electrical machinery and equipment manufacturing industry; the six industries of food processing and manufacturing belong to the structure deviation component is negative, the competitiveness deviation component is positive, but the competitiveness deviation component is larger than its structure deviation component in the total year. From the point of view of each year, the overall level of these six industries is rising, and the deviation of competitiveness is almost increasing, which is positive in the third year and has a competitive advantage. Of these, the ferrous metal smelting and calender processing industry and the non-metallic mineral products industry are the two lines. The industrial structure and competitiveness deviations are in-creasing, and the structural deviation is positive in the third year. Although the structural deviation between food processing and manufacturing industry has been negative, the value has been decreasing, and the competitiveness deviation has been positive and growing. Chemical raw materials and chemical products manufacturing and electrical machinery and equipment manufacturing also have a competitive advantage, but the structural deviation continues to decline, and has been negative.
2) Of the 14 industries in which the total deviation was greater than 0, that is, the total deviation in five of the 14 industries that developed above the national average had increased first and then declined, namely, tobacco products; repro-duction of the printing and recording media; and petroleum processing; coking and nuclear fuel processing industry; non-ferrous metal smelting and calender processing industry and mechanical manufacturing. The total deviation from the tobacco industry, the printing and recording media, and the oil processing, cok-ing and nuclear fuel processcok-ing industries declined from positive to negative.
com-DOI: 10.4236/oalib.1105002 11 Open Access Library Journal petitive deviation component in the total year, which is of good structure and strong competitiveness in a sustainable industry. However, the structural devia-tion component and the competitiveness deviadevia-tion component of the petroleum processing, coking and nuclear fuel processing industries have been declining in the three years of development, and have become negative in the third year, constantly consuming the accumulated advantages of the previous year. The whole shows the phenomenon of recession to backwardness. The overall level of non-ferrous metal smelting and calender processing industry has declined in re-cent years, especially the competitive advantage in the third year rapid decline.
3) Of the 14 industries whose total deviation is greater than 0, that is, the total deviation of one industry is in a state of continuous decline in three years, that is, the transportation equipment manufacturing industry. From the total annual results of the transportation equipment manufacturing industry, it can be seen that the structural deviation component is positive, the competitiveness devia-tion component is negative, and it belongs to the non-competitive advantage. However, the contribution of industrial structure to economic growth is greater than that of industries which have negative effects on economic growth due to their competitive disadvantage, and to some extent can promote economic growth. According to the annual situation, the deviation of structure and com-petitiveness can be seen. In particular, the level of comcom-petitiveness has been se-riously backward and completely offset the advantages brought by the structure, especially in the case of the increasing share of national growth and the high lev-el of national devlev-elopment.
DOI: 10.4236/oalib.1105002 12 Open Access Library Journal by competitive advantage.
5) Among the three industries whose total deviation is less than 0, that is, the development is lower than the national average, there is one industry: instru-mentation and culture, and office machinery manufacturing. The total deviation of this industry is the first growth and then the decline. The total annual data show that the structural deviation component is negative, and the competitive-ness deviation component is positive, and the structural deviation component is much larger than the competitiveness deviation component numerically. From the point of view of each year, the total deviation of the industry has decreased from positive to negative in the development process, and the deviation compo-nent of competitiveness has been greatly reduced to negative value. The struc-tural deviation component and the value of the deviation component are posi-tive, but the value is very small, showing the phenomenon of recession to back-wardness as a whole.
4. Conclusion and Suggestion
In summary, when using SSM analysis method to study the manufacturing in-dustry in Shaanxi Province, when the time span is large, we only can study the general total year as the study interval. The result only can reflect the result be-tween base period and end stage, but it cannot get the change of interval. There-fore, based on the total annual research, the total year is divided into three parts, and the results of the three years are compared by the method of share deviation, and then the results of the total year are analyzed synthetically.
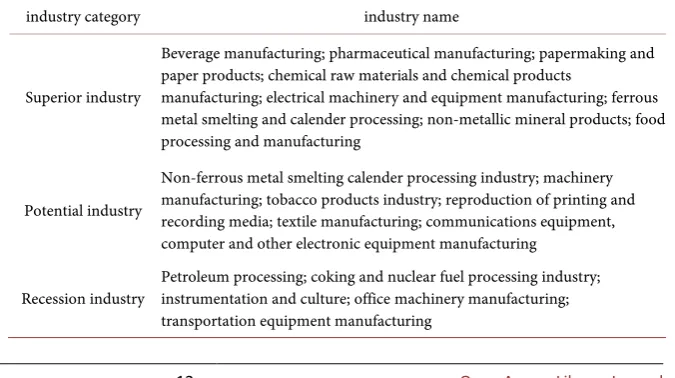
Based on the above analysis, the 17 manufacturing industries in Shaanxi Province can be divided into three categories: dominant industries, potential industries and declining industries [12]. The results are shown in Table 7.
Based on the above conclusions, we can put forward the following suggestions for the specific industry of Shaanxi manufacturing industry:
[image:12.595.205.543.556.745.2]1) To superior industries, we should give priority to development, increase investment and maintain the advantages of related industries; in particular, the
Table 7. Classification of manufacturing industry in Shaanxi Province.
industry category industry name
Superior industry
Beverage manufacturing; pharmaceutical manufacturing; papermaking and paper products; chemical raw materials and chemical products
manufacturing; electrical machinery and equipment manufacturing; ferrous metal smelting and calender processing; non-metallic mineral products; food processing and manufacturing
Potential industry
Non-ferrous metal smelting calender processing industry; machinery manufacturing; tobacco products industry; reproduction of printing and recording media; textile manufacturing; communications equipment, computer and other electronic equipment manufacturing
Recession industry Petroleum processing; coking and nuclear fuel processing industry; instrumentation and culture; office machinery manufacturing;
DOI: 10.4236/oalib.1105002 13 Open Access Library Journal chemical raw materials and chemical products manufacturing industry; the elec-trical machinery and equipment industry; the non-metallic mineral products industry; and the food processing and manufacturing industries, which have a strong competitive advantage and contribute to economic growth; should focus on the development of the object [13], make it bigger and stronger, and strive to have a greater voice in the national industry. At the same time, problems in the development of some industries, such as beverage manufacturing, pharmaceuti-cal manufacturing, chemipharmaceuti-cal raw materials and chemipharmaceuti-cal products manufactur-ing and electrical machinery and equipment manufacturmanufactur-ing, cannot be ignored. These four structural problems exist in the industry. Although the structural problems of these industries do not have a negative effect on their economic growth at present or bring far less positive effects than competitive advantage, but if they are placed in the long run, the problem will become more and more serious, eventually leading to a drag on the industry as a whole so that it no longer has an advantage. Therefore, if we want to develop healthily and sustain-ably, we must constantly adjust the optimization structure in the subsequent de-velopment, and then cooperate with our own competitive advantage so as to make the whole stronger.
2) For potential industries, including non-ferrous metal smelting and calender processing; machinery manufacturing; tobacco products; printing and recording media replication; these are well-established industries that have experienced considerable problems in recent years. In order not to decline, maintaining the existing base is now a top priority. These industries are rapidly declining or the disadvantages have become greater than the advantages, resulting in the overall advantage becoming smaller or not, especially in the non-ferrous metal smelting calender processing industry, as one of the most prominent industries contri-buting to the manufacturing economy in Shaanxi Province. In recent years, the growth is strong, but the competitive advantage has declined significantly. To this, we should combine the concrete analysis of the preceding chapter. As a re-sult, the right remedy is to improve its competitiveness. In addition, there are textile manufacturing and communications equipment, computer and other electronic equipment manufacturing, two basic but very good rising industries [14]; although it is not able to promote economic growth in the industry today, but if this trend continues, the future is bound to be a new source of economic growth. However, we should also pay attention to the imbalance in the devel-opment of these industries. For example, the overall improvement of the manu-facturing industry of communications equipment, computers and other elec-tronic equipment depends entirely on the rise in competitiveness. Its structure has always been at a disadvantage and has been declining. It is the urgent to ad-just the structure of the industry.
DOI: 10.4236/oalib.1105002 14 Open Access Library Journal sharp decline in competitiveness, which has changed from advantages to disad-vantages, and has lowered the overall level. In particular, the oil processing, coking and nuclear fuel processing industries and the transportation equipment manufacturing industries are important sources of economic contribution to the manufacturing industry in Shaanxi Province, but in the process of development they are showing a decline. Not only growth but also the deviation of structure and competitiveness is decreasing, especially in competition. The force level has been seriously backward and completely counterbalanced the advantages brought by the structure. The most urgent task is to find out the main factors that affect the competitiveness of the industry, put forward a strategy to enhance the com-petitiveness; strive to no longer delay, but also adjust the optimization structure, two-pronged to improve the overall level.
To sum up, there are not many sustainable and healthy industries in the man-ufacturing industry of Shaanxi Province, and there are not many sustained backward industries, among which there are many industries with some prob-lems but still have advantages or good momentum, so long as we take measures to solve the problems. In the future, it can become the main industry to promote the economic growth of Shaanxi manufacturing industry. To make Shaanxi Province manufacturing industry a whole, to promote the traditional industry, to strengthen the leading pillar industry, to develop strategic emerging indus-tries, to support the weak indusindus-tries, and to deepen energy saving and emission reduction [15] are the directions of future development. Secondly, the overall development of the manufacturing industry in Shaanxi Province must conform to the current law of development, based on the local resources and the level of economic development. The fixed industrial policy must be able to reflect the regular requirements of industrial development. To give full play to the advan-tages of the resources existing in Shaanxi Province, to take the road of green indu-strialization into account of market demand, to enhance the technological level and the added value of products, and to strengthen technological innovation, we should also focus on enhancing the overall competitiveness. The structure of the manufacturing industry is more reasonable and the development is faster.
Based on SSM analysis, this paper analyzes whether there are advantages and disadvantages of the overall manufacturing industry and industry structure compared with the national average level in Shaanxi Province, and finds out the strengths and weaknesses of the industry, but has not been able to reveal the in-fluence factor which causes its industry superiority and inferiority. In the future research, we can use a large amount of statistical data to analyze and study ac-cording to the different factors that affect the structure of the industry, to reveal the main factors of the advantages and disadvantages of the different industry structures, and to put forward more targeted suggestions to the various indus-tries, in order to optimize the structure of the industry.
Conflicts of Interest
DOI: 10.4236/oalib.1105002 15 Open Access Library Journal
References
[1] Jia, Z. (2017) Opportunities and Challenges of Brand Shaanxi. West Development, No. 5, 112-115.
[2] Franklin, R.S. (2014) An Examination of the Geography of Population Composition and Change in the United States, 2000-2010: Insights from Geographical Indices and a Shift-Share Analysis. Population, Space and Place, 20,18-36.
https://doi.org/10.1002/psp.1744
[3] Da, B.-H. and Lian, T.-H. (2013) A SSM Analysis on Industrial Structure of Wang-jiang Urban Belt. Springer, Berlin, Heidelberg.
[4] Yuan, X.L., Zhang, B.S. and Yang, W.P. (2008) Application of Dynamic Deviation-Share Analysis in Regional Economy. Economic Latitude,No. 1, 55-58.
[5] Zhu, M.M. and Zhao, M.H. (2010) Analysis of the Relationship between Industrial Structure Evolution and Economic Growth in Shandong Province Based on SSM.
Economic Forum, 141-144.
[6] Pan, Q.M. (2012) Study on the Classification Standard of National Economy.
Statistical Science and Practice, No. 6, 16-18.
[7] Wang, X. (2015) Analysis of Manufacturing Industry Structure and Competitiveness of Hebei Province Based on SSM Deviation-Share Analysis. Modern Manufacturing Technology and Equipment, No. 2, 73-75.
[8] Lin, X.X. (2014) Analysis of Manufacturing Structure and Competitiveness of Xingtai City Based on Deviation-Share Analysis. Xingtai Vocational and Technical College, Xingtai, 58-62.
[9] Sun, K.Q. (2010) Comparative Analysis of Shandong High-End Industry Based on Deviation Share Analysis. Claim, No. 12, 30-31+26.
[10] Han, J.F. and Luo, H.X. (2017) A Study on the Change of Industrial Structure and Regional Competitiveness in Yunnan Province. Western Leather, No. 4,94-96+102. [11] Ma, W.H. (2010) Comparative Analysis of Manufacturing Competitiveness in
Yangtze River Delta, Beijing, Tianjin and Hebei, Pearl River Delta Based on Deviation-Share Analysis. Journal of Shanxi University of Finance and Economics, No. 12, 1-11.
[12] Guo, M.Y. and Liu, X. (2018) Analysis on the Growth of Manufacturing Industry in six Provinces of Central China and the Choice of Leading Industries-Based on the Method of Deviation Share Analysis. Technology and Industry,18, 9-15.
[13] Su, J.Y., Huang, Y.-Y. and Chen, W.-C. (2018) Study on the Industrial Choice of County Economy Advantage in Quanzhou City Based on SSM. Technology and Industry, 18,49-52+56.
[14] Tang, X.H., Zhang, X.Y. and Li, Y. (2018) Industrial Structure Optimization and Adjustment of China’s Manufacturing Industry Based on the Perspective of Low Carbon, Employment and Economic Growth with Multiple Constraints.
Exploration of Economic Problems, No. 1, 147-154.