RESEARCH ARTICLE
PATTERN OF GOVERNMENT SPENDING IN NIGERIA: A TIME SERIES ANALYSIS
*Sani Usman Gurowa (PhD) and Usman Muhammad Abdulwahab
Department of Accounting, P.M.B. 117, Gwagwalada, Abuja, Nigeria
ARTICLE INFO ABSTRACT
This paper aims to appraise the pattern of government spending in Nigeria using a time series analysis to compare the nature of government spending between the Pre-Democratic era (between 1984 to 1998) and Democratic era (between 1999 to 2013), with a comprehensive approach and analytical outlook. The study employs secondary data and the data were analysed using the T-test model to test the statistical significance of the hypothesis. The analyses however revealed that public spending in Nigeria is significantly to a particular spectrum of activity, that isrecurrent expenditure, under both eras, this, of course is not good for economic growth. In the area of sectoral allocation of recurrent expenditure, emphasis has been on transfer payment and general administration. The neglect sectors are social and community services and economic services.The study, however, suggests that they should be paradigm shift from the current pattern of government spending(where recurrent spending had been favoured) to capital spending, and that, the on-going fiscal reforms should be made more effective to establish a prudent government sector with enhanced efficiency and productivity.
Copyright © 2017, Sani Usman Gurowa and Usman Muhammad Abdulwahab. This is an open access article distributed under the Creative Commons
Attribution License, which permits unrestricted use, distribution, and reproduction in any medium, provided the original work is properly cited.
INTRODUCTION
The practice of budgeting emerged during the 19thcentury in Europe as a means of dealing with growth in public expenditure. It had grown sufficiently large to require regular procedures for allocating and controlling government expenditure (Gurowa, 2011). These procedures generally come to be regularized as budget practice. Since its genesis, budgeting has been defined as a set of procedures that recur, typically with little or no change, year after year, by means of which government ration resources among their agencies and control the amounts each spends (Akpa, 2008). The first critical difference between the public expenditure management (PEM) and conventional budget is that conventional budgeting operates through accepted procedural norms, while PEM emphasizes substantive outcomes. These outcomes pertain to (a) total revenue and expenditure, (b) the allocation of resources among sectors and programs and (c) the efficiency with which governments institutions operate. To achieve its prepared outcomes, a government must manage public expenditures to implement avowed policy objectives. It must create an institutional framework that enhances the probability that actual outcomes with conform to proffered targets (Akpa, 2008).
*Corresponding author: Sani Usman Gurowa,
Department of Accounting, P.M.B. 117, Gwagwalada, Abuja, Nigeria.
Nigeria has long been afflicted by severe fiscal imbalances, the misdistribution of public resources, and chronic inefficiency in the provision of public services (Akpa, 2008).Public service provision could be affected by institutional inefficiencies such as leakage of public resources, weak institutional capacity and inadequate incentives. Indeed, even if spending is officially allocated to services that target the poor, funds may not necessary reach frontline service providers and effectiveness of service may consequently be affected (World Bank, 2006). Perhaps, the aspect of public finance that has received much attention in the literature, debate and empirical analysis is the economic effects of public expenditures. Many support a large public expenditure on the ground that it puts money into circulation, increased investment and employment and reduces tax averseness (Keynes, 1936; Ranjan&Sharma, 2008; Cooray, 2009). The dominant view among economists as well as public policy makers is that the government can play a very important role in economic development, as the fiscal policy is one of the important instruments because it enables the government to intervene in the economy. This intervention considered a short–run policy to control, the fluctuation in the real and nominal gross domestic product and unemployment rate. It importance to note that investment does not consist only physical capital such as improving and adding to buildings, machinery and stock of inventories but include expenditure on human capital, other social activities and infrastructure(Akpa, 2008).
ISSN: 0975-833X
International Journal of Current Research Vol. 9, Issue, 11, pp.61621-61627, November, 2017
OF CURRENT RESEARCH
Article History:
Received 17th August, 2017
Received in revised form
25th September, 2017
Accepted 29th October, 2017
Published online 30th November, 2017
Citation: Sani Usman Gurowa (PhD) and Usman Muhammad Abdulwahab, 2017. “Pattern of government spending in Nigeria: a time series analysis”,
International Journal of Current Research, Vol. 9, Issue, 11, pp.61621-61627, November, 2017
Key words:
Budgetary Allocation, Government Spending, Recurrent Spending,
Evidence from advance countries indicates that the return to investment in human capital is by far higher than that from physical assets (Akpa, 2008). Investment in human capital can overcome many of the characteristics of labour force that act as impediment to greater productivity, such as poor health, illiteracy unreceptiveness to new knowledge, fear of change, a lack of incentive and immobility. Improvement in health, education and skills of labour can increase considerably the productivity and earning of labour and may be pre-condition for the introduction of more sophisticated, advance technology applied to production (Akpa, 2008). The capacity to absorb physical capital may be limited, among other things, by investment in human capital. This is why public investment must give priority to human capital. Human investment can take many forms including expenditure on health facilities, nutrition and water supply, on-the-job and institutional training
and re-training, formally organized education, study
programmes and adult education, all of which are areas of primary focus in public human investment (Akpa, 2008). The concerns here are the changing pattern of government spending over the years; two levels of public spending structure can be analysed in this context:
Recurrent spending versus capital spending, and
Sectoral allocations of recurrent and capital spending
(Akpa, 2008).
The issue here now is which government function has been receiving increasing attention as the spending pattern changes across time? This, of course, is a trend analysis issue.
Statement of the Problem
In Nigeria, public sector spending had been quite pervasive especially with the advent of crude oil in the early 1970s. Government, in this direction, sought to commanding heights’ in the quest for purposeful development. Projects of various forms such as rolling mills and steel plants, automobile firms, petroleum refining and petrochemicals, sugar production, etc. all of which could only be justified on frontier shifting basis were embarked upon (Akpa, 2008). The poorly implemented import substitution industrialization strategy adopted during the oil boom period left a hoard of publicly owned debt ridden corporations in its toll. The collapse of crude oil in the international oil market in the early 1980s signalled an end to the ‘Indian honey moon’, as government realized that it can no longer put resources in ventures with doubtful returns in the face of dwindling resources. From a historical perspective, government spending in Nigeria could be analysed by examining development planning efforts (Gurowa, 2011).
Government spending in the post fourth development plan era in Nigeria has been on annual basis especially given the nature of rolling plan economic management strategy adopted since 1990. An examination of the annual budget statements for the various years would give the trend but an interesting revelation is that the public sector capital investment as a percentage of the GDP has been on the decline since 1986. It fell from 9% in 1986 to 6% in 1987 and 2% in 1991. The same trend applies to the ratio of public spending to total revenue. Also while the share of administration and security in the capital budget has experienced an upward trend, social service has received a somewhat declining or stagnant share of the capital investment since 1986. The same trend applied to the recurrent expenditure (Akpa, 2008).
The role of human capital formation in economic development has long been recognised in the literature. According to Harbison (1973:3), “human beings are the active agents who accumulate capital, exploit natural resources, build social, economic and political organisations and carry forward national development. Several other theoretical and empirical studies have found a positive correlation between human capital development and economic growth (Lucas, 1958; Romer, 1990; Barro, 2001; Abbas and Foreman – Peckb 2007). Human capital development through schooling is often associated with access to big jobs and higher incomes. This helps to explain the phenomenon of the Kuznets inverse “U” curve hypothesis (Gylfason and Zoega, 2003). The central Bank of Nigeria in year 2000 reported that inadequate funding has been the bane of the Nigerian education system.
In spite of the huge funds allocated and seemingly expended by governments in Nigeria through budgetary provisions, satisfactory service delivery remains a mirage. The dearth of these basic and essential services initiates formidable challenges to sustainable human development(Das Gupta and Khemani, 2006). There is evidence of limited impact of public spending on growth and human development outcomes in Nigeria (Das Gupta and Khemani, 2006). This is the theme of this study, i.e., to assess the pattern of federal government budgetary allocation of funds from 1984 to 2014. It is the aim of this paper therefore to fill this gap by focusing on the pattern of central government spending in Nigeria. The result of the study will reveal the direction of causation between patterns of government spending under military regime and democratic era. This will provide a guide to policy-makers in formulating appropriate plans and strategies for the budgetary allocation to sectors.
The paper is structured as follows. Section 1 is the general introduction. Section 2 presents the review of related literature which is followed by the methodology and empirical analysis in section 3. Section 4 conclude and proffer recommendations.
Objective of the Study
To evaluate the trend of federal government spending in Nigeria from 1984to2014
Research Question
In the context of the preceding statement of objective, the study was designed to find answer to this question:
What is the pattern of federal government of Nigeria budgetary spending from 1984 to 2014?
Statement of Hypothesis
governmentbudgetary provision in Nigeria. Consequently, it is stated that;
Ho: Public budget in Nigeria is not significant to a particular
spectrum of activity.
Hi:Public budget in Nigeria is significant to a particular
spectrum of activity.
Rationale/Justification
This hypothesis is formulated to investigate whether or not the pattern of budgetary provision in Nigeria are tailored to a particular spectrum of activity under the budgetary allocation to various sector.
Literature Review
Public spending refers to all expenditure made by all the tiers of government (i.e. federal, state and local) and their agencies. They include spending for: government administration, production of goods and services, transfers payments, and capital projects (Akpa, 2008). In the words of Ajibola (2008) public expenditure is an expense which the government incurs for maintaining itself and the economy as a whole. It is the cost incurred by the public sector in order to achieve specific objectives. He further adds that Public expenditures are expenses incurred by the government in the course of performing its operations. It includes salaries and wages of civil and public servants, road construction, defence, maintenance of law and order, public infrastructure, etc. Over the past three decades, criticism about government performance has surfaced across the world from all points of the political spectrum. Critics have alleged that governments are inefficient, ineffective, too large, too costly, overly bureaucratic, overburdened by unnecessary rules, unresponsive to public wants and needs, secretive, undemocratic, invasive into the private rights of citizens, self-serving, and failing in the provision of either the quantity or quality of services deserved by the taxpaying public. (See for example, Barzelay and Armajani, 1992; Osborne and Gaebler, 1993; Jones and Thompson, 1999).
For governance to work, public organizations must have sufficient institutional capacity to design and implement policies in ways that are “effective, transparent, impartial, and accountable” (World Bank 2001). A main channel to accomplish this is through reform of the budgeting system. Within the public budgeting process, policymakers decide priorities, set goals, and allocate resources. While institutions and decision-making structures may vary, governance experts generally believe that budgeting systems function better when they are transparent, provide opportunities for stakeholder participation, exercise control on discretion of agents, and assure accountability for performance (Diamond 2003; Deininger and Mpuga, 2005; Ebdon and Franklin, 2006; Gilmour and Lewis 2006). Yet, public budgeting institutions in many countries do not yet meet these criteria: they are often based on line-items or objects of expenditure—for example, salaries, medicines, and equipment—and amounts are determined by making incremental changes to past patterns of resource expenditure. This type of budgeting is generally seen as less effective because it is not focused on results: incremental, line-item budgeting makes it difficult to trace
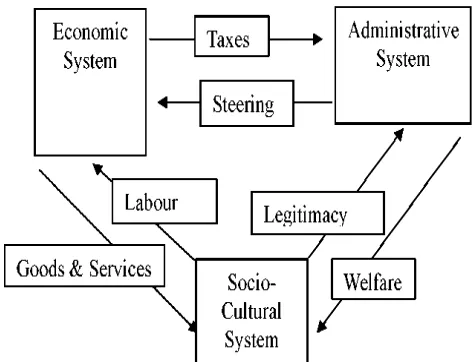
expenditures to policy objectives, and to hold government accountable. Reforms to make budgeting more transparent and accountable try to relate expenditures to objectives, seeking to make budgeting more rational (Lewis 1952; Wildavsky, 1978). Recent public finance reforms such as the Medium Term Expenditure Framework (MTEF) and performance-based budgeting (PBB) fall within the paradigm of rational budgeting (Radin, 1998; Schiavo-Campo and Tommasi, 1999), and are currently being implemented in dozens of countries (Schiavo-Campo, 2008). The success of public budgeting reforms also has implications for health systems strengthening (World Health Organization, 2007). If successful, budget reform could help improve health sector governance, strengthening the capacity of governments to implement health policies efficiently and fairly and achieve better outcomes (Veenstra and Lomas, 1999; Siddiqi, Masud et al. 2009). The theoretical frame work adopted for this study is Habermas’theory of legitimation (1976). Habermas’ Legistimation Crisis (1976) is a social theory that attempt to explain the behaviour of modern welfare state as it grapple with a number of prevailing difficulties and crisis that are commensurate with this type of societal organisation. It is what Llewelyn (2003) would describe as a grand theory’. Habermas (1976) views western society as comprising three distinct subsystem; the economic system in which goods and services are exchanged for money; the administrative system also referred to by Rahaman, Lawrence and Roper (2004) as the political sphere’, which refers to government administration and its interactions with economy and society; and the social cultural system which is defined as:
[image:3.595.315.553.603.784.2]The social system dimension, within which cultural norms and values are discursively formulated by the participants and ideally, provides the legitimating grounds for the action taken by the administrator of the mode of production as well as the distribution of the wealth generated by the economic system. Dillard &Yuthas (2006, PP 202-223)
Figure 1 models the interactions between the three sub-systems as discussed in the Habermas (1976). The socio- cultural system and the economic system interact via the exchange of labour for goods and services. The economic system and the administrative system interact via taxes and steering; which is economic policy such as industry policy tariffs and subsidies. Meanwhile the socio-cultural system interacts with the administrative system via welfare and the provision of Legitimacy to the administrative system.
To use Habermas’ terms within this societal structure there are four potential sources of difficulty that may ultimately lead to crisis – economic, rationality, legitimacy and motivation (Dillard &Yuthas 2006). The causes of economic crisis stem from a marxist explanation and the inherent instability of the market economy. Rationality crises develop when the administrative system, which is forced to intervene in the economic system, is faced with conflicting goals (rationalities) which stem from the need to derive tax revenues sparingly from the economic system, while providing for the ultimate demands from the socio-cultural system. This lack of a clear rationality in the administrative system’s operations may then lead to a loss of legitimacy (legitimacy crisis) from the perspective of the socio-cultural system when society needs are not met and the economy continues to be unstable (Rahaman et al. 2004). This may then be followed by a lack of motivation (motivation crisis) on the part of socio-cultural system to continue to provide its labour to the economic system and its legitimation to the administrative system. Habermas (1976) argues that while each of these crises can be dealt with, dealing with one crisis will lead to increased potential for the occurrence of another type of crisis.
Prior Use and Relevance of Habermas’ Legitimation Crisis
In the accounting literature, Habermas’ theory of legitimation has been used in at least three prior studies- Rahaman, et al. (2004) watkin and Arrington (2005) and Dillard and Yuthas (2006) in particular provided a discussion of the New Public Management (NPM) as being a product of the need for government of western welfare state to deal with the various tendencies for crisis. Watkins and Arrington (2005) identified that the pursuit of public sector reform (such as NPM) is due to the need to reduced taxation and government spending and hence the tendency for perpetuating crisis tendencies. Watkins and Arrington (2005) suggest that accounting is the communication mechanism through which the incentive-based framework (NPM) is implemented. This study identified the patterns of government spending in Nigeria as a crisis situation that needs a paradigm shift from protective sector to productive sector. This underscored the importance of appraising the pattern of public spending in Nigeria i.e. does the government distributed public resource tailored toward implementing its avowed policy objectives? Despite the entire international acclaimed convention which Nigeria is a signatory i.e. EFA, MDGs etc. and its vision to be among the 20th world economies by 2020. Does the government tailor its resources towards the actualization of the said objectives? The main purpose of this article is to report the empirical findings on pattern of public spending in Nigeria.
METHODOLOGY
This study is quasi-experimental involving time series analysis. The study examine the trend of public expenditures vis-à-vis its allocation to the various sector of the economic in Nigeria. The data employed in this study is secondary data. The variables of concern are sectoral allocation of Capital Expenditure (CE), Recurrent Expenditure (RE), covering the period 1984-2013.This study adopts the inferential statistics by employing the T-test Model so as to infer the actual nature of public expenditure.
Decision rule: We reject the null hypothesis if f-calculated is
greater than the critical value (fc >ft) otherwise accept the
alternative hypothesis. The test is conducted at the 1% and 5% level of significance. If the calculated t-value is greater than the table value, the variable is significant.
Data Presentation
Time series data on recurrent expenditure (RE), capital expenditure (CE) and sectoral allocation (SA) are presented in the table below:
Table 1 above presents the trend of federal government recurrent expenditure and sectoral allocation during the pre-democratic era (1984 - 1998).
Table 2 is the pattern of federal government recurrent expenditure and sectoral allocation during the democratic era (1999 - 2013). Table 3 above presents the trend of federal government capital expenditure and sectoral allocation during the pre-democratic era (1984 - 1998). Table 4 above presents the trend of federal government capital expenditure and sectoral allocation during the democratic era (1999 - 2013).
Data Analysis
RESULTS AND DISCUSSION
An independent-samples t-test was conducted to determine whether a significantto a particular spectrum of activity exists before and during democracy, in Nigeria, by comparing, independently, the mean values of expenditure on sectoral allocation. As can be observed from table 5, the mean value of recurrent expenditure on administration before democracy (M = 18.36) and the mean value during democracy (M = 604.66). Therefore, a statistically significant difference (MD = -586.30, t = 5.742, p = 0.00) exists between recurrent expenditure on administration between the periods before and during democracy. Which higher than the recurrent expenditure on social and community services (MD = -318.11, t = -4.395, p = 0.00); economic services (MD = -185.43, t = -4.46, p = 0.00); and transfers (MD = -592.93, t = -6.22, p = 0.00). The expenditure on transfer before democracy is (M = 39.07) and the mean value during democracy (M = 632.01).
Conclusion
From the foregoing, the study concludes that the trend of expenditure in terms of both recurrent and capital expenditure during the pre-democratic and democratic eras is significantto a particular spectrum of activity.
Recommendations
The study recommends: That they should be paradigm shift from the current pattern of government spending (where recurrent spending had been favoured) to capital spending, and
Table 1. Federal Government Recurrent Expenditure (N’ Billion): Pre – Democratic Era (1984-1998)
1984 1985 1986 1987 1988 1989 1990 1991 1992 1993 1994 1995 1996 1997 1998 Total
ADM 1.1 1.4 1.5 3.8 5.8 6.3 6.5 7.0 8.7 30.6 20.5 28.8 46.5 56.2 50.7 275.4
SCS 0.4 0.5 0.5 0.3 2.1 4.2 3.4 2.7 1.3 14.7 10.1 13.8 16.0 22.1 21.4 113.5
ES 0.2 0.3 0.3 0.7 1.2 1.4 1.6 1.3 3.1 7.7 3.9 5.9 4.8 6.2 11.6 50.2
TR 4.2 5.4 5.5 10.8 10.3 14.1 24.7 27.3 39.9 83.7 55.4 79.1 57.2 74.1 94.4 586.1
Total 5.9 7.6 7.8 15.6 19.4 26.0 36.2 38.3 53.0 136.7 89.9 127.6 124.5 158.6 178.1 1,025.2
[image:5.595.53.540.81.143.2]Source: CBN Statistical Bulletin (2013)
Table 2. Federal Government Recurrent Expenditure (N’ Billion): Democratic Era (1999-2013)
1999 2000 2001 2002 2003 2004 2005 2006 2007 2008 2009 2010 2011 2012 2013 Total
ADM 183.6 144.5 180.8 266.5 308.0 306.8 434.7 522.2 626.4 731.0 714.4 1,117.4 1,262.4 1,159.4 1,111.8 9,069.9
SCS 71.4 84.8 79.6 152.2 102.6 134.4 151.6 194.2 256.7 332.9 354.2 550.9 785.4 790.1 844.1 5,528.1
ES 87.1 28.6 53.0 53.0 96.1 58.8 64.3 79.7 179.1 313.8 423.6 562.8 310.4 230.1 291.2 2,831.6
TR 107.6 203.7 265.9 225.2 477.6 610.7 670.6 594.0 527.2 739.7 635.8 878.3 956.2 1,145.6 1,442.0 9,480.1
Total 449.7 461.6 579.3 696.8 984.2 1,110.6 1,321.2 1,390.1 1,389.3 2,117.4 2,128.0 3,109.4 3,314.4 3,325.2 3,689.1 26,909.7
[image:5.595.132.462.508.595.2]Source: CBN Statistical Bulletin (2013)
Table 3. Federal Government Capital Expenditure (N’ Billion): Pre – Democratic Era (1984-1998)
1984 1985 1986 1987 1988 1989 1990 1991 1992 1993 1994 1995 1996 1997 1998 Total
0.3 0.5 0.3 1.8 1.9 2.6 2.9 3.3 5.1 8.1 8.8 13.3 14.9 49.5 35.3
SCS 0.2 1.2 0.7 0.6 1.7 1.8 2.1 1.5 2.1 3.6 5.0 9.2 8.7 6.9 23.4
ES 0.7 0.9 1.1 2.2 2.1 3.9 3.5 3.1 2.3 18.3 27.1 43.1 117.8 169.6 200.9
TR 2.9 3.0 6.5 1.8 2.6 6.6 15.5 20.4 30.2 24.5 30.0 55.4 71.6 43.6 49.5
Total 4.1 5.5 8.5 6.4 8.3 15.0 24.0 28.3 39.8 54.5 70.9 121.1 212.9 269.7 309.0
[image:5.595.125.468.635.722.2]Source: CBN Statistical Bulletin (2013)
Table 4: Federal Government Capital Expenditure (N’ Billion): Democratic Era (1999-2013)
1999 2000 2001 2002 2003 2004 2005 2006 2007 2008 2009 2010 2011 2012 2013 Total
ADM 42.7 53.3 49.3 73.6 88.0 137.8 171.6 185.2 227.0 287.1 291.7 260.2 231.8 190.5 283.6
SCS 323.6 28.0 53.3 32.5 98.0 167.7 71.4 78.7 150.9 152.2 144.9 151.8 92.8 97.4 154.7
ES 17.3 111.5 259.8 215.3 55.7 30.0 265.0 262.2 358.4 504.3 506.0 412.2 386.4 321.0 505.8
TR 114.5 46.7 76.3 0.0 0.0 15.7 11.5 26.3 23.0 17.3 210.2 59.7 207.5 265.9 164.3
Total 498.0 239.5 438.7 321.4 241.7 351.3 519.5 552.4 759.3 960.9 1,152.8 883.9 918.5 874.8 1,108.4
Source: CBN Statistical Bulletin (2013)
Keys: ADM = Administration; SCS = Social & Community Services; ES = Economic Services; and TR = Transfers
Table 5. Recurrent Expenditure
VARIABLE Mean-value Mean- Difference t-value Sig. t
ADM Pre-democracy ADM Democracy
18.36
-586.30 -5.742 0.00
604.66 SCS Pre-democracy
SCS Democracy
7.57
-318.11 -4.395 0.00
325.67 ES Pre-democracy
ES Democracy
3.35 -185.43 -4.46 0.00
188.77 TR Pre-democracy
TR Democracy
39.07 -592.93 -6.22 0.00
632.01
Source: Author’s Computation using SPSS (IBM) 20
Table 6. Capital expenditure
VARIABLE Mean-value Mean- Difference t-value Sig. t
ADM Pre-democracy ADM Democracy
9.91 161.65 -6.72 0.00
171.56 SCS Pre-democracy
SCS Democracy
4.58
-115.28 -6.08 0.00
119.86 ES Pre-democracy
ES Democracy
39.77
-240.95 -5.11 0.00
280.73 TR Pre-democracy
TR Democracy
24.27
-58.32 -2.48 0.19
82.59
The on-going fiscal reforms should be made more effective to establish a prudent government sector with enhanced efficiency and productivity.
REFERECNES
Akpa, A. 2008. Public Finance AndBudgeting; Issues, Imperatives And Challenges FromNigerian Perspective; Spectrum Books Limited; Lagos
Andrews, M. 2004. Authority, Acceptance, Ability And
Performance-Based BudgetingReforms.International
Journal of Public Sector Management 17(4): 332-344.
Andrews, M. 2006."Beyond 'Best Practice' And 'Basics First'
In AdoptingPerformanceBudgeting Reform."Public
Administration &Development26(2): 147-161.
Andrews, M. 2010.Good Government Means Different Things
In Different Countries.Governance: An International
Journal Of Policy, Administration,And Institutions23(1): 7-35.
Andrews, M. And Hill, H. 2003. The Impact Of Traditional
Budgeting Systems OnEffectivenessOf Performance
Based Budgeting: A Different Viewpoint OnRecent
Findings; InternationalJournal Of Public Administration
26(2): 135155.
Anipa, S., Kaluma, F. Et Al. (1999).MTEF InMalawi And
Ghana: Case Study. DFID Seminaron Best Practice
InPublic Expenditure Management. U.K.,Consulting Africa Limited.
Bicknell, W. J., Berman, J. Et Al. 2009. Queen Elizabeth II and TheNew PPPHospital:Baseline Study. Final Report, Volumes I And II, Prepared For TheMinistry Of Health &Social Welfare And The International Finance Corporation. Boston, LesothoBoston HealthAlliance. Brinkerhoff, D. W. And Bossert, T. J. 2008. Health
Governance: Concepts,Experience,and Programming
Options. Policy Brief.Bethesda, MD, HealthSystems 20/20, AbtAssociates Inc.For USAID.
Charmaz, K. 2006. Constructing Grounded Theory: A Practical Guide ThroughQualitative Analysis. Thousand Oaks, CA, Sage Publications.
Deininger, K. and Mpuga, P. 2005. Does Greater
Accountability Improve TheQuality Of Public Service
Delivery? Evidence FromUganda. World Development
33(1): 171-191.
Diamond, J. 2003. Performance Based Budgeting: Managing The Reform Process.IMFWorking Paper
No.WP/03/33.Washington, DC, InternationalMonetary
Fund.
Dorotinsky, B. 2007. MTEF's: Concept AndLessons, International MonetaryFund.
Ebdon, C. And Franklin, A. L. 2006. Citizen Participation
InBudgeting Theory. PublicAdministration Review 66(3):
437.
Gilmour, J. B. and Lewis, D. E. 2006. Does Performance
Budgeting Work? AnExaminationof the Office
OfManagement And Budget's PART Scores.Public
AdministrationReview66(5): 742.
Grindle, M. S. 2007. Good Enough Governance Revisited.
Development PolicyReview 25(5):553-574.
Grizzle, G. A. And Pettijohn, C. E. 2002. Implementing
Performance-BasedProgram Budgeting: A
System-Dynamics Perspective.Public AdministrationReview
62(1): 51.
Guess, G. M. 2001. Decentralization And Municipal
Budgeting In Four BalkanStates. Journal OfPublic
Budgeting, Accounting &Financial Management13(3): 397-436.
Hartley, J. F. 1994. Case Studies In Organizational Research.
Qualitative MethodsInOrganizational Research: A
Practical Guide. C. CassellAndG. Symon.ThousandOaks, CA, Sage Publications.
Kaufmann, D.And Kraay, A. 2007. Governance Indicators:
Where Are We?WhereShould WeBe Going? Policy
Research Working Paper 4370.Washington, DC, World Bank.
Kjaer, A. M. (2004). Governance.Malden, MA, Polity Press. Kong, D. (2005). Performance-Based Budgeting: The U.S.
Experience.PublicOrganization Review 5(2): 91-107.
Le Houerou, P. And Taliercio, R. (2002).Medium Term Expenditure Frameworks:FromConceptToPractice.
Preliminary Lessons FromAfrica. Africa Region
WorkingPaper Series No.28.Washington, DC, World
Bank.
Lewis, V. B. 1952. Toward A Theory Of Budgeting.Public
Administration Review(Winter): 43 45.
Melkers, J. And Willoughby, K. 2005. Models of Performance-Measurement UseInLocalGovernments: Understanding Budgeting, Communication, And Lasting
Effects. PublicAdministration Review 65(2): 180.
Miller, G. J., Hildreth, B. W. Et Al. 2001. Performance-Based
Budgeting.Boulder, COWestview Press.
Overseas Development Institute 2005. Linking Policies
AndBudgets:Implementing MediumTerm Expenditure
Frameworks In A PRSP Context.ODI Briefing
Paper.London,Overseas Development Institute.
Radin, B. A. 1998.The Government Performance AndResults
Act (GPRA):HydraheadedMonster Or Flexible
Management Tool? Public AdministrationReview 58(4):
307316.
Radin, B. A. 2006. Challenging ThePerformance Movement:
AccountabilityComplexityAnd Democratic Values.
Washington, DC, GeorgetownUniversityPress.
Ramkumar, V. 2008.Our Money, Our Responsibility: A Citizens' Guide ToMonitoringGovernment Expenditures. Washington, DC, International BudgetPartnership. Roberts, J. And Andrews, M. 2005. Something Funny
Happened On The Way ToReform Success: The Case Of
Budget Reform Implementation In Ghana.International
Journal OfPublic Administration 28: 291-311.
Robinson, M. And Brumby, J. 2005. Does Performance Based Budgeting Work?AnAnalyticalReview of The Empirical
Literature. IMF Working Paper No.
WP/05/210.Washington,DC, International Monetary
Fund.
Ronsholt, F. E. And Andrews, M. 2005. Getting It
TogetherOrNot. AnAnalysis Of The EarlyPeriod Of
Tanzania's Move Towards AdoptingPerformance
Management Systems.International Journal
OfPublicAdministration 28: 313-336.
Schiavo-Campo, S. 2008. Of Mountains AndMolehills: The
Medium-TermExpenditureFramework. PaperPresented
At The Conference OnSustainability And Efficiency In Managing Public Expenditures, 24-25 July2008.
Honolulu, Hawaii, East-West CenterAndKorea DevelopmentInstitute.
Schiavo-Campo, S.And Tommasi, D. 1999. Managing
Government Expenditure.Manila, Philippines, Asian
Development Bank.
Siddiqi, S., Masud, T. Et Al. 2009. Framework For Assessing
Countries :Gateway To Good Governance.Health Policy 90(1325).
Strachan, B. 2007. District Resource Allocation And Budgeting For Health ServicesInLesotho.Project:
WB/II/C026. Version 3.Cape Town, South Africa, ImpactHealthManagement Solutions.
Van-Deusen L. C., Holmes, S. K. Et Al. (2007). Transformational Change In HealthCareSystems:An
Organizational Model. Health Care Management Review
32(4): 309320.
Vanlandingham, G., Wellman,M. Et Al. 2005. Useful, But Not A Panacea:PerformanceBased Program Budgeting In
Florida.International Journal OfPublicAdministration28:
233-253.
Veenstra, G. And Lomas, J. 1999. Home Is Where The Governing Is: Social CapitalAndRegional Health
Governance. Health &Place 5: 1-12.
Vian, T. 2010. Good Governance And Performance-Based Budgeting: FactorsAffectingReform Progress In Lesotho Hospitals. University ProfessorsProgram.Boston,MA,
Boston University.Doctor OfPhilosophy: 1-186.
Wildavsky, A. 1978. A Budget For All Seasons? Why The
Traditional Budget Lasts.PublicAdministration Review
38 (November-December): 501-509.
World Bank 1998. Public Expenditure Management Handbook.Washington, DC,World Bank.
World Bank 2001. Attacking Poverty.World Development Report 2000/2001.Washington,DC, World Bank.
World Health Organization 2007. Everybody's Business:
Strengthening HealthSystems To Improve Health
Outcomes: WHO's Framework For Action.Geneva, Switzerland, WHO.
Yin, R. K. 1994. Case Study Research: Design AndMethods. Second Edition.ThousandOaks, CA, Sage Publications.