Design Optimization of Stress Relief Grooves in Lever
Guide of Pressure Vessel for Food Processing
Yuichi Otsuka1*, Hamirdin Bin Baron2, Yoshiharu Mutoh3
1Top Runner Incubation Center for Academia-Industry Fusion, Nagaoka University of Technology,
Niigata, Japan
2Undergraduate School of Mechanical Engineering, Nagaoka University of Technology,
Niigata, Japan
3Department of System Safety, Nagaoka University of Technology, Niigata, Japan
Email: *otsuka@vos.nagaokaut.ac.jp
Received November 20,2011; revised February 7, 2012; accepted February 15, 2012
ABSTRACT
A stress relief groove is introduced in the R area and the stress is analyzed using a finite element method (FEM). Then the relief of the stress concentration in the vicinity of the pressure vessel is measured based on these results. When de-signing a stress relief groove, the lever must overhang the groove (L > 0). By introducing a stress relief groove to the R area, maximum stress on the lever guide can be reduced by 10%. This enables the reduction of the maximum stress (Mises stress) to be less than the fatigue strength. Furthermore, the location where maximum stress occurs on the lever guide changes in accordance with the clearance between the lever and lever guide. This identified the need to take into account the deviation factor such as design clearance in modeling process.
Keywords: Stress Relief Groove; Stress Concentration Factor; Finite Element Analysis; Pressure Vessel
1. Introduction
From the late 1980s, in preparation for the utilization of high-pressure processing in the Japanese domestic food industry, high-pressure processing was first utilized in the commercialization of jam and fruit juice drinks. Today, high-pressure food has become an increasingly familiar product as a result of the commercialization of highly- functional foods such as cooked rice in aseptic packaging and pressure-steamed brown rice. Research is currently being conducted with regards to the use of high-pressure treatment as a food-processing method, with the aim of improving the productivity and quality, as well as adding a hypoallergenic quality [1].
Experiments have proven that there are various bene-fits at pressures higher than 100 MPa (called ultra-high pressure in many cases); however, the cost of ultra-high pressure processing equipment is high and its production is small. Moreover, because operating the ultra-high pressure processing equipment requires specialized know- ledge or skills, such small-scale equipment for everyday use is not yet widely available. In addition, the develop- ment of new equipment requires advanced technical ca- pabilities and a definitive plan, and there are many other complications such as securing an appropriate sales chan-
nel as well as obtaining financial investment for high developmental and manufacturing costs.
With the conventional seal mechanism for ultra-high pressure equipment, a push-type structure for the cover, similar to that for a press, was used [1]. When this method is used, the structure of the vessel and lid is simple, and the structure is easily able to withstand ultra-high pressure. However, the cost of a press mechanism is high and its installation increases the overall size of the equipment. In order to reduce the cost and size, the seal method shown in Figures 1 and 2 was proposed. This consists of a cy- lindrical vessel with a cover at each end fitted with a gas-ket to maintain the pressure and the cover is closed by a lever, which ensures that a firm seal is established. In the upper part of the vessel, the lever is inserted into the lever guide that has been processed using a wire cut (EDM).
Using this structure, a concentration of stress [2] oc- curs in the vicinity of the area R because of the contact between the lever and lever guide. The stress concentra- tions at the R area of the lever guide will easily become the origin of fracture. Therefore, it is vital to implement a design that eases the stress in the vicinity of the R area.
Figure 1. Pin-arm sealed pressure vessel structure for food
processing. Figure 2.Upper view of pressure vessel.
r
(lever contact area) are shown in Table 2. (a) (b)
Figure 3. Conventional (a) and with stress relief groove design (b) at the corner side of lever guide. (a) Without groove;(b) With groove.
2. Examination of the Optimal Groove
Shape Using 2-D Analysis
In order to select an optimal shape for the stress relief groove, a simplified 2-D model of the pressure vessel was created and analysis was carried out using this model.
2.1. Examination of the Optimal Groove Shape Using 2-D Analysis
The commonly used FEM program MARC/MENTAT was used in this analysis. We analyzed the data using 2-D elasticity, and three contact point stress elements were used.
Figures 4-6 show the boundary parameters and FEM model used in this analysis. The FEM model was cut in half longitudinally to obtain a cross-section and four models were created. One was a conventional shape without a groove, and the other three had semicircular grooves of radii 1, 2 and 3 mm, respectively. The friction between
[image:2.595.61.532.72.478.2]the lever guide and lever was defined, and the Lagrange friction algorithm was used to define the friction behavior. Table 1 shows the values for the properties of the material used in the analysis model. To simulate a highpressure during the operation of the equipment, a step-shaped mov- ing velocity, Vy= 0.35 m/s, was provided to the rigid lever
in the y direction. This moving velocity is an assumed value when the pressure is increased to 200 MPa.
2.2. 2-D Analysis Results
2.2.1. Mises Stress and Maximum Principal Stress Distribution
[image:2.595.315.529.84.274.2]Figure 4. 2-dimentional FEM model of lever gu e. The model id
is half of the upper side because of its symmetric structure. Figure 5.Boundary conditions of the FEM model l.
(a) (b)
ith groove a (r = 3 mm).
[image:3.595.111.235.86.189.2]n Coefficient
[image:3.595.105.497.192.384.2]Figure 6. Detailed meshing conditions around the root of corner or groove. (a) Without groove; (b) W
Table 1. Material properties of JI SUS630 used for the lever guide.S
Young’s Modulus Poisson’s Ratio Density Frictio
JIS SUS630 205 GPa 0.3 7800 kg/m3 0.2
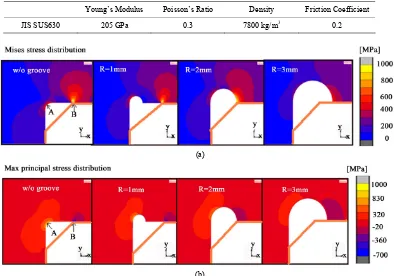
(a)
ss distributions
(relat-(b)
Figure 7. Effect of radius r for stress concentrating conditions a nd the contact point. (a) Mises stre ing to plastic deformation); (b) Max principal stress distributions (relating to brittle fracture).
[image:3.595.108.502.430.706.2]in the model wi
in
verhang Range L and Stress Distribution
nge L and th e created models having dis-
Mises Stress [MPa] Max Principal Stress [MPa]
maximum stresses becomes higher according to the in-crease of the groove radius from 1 to 3 mm.
Table 2 shows that the Mises stress at points A and B and the maximum principal stress at point A
[image:4.595.308.538.127.266.2] [image:4.595.215.537.306.727.2]th a 3 mm groove radius. The maximum stress becomes 60% less than that of the model without a groove. The maximum principle stress at point B in the models with 2 mm and 3 mm groove radii are approximately 90% less than that of the conventional model and/or the model with a 1 mm groove radius. The results indicate that the location of the lever contact edges have a significant ef- fect on the stress on the inner surface of the lever guide.
Table 3 shows the result of maximum stresses at the root of grooves in the cases of eclipse shape.
Interest-gly, stresses show their lowest values in the cases of t = b, which means the groove shape is half circle. The reason is not clear. Probably the changes in contacting area between the lever guides and the lever can affect the stress concentration conditions.
2.2.2. Relation between O
To examine the relation between the overhang ra e stress distribution, w
tances from the lever edge to the lever contact edge (over- hang) L of 4, 2, 0 and −2 mm, and analyzed the stress data. The results of the analyses for the Mises stress and maximum stress distribution are shown in Figure 8. The results show that there is no significant change in the magnitude of stress at both point A and point B for the models with L = 0, 2 and 4 mm, but for the model with L = −2 mm, there is concentrated compressive stress. We believe that when the overhang is L < 0, the stress is concentrated at the contact edge, and thus the concen- trated compressive stress is seen only in the model with L = −2 mm.
Model
A B B
Without groove 667 1742 788 –705
Groove, r = 1 mm 508 1614 621 –664
Groove, r = 2 mm 426 960 507 –37
Groove, r = 3 mm 255 526 302 –17
d m incip ess in cases o se
shape grooves.
[image:4.595.307.539.308.583.2]2b; diameter Maxinum stress [MPa]
Table 3. Mises an ax pr al str the f eclip
Shape of eclipse t; depth,
t 2b Mises Stress Max Principal
1 2 539 473
1 1 766 601
0.5 2 592 656
2 4 667 332
2 2 507 426
1 4 1011 475
3 6 557 262
3 3 513 350
1.5 6 869 363
[image:4.595.78.539.324.722.2]Therefore, when selecting the profile of the stress re-lief groove, the overhang L has to be greater than 0 in order to reduce the compressive stress on the inner surface of the lever guide, and thus we chose a stress relief groove with radius r = 3 mm (L = 0).
3. 3-D Analysis
[image:5.595.320.526.84.259.2] [image:5.595.314.534.296.381.2]We performed 3-D analysis to measure the stress at the six locations where stress concentration is predicted dur-ing the pressurization of the pressure vessel as shown in Figure 9: points F, H, E, and C on the inner side of the lever guide; and points G and D on the outer side of the lever gu
oove and Model 2 with a 3-mm s selected based on 2-D analysis
each lever guide, which means that the lever was inserted into the center of the lever guide space.
e of th
pa-ra
Groove Fi
ide.
3.1. 3-D Analysis Method and Model
Stress analysis was performed for Case 1 and Case 2 below, as shown in Figures 10 and 11, respectively.
1) Case 1
Model 1 without a gr radius groove, which wa
were compared. The stress concentration relief obtained by using the stress relief groove was investigated. The maximum tolerance for the machining dimensions be-tween the lever and lever guide was 0.6 mm. In Case 1, a fit tolerance of 0.3 mm was set for the inner side and outer side of
2) Case 2
In Case 2, stress analysis was performed on the R area when, using the dimensional tolerance of the lever, the lever made contact with the surface of the outer sid
[image:5.595.312.535.419.509.2]e lever guide with a clearance of 0.6 mm from surface of the inner side (model 3) and when the lever made contact with the surface of the inner side of the lever guide with a clearance of 0.6 mm from the surface of the outer side (model 4). Model 3 and model 4 are shown in Figure 11.
The dimensions of the 3-D model are shown in Figure 9. The analysis was performed using 3-D elasticity, and four contact point stress elements were used, as shown in Figure 9. Figure 12 shows the model and boundary
meters for the 3-D analysis. The friction conditions and e values for the material properties were the same as th
those for the 2-D analysis. The numbers of elements are as the follows; Model 1 = 103,389, Model 2 = 102,706, Model 3 = 103,528, Model 4 = 103,528, respectively.
3.2. 3-D Analysis Results
3.2.1. Case 1: Effect of Stress Concentration Relief by the
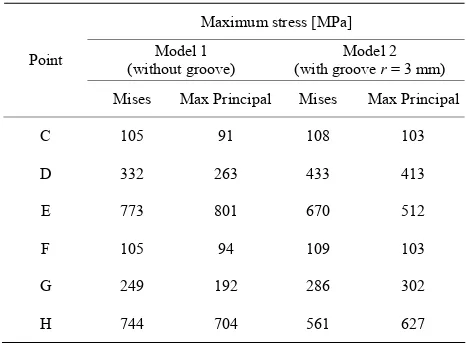
gure 13 shows the Mises stress distribution for model 1 without a groove in Case 1. The stress values for points C, D, E, F, G, and H are shown in Table 4.
Figure 9. 3-dimensional finite element model of pressure vessel. Red circles show possible initial failure point.
Figure 10. Models for case l. Conventional model (model 1) and with stress relief groove 3 mm model (model 2).
Figure 11. Models for case 2. Clearance 0.6 mm at outer side (model 3) and inner side (model 4) of the vessel.
[image:5.595.315.530.546.701.2]Figure 13. Mises stress distribution of Model 1.
Table 4. Stress analysis result for case 1; effect of stress relief grooves for reducing maximum stresses.
Maximum stress [MPa]
Model 1 (without groove)
Model 2 (with groove r = 3 mm) Point
Mises Max Principal Mises Max Principal
C 105 91 108 103
D 332 263 433 413
109 103
G 249 192 286 302
H 744 704 561 627 E 773 801 670 512
F 105 94
When the vessel is pressurized, the lever is subjected to a bending moment and because the R area for point E and point H acts as a fulcrum for a lever-bending defor- mation, it is evident from Figure 13 and Table 4 that the stress is greater at points E and H than at points C, D, F, and G. If model 1 and model 2 are compared, the stress on the R area is reduced by approximately 10% by in- troducing a groove with a 3-mm radius to the R area at
points ial is
700 MPa [5], and therefore the durability can be ex-
3.2.2. Case 2: Relation between Clearance and Maximum Stress
Th es stres and th
stress distribut is sim
ure 13. The s s ,
are s wn in T 5.
In model 3 when the lever makes contact with the sur-face of the inner side o e, the s is grea at poin , H, E, C on th rface o
ner side and is poi G, D on the surface E and H. The fatigue strength of this mater
pected to be 107 cycles.
Locations
e Mis s d on
ion for Case 2
istributi e max rincipal ilar as shown in
Fig-imum p
tress values for point C, D, E F, G, and H
ho able
f the lever guid stres ter ts F
less at and
nts
e su f the in-of the
Model 3
(outer side clearan ) (inner side clearance) Model 4
Point ce
Mises Max Principal Mises Max Principal
C 202 191 104 111
D 237 200 653 542
E 795 805 621 636
F 159 165 104 113
G 236 195 642 514
H 783 796 583 601
). The
maxim n addition, it can be
H, E, and C on the surface of the in
oints of stress cannot be considered because th occurs on the surface of the inner side fracture test the fracture origin nt on the oute his ex-
presses a req erin as
deviated from ac n se
using the FEM i sis
T calculated results been duced he desi of modi vessel he mo d one c de-
mon ate high 6] expe ntal
result can clea emons ffectiveness ress relie rooves we designe
4. Conclusions
The selection optim ape to support the lop- ment of high-pressure contai ers for use in high-pressure
um stress (M
3) The location where maximum stress occurs on the outer side than that in Case 1 (clearance 0.3 mm
um stress exists at point E. I
seen that for model 4 when the lever makes contact with the surface of the outer side of the lever guide, the stress is greater at points G and C on the surface of the outer and is less at points F,
ner side. The maximum stress is at point D.
Based on the results, the clearance between the lever and lever guide is an important factor in determining the points of maximum stress (Mises stress and maximum principal stress). When the clearance is not taken into ac- count, a countermeasure for those p
e maximum stress . However, even in a is prese r side. T uirement for consid g how the model h
the model
tual conditio ng for fracture
s of u analy
, even when .
he have intro into t
gn str
fied er stress to
and t fracture [ difie . This ould rime rly d trate the e of st
f g d.
of the al sh deve
n
processing of food was implemented using finite element analysis. The main results are the follows;
1) When designing a stress relief groove, the lever must overhang the groove (L ≥ 0).
2) By introducing a stress relief groove to the R area, maximum stress on the lever guide can be reduced by 10%. This enables the reduction of the maxim
[image:6.595.55.288.289.461.2]lever guide changes in accordance with the clearance be-tween the lever and lever guide. This identified the need to take into account the deviation factor such as design clearance in modeling process.
5. Acknowledgements
One of the authors (Y.O.) was partially supported by the Top Runner Incubation System through the Academia- Industry Fusion Training in the Promotion of Independent Research Environment for Young Researchers, MEXT, Japan. The authors also appreciate the critical advice of Assoc. Prof. Yukio Miyashita at Nagaoka University of Technology. This research was financially supported by JST project “Development of Technology for Promoting Food Quality”.
REFERENCES
[1] Y. Kishi, “High Pressure Processing Equipment for Food
and Biotechnology Fields,” Kobe Steel Engineering Re-port, Vol. 158, No. 2, 2008, p. 25.
[2] Y. Murakami, “Concept of Stress Concentrations,” Yok-endo Limited, Tokyo, 2005.
[3] Y. Kondo, M. Kubota and S. Kataoka, “Effect of Stress Relief Groove Shape on Fretting Fatigue Strength and Index for the Selection of Groove Shape,” Journal of the Society of Materials Science, Vol. 56, No. 12, 2007, pp. 1156-1162. doi:10.2472/jsms.56.1156
[4] J. Fish and T. Belytschko, “A First Course in Finite Ele-ments,” John Wiley & Sons, New York, 2007.
doi:10.1002/9780470510858
[5] D. Nie, Y. Otsuka and Y. Mutoh, “Fatigue Behaviors of Smooth and Notched SUS630 Stainless Steel Specimens”, Proceeding of 12th Fractography Symposium, Roskilde, December 2010.
[6] Y. Otsuka, J. Fujii, M. Takato and Y. Mutoh, “Fail-Safe Design by Outer Cover of High Pressure Vessel for Food Processing,” Open Journal of Safety Science and Tech-nology,Vol. 1, No. 3, 2011, pp. 89-93.