A STUDY ON AMBIENT AND TRAFFIC NOISE POLLUTION IN VIJAYAWADA,
*
Ramakrishna, V., Ashwani, D.
Civil Engineering Department, LBR College of Engineering, Mylavaram, Krishna District, Andhra Pradesh, India
ARTICLE INFO ABSTRACT
The noise levels are increasing beyond the permissible limits at many cities due to rapid urbanization and its related activities.
of hearing, annoyance, psychological impacts. Increased traffic in all the cities is becoming the major source of noise pollution. The ambient and traffic noise levels are studied
Sampling is done for 10 hrs from 7am
Ambient noise levels are beyond the permissible limits at the urban locations sampled based on Lavg, L10, L50, L90, Leq, NPL, NC parameters.
residential, commercial, industrial, and silent zones. Simultaneously, sound levels are collected and analyzed based on traffic flow, Lavg, L10, L50, L90, Leq, TNI, NC parameters. It is noted that, hi noise levels are recorded
vehicular flow at the sampling locations.
Copyright©2017, Ramakrishna et al. This is an open access article distributed under the Creative Commons Att distribution, and reproduction in any medium, provided the original work is properly cited.
INTRODUCTION
Noise is unwanted sound that is harmful, annoying, causes disturbance and may adversely impact the work efficiency and hearing. Increased activities and needs in modern urban life are causing severe noise pollution. Noise pollution due to automobiles is a major source of pollution in urban areas. growing vehicle population in urban regions in the recent years, has resulted in tremendous increase in traffic on roads causing alarming noise pollution, besides air pollution. Traffic noise is affected by factors like traffic volume, vehicle mix, pavement type and vehicle condition (Marathe, 2012). Noise level increases with traffic volume in an exponential manner and depends on several parameters such as source, medium, vehicle speed, road conditions, distance from source etc. (Vilas and Nagarale, 2013, Suhas and Adavi, 2015). Hence, the overall noise is dependent on the characteristics of the vehicle and the relative proportions of the vehicle types included in the flow. People generally hear sounds between the “threshold of hearing” and the “threshold of pain”. In terms of pressure, this is 20 μPa – 20 kPa (Garg, 2014). Noise level is measured in terms of decibels (dB). The Noise levels are measured using a sound level meter and calculated values such as L10
are used to estimate equivalent value of sound level (Leq) while Traffic Noise Index (TNI), Noise Climate (NC), Noise
*Corresponding author: Ramakrishna, V.,
Civil Engineering Department, LBR College of Engineering, Mylavaram, Krishna District, Andhra Pradesh, India
ISSN: 0975-833X
Article History:
Received 07th April, 2017
Received in revised form 10th May, 2017
Accepted 20th June, 2017
Published online 26th July, 2017
Citation: Ramakrishna, V., Ashwani, D., Durga, M.
Vijayawada, Andhra Pradesh, India”, International Journal of Current Research
Key words:
Noise Pollution, Traffic noise, Ambient noise, Noise parameters, Traffic flow.
Available online at http://www.journal
RESEARCH ARTICLE
A STUDY ON AMBIENT AND TRAFFIC NOISE POLLUTION IN VIJAYAWADA,
ANDHRA PRADESH, INDIA
Ashwani, D., Durga, M. N. V., Vamsikrishna, D. and Ramkumar,
Department, LBR College of Engineering, Mylavaram, Krishna District, Andhra Pradesh, India
ABSTRACT
The noise levels are increasing beyond the permissible limits at many cities due to rapid urbanization and its related activities. Increased noise levels beyond limits result in reduced work efficiency, loss of hearing, annoyance, psychological impacts. Increased traffic in all the cities is becoming the major source of noise pollution. The ambient and traffic noise levels are studied
Sampling is done for 10 hrs from 7am-9am, 10 am-12 noon, 1pm
Ambient noise levels are beyond the permissible limits at the urban locations sampled based on Lavg, L10, L50, L90, Leq, NPL, NC parameters. Traffic flow is measured at four locations representing residential, commercial, industrial, and silent zones. Simultaneously, sound levels are collected and analyzed based on traffic flow, Lavg, L10, L50, L90, Leq, TNI, NC parameters. It is noted that, hi noise levels are recorded at high traffic flows. The 2-and 3-wheelers are contributing to 69% of vehicular flow at the sampling locations.
is an open access article distributed under the Creative Commons Attribution License, which distribution, and reproduction in any medium, provided the original work is properly cited.
Noise is unwanted sound that is harmful, annoying, causes disturbance and may adversely impact the work efficiency and hearing. Increased activities and needs in modern urban life are causing severe noise pollution. Noise pollution due to major source of pollution in urban areas. Fast growing vehicle population in urban regions in the recent years, has resulted in tremendous increase in traffic on roads causing alarming noise pollution, besides air pollution. Traffic noise is ctors like traffic volume, vehicle mix, pavement type and vehicle condition (Marathe, 2012). Noise level increases with traffic volume in an exponential manner and depends on several parameters such as source, medium, vehicle ce from source etc. (Vilas and Nagarale, 2013, Suhas and Adavi, 2015). Hence, the overall noise is dependent on the characteristics of the vehicle and the relative proportions of the vehicle types included in the flow. the “threshold of hearing” and the “threshold of pain”. In terms of pressure, this 20 kPa (Garg, 2014). Noise level is measured in terms of decibels (dB). The Noise levels are measured using a sound level meter and calculated values such as L10, L50, L90, are used to estimate equivalent value of sound level (Leq) while Traffic Noise Index (TNI), Noise Climate (NC), Noise
Civil Engineering Department, LBR College of Engineering, District, Andhra Pradesh, India.
Pollution level (NPL) are used to analyse the variation of sound levels. The Leq value, can also be estimated using the formulae outlined in litearture (Marathe, 2012, Swain and Shreerup, 2013, Garg, 2014). Leq denotes th
the level of sound in decibels on scale A which is relatable to human hearing (CPCB, 2016). Leq on an energy basis is not sufficient to describe the degree of annoyance caused by fluctuating noise. NPL is used to assess noise pol
this regard (Marathe, 2012). TNI indicates the degree of variation in a traffic flow, expressed in dB (A) while NC is the range over which the sound levels are fluctuating in an interval of time. TNI includes the range of the noise climate,
24 hours, together with a smaller contribution from the 90% level representing the average background that is an absolute value. This combination is multiplied by four in order to eliminate the need for fractional quantities, and 30 units of TNI are subtracted merely to yield a convenient numerical scale (Langdon and Scholes, 1968). The Noise Pollution (Regulation and Control) Rules, 2000 prescribed the permissible limits of noise levels for different urban areas under Indian conditions
[image:1.595.343.525.742.804.2](CPCB, 2016, Doshi et al., 2015) and are given in the Table
Table 1. Prescribed ambient noise limits in India
Area category Day time Industrial area Commercial area Residential area Silence zone
International Journal of Current Research
Vol. 9, Issue, 07, pp.53943-53951, July, 2017
Ramakrishna, V., Ashwani, D., Durga, M. N. V., Vamsikrishna, D. and Ramkumar, T. 2017. “A study on
International Journal of Current Research, 9, (07), 53943-53951.
Available online at http://www.journalcra.com
A STUDY ON AMBIENT AND TRAFFIC NOISE POLLUTION IN VIJAYAWADA,
and Ramkumar, T.
Department, LBR College of Engineering, Mylavaram, Krishna District, Andhra Pradesh, India
The noise levels are increasing beyond the permissible limits at many cities due to rapid urbanization Increased noise levels beyond limits result in reduced work efficiency, loss of hearing, annoyance, psychological impacts. Increased traffic in all the cities is becoming the major source of noise pollution. The ambient and traffic noise levels are studied in and around Vijayawada. 12 noon, 1pm-3 pm, 4pm-6 pm, 7 pm-9 pm. Ambient noise levels are beyond the permissible limits at the urban locations sampled based on Lavg, Traffic flow is measured at four locations representing residential, commercial, industrial, and silent zones. Simultaneously, sound levels are collected and analyzed based on traffic flow, Lavg, L10, L50, L90, Leq, TNI, NC parameters. It is noted that, high wheelers are contributing to 69% of
ribution License, which permits unrestricted use,
Pollution level (NPL) are used to analyse the variation of sound levels. The Leq value, can also be estimated using the formulae outlined in litearture (Marathe, 2012, Swain and Shreerup, 2013, Garg, 2014). Leq denotes the time weighted average of the level of sound in decibels on scale A which is relatable to human hearing (CPCB, 2016). Leq on an energy basis is not sufficient to describe the degree of annoyance caused by fluctuating noise. NPL is used to assess noise pollution level in this regard (Marathe, 2012). TNI indicates the degree of variation in a traffic flow, expressed in dB (A) while NC is the range over which the sound levels are fluctuating in an interval of time. TNI includes the range of the noise climate, over the 24 hours, together with a smaller contribution from the 90% level representing the average background that is an absolute value. This combination is multiplied by four in order to eliminate the need for fractional quantities, and 30 units of TNI are subtracted merely to yield a convenient numerical scale (Langdon and Scholes, 1968). The Noise Pollution (Regulation and Control) Rules, 2000 prescribed the permissible limits of noise levels for different urban areas under Indian conditions ., 2015) and are given in the Table-1.
Prescribed ambient noise limits in India
Limits in dB (A), Leq
Day time Night time
75 70
65 55
55 45
50 40
INTERNATIONAL JOURNAL OF CURRENT RESEARCH
Note:
Day time: 6 a.m. to 10 p.m. Night time: 10.00 p.m. to 6.00
a.m.
Silence zone is an area comprising not less than 100 metres
around hospitals, educational institutions, courts, religious places or any other area which is declared as such by the competent authority. Use of vehicular horns, loudspeakers and bursting of crackers shall be banned in these zones.
Mixed categories of areas should be declared as one of the
four above mentioned categories by the Competent Authority and the corresponding standards shall apply
dB(A) Leq denotes the time weighted average of the level
of sound in decibels on scale A which is relatable to human hearing.
Mishra et al., (2008) studied the adverse impacts of noise on
male and female population comprising of different age groups in Roorkee. The analysis indicated that automobiles and loud speakers are major sources of noise pollution. Significant adverse impacts such as effect on hearing, interference with communication, annoyance, sleep disturbance, deafness, are noticeable from the respondents. Public awareness and education are some of the probable solutions suggested for mitigating the problems. Vidyasagar and Nageswar Rao (2006) studied ambient noise levels in Visakhapatnam, an industrial and sea port city in coastal Andhra Pradesh. Ambient noise levels measured at six different locations representing residential, industrial, commercial, and silence zones indicated
high sound levels which is alarming. Ambika et al. (2015)
mapped noise levels in Mumbai, which is considered as commercial capital of India with massive development projects pertaining to infrastructural and commercial sectors that will be continuing on a regular basis, and observed that the noise levels in the city, on the whole, were very high and above the
permissible limits. Balashanmugam et al., (2013) studied the
ambient sound levels in Chidambaram at various locations and found that they are higher than permissible limits. Vehicular traffic and air horns are found to be the main reasons for these high noise levels. Sundarakumar (2011) studied ambient noise levels in Vijayawada, a commercially busy city located along Krishna river in Andhra Pradesh. Thirty four noise samples analyzed in urban and rural areas indicated that the noise levels are elevated in urban areas compared to suburban areas.
Balashanmugam et al. (2013) studied the noise levels at
different locations belonging to four zones viz., residential, commercial, industrial and silence, in Cuddalore, Tamilanadu and opined that the ambient noise levels are exceeding the prescribed limits. Rapid and unplanned urbanization resulting in great influx of people from all parts of the region and country, improper management of town roads and traffics, lack of sufficient parking spaces and exponential growth of both private and public vehicles in the city are identified as the major reasons.
Traffic Noise
Noise descriptors such as L10, L50, L90, Leq, TNI, and NC are used (Swain and Shreerup, 2013) as indicators to assess the extent of noise pollution due to the traffic flow. Traffic flow at a particular time, Road surface type and it condition, Vehicle condition are the factors identified (Marathe, 2012) for increased noise levels. Annoyance, disturbance, interference to sleep and speak, reduced work efficiency, deafness, cardiovascular impact and increased blood pressure on long
exposure are some of the adverse impacts identified due to traffic noise pollution (Marathe, 2012). Traffic flow is usually represented in terms of Passenger Car Unit (PCU), which
represents the same impact that a mode of transport has on
traffic variables (such as headway, speed, density) compared to a single car (Wikipedia, 2017). Traffic noise levels are often
correlated with PCUs (Tandel et al., 2011, Swain and Shreerup,
2013, Vilas and Nagarale, 2013). Noise level in 12 different
major intersection points of Baripada town is measured and analyzed (Swain and Shreerup, 2013) during four different specified times. The equivalent noise levels of all the 12 squares were found to be much beyond the permissible limit during day time. Kavita (2014) studied the noise levels due to vehicular traffic, counted the traffic flow, in peak hours during morning and evening at Akola, and observed that noise levels are very high beyond permissible limits and is predominantly caused due to a very high number of two wheelers. Mondal (2013) studied the vehicle origin noise at twelve different locations in Burdwan during specific time intervals and observed that noise levels are beyond the permissible limits. Based on the survey conducted through a questionnaire related to public health, he inferred that irritation, mental stress, annoyance, sleep loss are some of the adverse impacts caused
due to increased noise pollution. Anurag et al., (2013) noticed
that the sound levels due to railway and vehicular traffic in Amaravati, Maharashtra, India are 1.5 times the permissible limits of the designated zone and felt an urgent need to control the sound levels.
Zuhdi and Husein (2012) observed higher values of urban
traffic noise levels in Palestinian city of Hebron. Ozer et al.
(2009) observed high traffic noise levels in fifty out of sixty five sampling locations in Tokat city of Turkey during evening
hours and is alarming. Xie et al. (2013) developed a traffic
noise prediction model based on traffic volume and distance of source from sampling point and compared the predicted values
with that of measured values. Tandel et al. (2011) developed
linear regression model for prediction of noise level in Surat based on PCU, building height along road side and open space for the road section considered. They concluded from the model that significant contribution to the noise levels are two-and three-wheelers in the city. Mondal (2013), Swain two-and Shreerup (2013) used statistical analysis for evaluation of the noise in their studies. Sundarkumar (2011) plotted spatial distribution of noise levels at Vijayawada. It can be inferred that increased noise pollution due to traffic flow is a serious problem at both National and International arena.
Study Zone
study of ambient noise levels at few prominent locations in the city and (ii) study of noise levels due to traffic flows in the city. The study is taken up in March-April 2017 with the following objectives:
To study the ambient noise levels at different traffic
sections.
To calculate the traffic volume.
To estimate the equivalent noise levels due to the traffic
volume.
To analyze the noise levels using Lavg, Leq, L10, L50,
L90, NC, NPL and TNI
To compare the noise levels with the permissible limits
[image:3.595.37.288.434.534.2]Sound levels are determined using Digital Sound Level Meter with a measuring range of 30~130dBA ±1.5dB decibel accuracy. The traffic volume data is collected during 7-9 AM, 10AM-12 Noon, 1-3 PM, 4-6 PM, 7-9 PM. Sound levels are recorded simultaneously for every 2 minutes interval. Same time periods and sampling interval are followed for determining ambient noise levels. Nine locations are identified (Refer Table-2) for determining ambient noise levels and four locations are selected (Refer Table-3) on the basis of different land use like commercial, industrial, silent and residential zones for determination of traffic volume data and subsequent noise levels. Traffic volume is assessed on two days to minimize errors in assessment. Vehicles are graded as two-, three-, four- wheelers and others. The percentage contribution of these vehicle categories during sampling duration is computed.
Table 2. Sampling locations for determining Ambient Noise Levels
S. No Classification Area Location
1 Residential Zone Satyanarayana Puram Vijayawada
2 Mylavaram Mylavaram
3 Ramavarappadu Ramavarappadu
4 Commercial Zone Benz Circle Vijayawada
5 Krishna Lanka
6 Bhavani Puram
7 Mogalraj Puram
8 Ramavarappadu Ring Ramavarappadu
9 Silence Zone Near Ramesh Hospital Vijayawada
Table 3. Sampling locations for determining Traffic flow and noise levels
S. No Classification Area Location
1 Industrial Zone NTTPS 2nd Gate Ibrahimpatnam
2 Commercial Zone Chitti Nagar Vijayawada
3 Residential Zone Milk Project
4 Silence Zone LBRCE College Mylavaram
Parameters used in the analysis
The parameters that are used in the analysis are L10, L50, L90 which represent the sound level in dB (A) that exceeded during 10%, 50%, 90% of the measuring time respectively. NPL and NC are used to analyze the noise level distribution. The Leq value can be obtained (Marathe, 2012, Swain and Shreerup, 2013) from the above values using following equation:
Leq = L50 + (L10-L90)² / 56 --- (1)
The parameters such as TNI and NC can be estimated (Marathe, 2012, Swain and Shreerup, 2013) using the following equations:
NC = L10-L90 --- (2)
NPL = Leq + (L10-L90) --- (3)
Alternately the Leq value can be estimated (Garg, 2014) based on the sampled sound levels using following equation
Leq = Lavg = 20 log10 (1/n) ∑ 10 (Li/20) --- (4)
The L10, L50, L90 values for traffic noise level estimation are computed (Swain and Shreerup, 2013) as-
L10 = 61 + 8.4 Log (Q) + 0.15P – 11.5 Log (d) --- (5)
L50 = 44.8 + 10.8 Log (Q) + 0.12P – 9.6 Log (d) --- (6)
L90 = 39.1 + 10.5 Log (Q) + 0.06P – 9.3 Log (d) --- (7)
Where, Q = vehicles flow per hour. P = percentage of heavy vehicles in %.
d = Distance from c/c of the road to source of receiver in meters.
TNI = 4 (L10-L90) + L90 – 30 dB (A) --- (8)
The values of Leq, NC are determined for traffic flow condition using Equations 1-2.
RESULTS AND DISCUSSION
Ambient noise levels
The ambient noise levels are measured at 9 different locations (Refer Table-2) for a total of 600 minutes between 7 am to 9 pm as mentioned earlier at a sampling interval of 2 min while a sampling interval of 5 min. is used at Benz circle and Krishna Lanka points. The details are plotted on a graph with sound levels on X-axis and % time exceeding sound levels on Y-axis. The noise parameters of L10, L50 and L90 values are obtained from the graph. The Leq, NPL, and NC are calculated using equations 1-3. Alternately, the average sound level during sampling period is calculated using equation-4. The obtained values are compared with the permissible limits specified by the IS code for the appropriate zone. The sample graph obtained for sound levels recorded at Bhavanipuram is shown in Fig.1. The L10, L50, and L90 values in dB (A) can be obtained from Fig.1 as 78.1, 71.3 and 66 respectively. The Leq, NPL, and NC values in dB (A) are calculated as 73.7, 85.8, and 12.1 respectively using equations 1-3. The average sound levels based on all sampling values covering 600 minutes of sampling is calculated as 71.8 dB (A) using equation 4. The Bhavanipuram sampling location is categorized as commercial zone and hence the obtained Leq and Lavg values are compared with the prescribed limit of 65 dB (A) for day activities. In a similar manner, graphs are plotted for the values obtained at all the locations, relevant noise parameters are calculated and are summarized in Table-4. The Leq values obtained are compared with permissible noise limits and are given in Fig.2. The following observations are drawn from Table-4 and Fig.2 with respect to ambient noise levels:
The obtained Leq value is higher than the permissible limit
The Lavg value gives an approximate value based on sampling values of sound levels. It is close to the value obtained Leq value. The Leq value is however is more reliable, as it takes into account the variation in sound levels in the form of L10, L50 and L90.
Fig.1. Ambient noise levels at Bhavanipuram
The NC values are low and in the range of 9-23, which
indicates the variation of sound levels in the region. It should be noted that L90 indicates the background sound level and L10 indicates the 10% time exceeding sound levels. The sound level fluctuation in two locations viz., Benz circle and Krishna Lanka is low with as high as 72-74 dB (A) background sound levels prevailing.
At Ramavarappadu, the NC value is 23.1 dB (A)
indicating a low background sound level of 34.2 dB (A) and reaches high to 57.3 dB (A). It is a suburban area and hence the noise levels are slightly less than the permissible limits.
Mogalrajapuram, is a commercial zone, where continuous
movement of vehicle flow is taking place. A high L10 sound level of 92.5 dB (A) is recorded where as the background sound level is only 71.1 dB (A), which clearly indicates the impact of traffic noise levels at the location.
Ramesh Hospital is a Cardiac hospital, where low sound
levels are mandatory. However, the sound levels near the hospital reaches a L10 value of 87.9 dB (A) and a background value of 69.2 dB (A), both are very high when compared with permissible limit of 50 dB (A). The drawback is the hospital located near a traffic junction, where the vehicles moving to and fro at the junction are creating high sound levels leading to severe ambient noise pollution in that area.
Mylavaram is a small village with around 45000
population and is located at a distance of 40 km from Vijayawada. The rural background of the area resulted in low Leq value of 51.2 dB (A) which is less than the permissible limit.
The Noise Pollution Level (NPL) values are very high
indicating severe noise distraction due to vehicular traffic in that area, which is alarming.
The suburban and rural areas sampled in the study are yet
to receive impact of urbanization and increased traffic flow resulting in low noise levels. Other locations are within the city and hence high noise levels are noticeable.
Fig. 2. Comparison of Leq values of ambient noise levels with permissible limits
Traffic noise levels
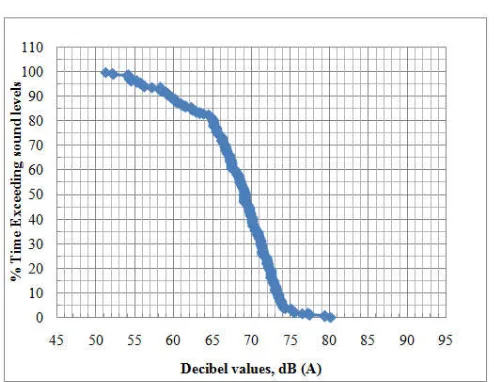
[image:4.595.43.301.58.284.2]The traffic noise levels are measured at four different locations representing industrial, commercial, residential and silent zones. The sampling is carried out in two days to reduce the bias. However, barring occasional sound levels at odd times, the results of sampling on these days are close to each other reflecting accurate work. The analysis is carried out in two ways: (i) from graph obtained by plotting sound levels measured during sampling (ii) from traffic flow considerations. In the first approach, the sound levels obtained during sampling are plotted on X-axis and % time exceeding sound levels on Y-axis. The L10, L50, L90 parameters are obtained from the graph. Leq value is calculated based on these parameters using equation-1. The TNI and NC are calculated using the above obtained L10, L50 and L90 values. The Lavg value is calculated using equation-4 from the sampled data for 10 hours of sampling time. In the second approach, the traffic flow is measured in terms of traffic flow ie., vehicles flow/hour by categorizing the vehicles into 2wheeler, 3 wheeler, 4 wheeler and others. The percentage distributions of these vehicle categories are calculated. The sound levels are assessed using L10, L50, L90, Leq, TNI, NC values which are determined using equations 1 and 5-8 respectively. The values are compared with that of standard values prescribed (Refer Table-1). A sample graph obtained at Milk project (Residential zone) for sampling on day-1 is shown in Fig. 3. The noise parameters such as L10, L50, L90 obtained from Fig.3 are shown in Column-1 of Table-5. The Table-5 indicates the following:
Table 4. Summary of ambient noise levels at sampling locations
Location Code Area Zone Sampling
time (min)
Sampling
interval (min) L10 L50 L90 Leq Lavg NPL N.C
L1 Benz Circle Commercial 565 5 82.2 79.5 74.9 80.4 79 87.7 7.3
L2 Krishna Lanka 360 5 81.3 78.9 72.3 80.3 75.1 89.3 9
L3 Bhavani Puram 600 2 78.1 71.3 66 73.7 71.8 85.8 12.1
L4 Mogalrajpuram 600 2 92.5 78.9 71.1 86.5 80 107.9 21.4
L5 Ramavarappadu Ring 600 2 87 75.2 67.9 81.3 76.7 100.4 19.1
L6 Ramesh Hospital Silent 600 2 87.9 76.9 69.2 82.7 77.9 101.4 18.7
L7 Satyanarayana Puram Residential
600 2 85.9 77.5 68.5 82.5 77.3 99.9 17.4
L8 Mylavaram 600 2 54.7 48.3 41.6 51.2 48.4 64.3 13.1
[image:4.595.41.557.323.431.2] Parameters such as Leq, TNI, NC are computed from L10, L50, L90 values using equations 1, 2 and 8 (Column-3).
The Lavg value is calculated using equation-4 (Column-3).
The L10, L50, L90 parameters are calculated from the
traffic flow considerations using equations 5-7 (Column-2).
Similarly, the other noise parameters such as Leq, TNI, NC
are computed (Column-2).
The same data is calculated for Day-1 (Columns 2-3) and
Day-2 (Columns 4-5).
The traffic flow parameters are collected on both the days of sampling and are given in Table-6. For convenience, the parameters are categorized as 2-, 3-, 4- wheelers and other vehicles. The percentage contribution of these vehicles is calculated. The total flow of vehicles per hour is calculated. The noise parameters L10, L50, L90 are calculated using equations 5-7, which incorporates the traffic flow and distance of sampling from the source in the equation for assessment. It
can be noted from Tables-5 and -6 that, the values obtained are in very close agreement with each other indicating accurate sampling and also similar traffic flow on both the days of sampling.
In a similar manner, the sound levels are measured at other
three locations (NTTPS 2nd Gate – Industrial zone, Near
[image:5.595.135.466.288.386.2]LBRCE campus Mylavaram – Silent zone and Chittinagar – Commercial zone) and analyzed. The NTTPS, a Thermal Power Station, 20 km from Vijayawada is considered as suburban Vijayawada, a very busy location with heavy vehicles movement for downloading of coal and/or loading fly ash for supply to different vendor requirements. The LBRCE campus in Mylavaram is located on Vijayawada-Bhadrachalam highway, which is currently expanded to 4-lane from existing 2-lane and is a very busy route 24 hours. The LBRCE campus, is a silent zone with respect to its designated activity, is considered to study noise levels in the present context.
Table 5. Summary of noise parameters at Milk Project
Parameter Day1 Day2
From traffic flow From graph From traffic flow From graph
(1) (2) (3) (4) (5)
L10 80.65 73.30 80.82 73.20
L50 71.80 69.20 71.89 69.40
L90 64.79 58.58 64.78 59.58
Leq 75.99 72.34 76.20 72.49
Lavg 67.98 67.98 68.14 68.14
TNI 98.23 84.46 98.94 84.06
NC 15.60 13.72 16.04 13.62
[image:5.595.90.515.419.517.2]All values in dB (A)
Table 6. Traffic flow variation at Milk Project
Timings Number of Vehicles
2W 3W 4W Others
Day1 Day2 Day1 Day2 Day1 Day2 Day1 Day2
7:00-9:00 (AM) 717 657 869 949 179 125 223 198
10:00-12:00 (AM-PM) 618 519 854 710 152 141 172 210
1:00-3:00 (PM) 306 250 582 419 96 105 70 79
4:00-6:00 (PM) 451 618 576 527 127 97 137 153
7:00-9:00 (PM) 117 262 90 110 85 74 56 112
Total 2209 2306 2971 2715 639 542 658 752
% of Vehicles 34.11 36.52 45.87 43.0 9.87 8.59 10.16 11.91
The total number of vehicles per 1 hour, Q = (6477/10) = 647.70 (Day1) The total number of vehicles per 1 hour, Q = (6315/10) = 631.50 (Day2) Distance from c/c of road to sampling location, d = 4m
Table 7. Traffic flow variation at Chittinagar
Timings Number of Vehicles
2W 3W 4W Others
Day1 Day2 Day1 Day2 Day1 Day2 Day1 Day2
7:00-9:00 (AM) 1356 1256 1012 1115 360 279 658 612
10:00-1200 (AM-PM) 1157 1006 972 912 215 324 552 495
1:00-3:00 (PM) 870 783 679 735 117 190 304 219
4:00-6:00 (PM) 1242 1123 1196 992 295 245 525 542
7:00-9:00 (PM) 1027 987 875 736 175 269 617 604
Total 5652 5155 4734 4490 1162 1307 2656 2472
% of Vehicles 39.79 38.40 33.33 33.45 8.18 9.74 18.70 18.41
The total number of vehicles per 1 hour, Q = (14204/10) =1420.40 (Day1) The total number of vehicles per 1 hour, Q = (13424/10) = 1342.40 (Day2) Distance from c/c of road to sampling location, d = 5.5m
Table 8. Summary of noise parameters at Chittinagar
Parameter Day1 Day2
Samples Graph Samples Graph
L10 81.76 92.50 81.52 92.50
L50 73.98 78.90 73.68 78.90
L90 66.43 71.20 66.16 70.90
Leq 77.89 86.46 77.61 86.67
Lavg 86.46 86.46 80.21 80.21
TNI 97.89 126.40 97.60 127.30
NC 15.33 21.30 15.36 21.60
[image:5.595.107.492.565.663.2] [image:5.595.161.440.711.800.2]Fig. 3. Traffic sound levels at Milk Project on Day-1
Chittinagar is a very busy commercial area, where city buses and State road transport buses will be plying continuously besides active business life in the location. The details are given in Tables 7-12.
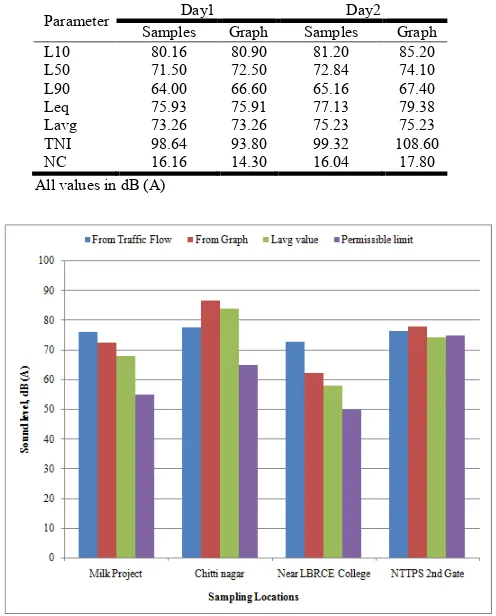
The Leq values determined at the four different locations on Day-1 and Day-2 based on traffic flow are logarithmically averaged. Similarly the Leq values determined using graphical method are logarithmically averaged. The Lavg values, computed using equation-4, obtained on Day-1 and Day-2 are also logarithmically averaged. All these values are compared with the permissible noise levels of that particular zone and shown in Fig.4. It can be noticed from Fig. 4 that all the values are higher than the permissible limits. It can be noted from the Fig.4 that the Leq values calculated using equations 5-7 and from equation-1 using graphical data are in close agreement while the Lavg values calculated using equation-4 are slightly lesser. The deviation is much wider in residential and silent zones indicating the significant impact of traffic flow on sound levels in the zones. In the silent zone, the sound levels obtained using traffic flow data are more dominant. The following observations are drawn from Tables-5-12 and Fig.4:
The sound levels in Industrial zone (NTTPS 2nd gate) are
[image:6.595.62.536.353.453.2]similar to that of the permissible limits. This indicates the high noise level production in that area due to heavy vehicle movement.
Table 9. Traffic flow variation near LBRCE College, Mylavaram
Timings Number of Vehicles
2W 3W 4W Others
Day1 Day2 Day1 Day2 Day1 Day2 Day1 Day2
7:00-9:00 (AM) 424 374 167 215 112 114 48 51
10:00-12:00 (AM-PM) 417 324 103 149 98 124 55 67
1:00-3:00 (PM) 221 242 75 94 103 97 94 93
4:00-6:00 (PM) 382 415 148 187 192 142 137 142
7:00-9:00 (PM) 212 195 79 87 108 134 147 164
Total 1656 1550 572 732 613 611 481 517
% Of Vehicles 49.85 45.45 17.219 21.47 18.45 17.92 14.479 15.16
[image:6.595.152.443.515.604.2]The total number of vehicles per 1 hour, Q = (3322/10) = 332.20 (Day-1) The total number of vehicles per 1 hour, Q = (3410/10) = 341.00 (Day-2) Distance from c/c of road to sampling location, d = 4m
Table 10. Summary of noise parameters at LBRCE College, Mylavaram
Parameter Day1 Day2
Samples Graph Samples Graph
L10 77.42 66.50 77.63 66.10
L50 67.98 58.20 68.19 57.10
L90 60.84 50.10 61.00 49.20
Leq 72.56 62.68 72.80 61.60
Lavg 58.28 58.28 57.58 57.50
TNI 97.16 85.70 97.52 86.80
NC 16.58 16.40 16.63 16.90
[image:6.595.76.521.644.743.2]All values in dB (A)
Table 11. Traffic flow variation at NTTPS 2nd Gate
Timings
Number of vehicles
2W 3W 4W Others
Day1 Day2 Day1 Day2 Day1 Day2 Day1 Day2
7:00-9:00 (AM) 734 689 315 434 527 624 410 427
10:00-12:00 (AM-PM) 357 542 294 367 318 396 160 193
1:00-3:00 (PM) 342 403 157 215 157 312 115 245
4:00-6:00 (PM) 635 947 426 476 492 684 384 478
7:00-9:00 (PM) 498 672 324 315 384 421 459 698
Total 2566 3253 1516 1807 1878 2437 1528 2.41
% Of Vehicles 34.27 34.11 20.246 18.95 25.08 25.55 20.406 21.40
The sound levels due to traffic are very high in Silent zone (LBRCE College). The ambient noise levels are also very high (62 dB (A)). However, this impact does not have a huge bearing on LBRCE campus as a good thick green cover is available in the campus which attenuates the noise levels. Further, the class rooms are 250-300 m away from the sampling location. The net impact of outside heavy traffic noise is not felt in the campus.
Table 12. Summary of noise parameters at NTTPS 2nd Gate
Parameter Day1 Day2
Samples Graph Samples Graph
L10 80.16 80.90 81.20 85.20
L50 71.50 72.50 72.84 74.10
L90 64.00 66.60 65.16 67.40
Leq 75.93 75.91 77.13 79.38
Lavg 73.26 73.26 75.23 75.23
TNI 98.64 93.80 99.32 108.60
NC 16.16 14.30 16.04 17.80
All values in dB (A)
Fig. 4. Comparison of average value of Leq, Lavg values with Permissible limits for traffic flow noise
The average ambient noise levels are higher in Chittinagar
(Commercial zone) than the traffic noise. The location is a pretty busy area with lot of commercial establishments and the movement of customers. The alarming issue here is the high noise value (86.6 dB (A)) beyond the permissible limits (65 dB (A)). The public are advised to adopt safe measures while moving in this area and try to minimize the exposure period to the high sound levels.
The Milk Project area is a residential area but the city bus
route passes through that area. Currently, district service buses are also diverted in the route due to the ongoing construction activities in the regular route. This necessitates the increased sound levels (76 dB (A)) due to traffic flow beyond the permissible limits. The ambient noise levels are also on higher side (72.42 dB (A)) indicating a minimum increase of 17 dB (A) of sound levels beyond permissible limits during day time. Though a Milk Project is located close to the sampling location, based on field assessment during sampling, lesser contribution is expected in the high sound levels of the location. The high sound levels in the locality certainly cause a lot of irritation and annoyance to the public staying the area.
The ranges of NC values at the locations are: 13.62 to
16.04 at Milk Project, 15.33 to 21.60 dB (a) at Chittinagar, 16.40 to 16.90 dB (A) near LBRCE, and 14.30 to 17.80
dB (A) at NTTPS 2nd gate. This information shows that,
the range of values between L10 and L90 is high or in other words, the background sound level at the location is differing by a large value that is indicated by NC.
The ranges of L10 values at these locations are: 73.20 to
80.85 dB (A) at Milk Project, 81.52 to 92.50 at Chittinagar, 66.10 to 77.63 dB (A) near LBRCE, and
80.16 to 85.20 dB (A) at NTTPS 2nd gate. The L10 values
represent the background noise levels at the location. It can be noted that, at all the locations, the L10 values are higher than the permissible limits which indicates a high background noise levels at these locations.
The ranges of TNI values are very high at all the four
locations: 84.06 to 98.94 dB (A) at Milk Project, 97.60 to 127.30 dB (A) at Chittinagar, 85.70 to 97.52 dB (A) near
LBRCE and 93.80 to 108.60 dB (A) at NTTPS 2nd Gate.
This indicates very high noise levels at all these areas, which is also evident from the high L10 values obtained.
It should be noted that, the noise parameters L10, L50,
L90 for traffic flow depend on traffic flow (Q) and distance from c/c of road to the sampling point (d). Higher the traffic flow, higher will be the noise levels while
higher values of ‘d’ indicate lesser values of noise values.
The average sound levels based on traffic flow at these
four locations are: 76.1 dB (A) at Milk Project, 77.75 dB (A) at Chittinagar, 72.68 dB (A) near LBRCE, and 76.55
dB (A) at NTTPS 2nd gate respectively. The corresponding
average traffic flow per hour (Q) value is: 640, 1381, 337 and 851 respectively. Comparing the sound level with the Q value, it is noted that, the highest sound values from traffic flow are recorded at Chittinagar. This trend however, is more evident when the average Leq values obtained from graph on both the days of sampling are compared. The average Leq values are: 72.42 dB (A), 86.56 dB (A), 62.16 dB (A), 77.82 dB (A) respectively at each of these locations. Hence, the following sequence is followed with respect to descending order of sound levels with respect to Q value: Chittinagar (1381, 86.56 dB (A)), NTTPS (851, 77.82 dB (A)), Milk Project (640, 72.42 dB (A)) and LBRCE (337, 62.16 dB (A)) respectively. This analysis reveals that sound levels from a location depends on traffic flow at the location and in other words, traffic flow is the major contributor of noise pollution in these locations.
The peak flows of traffic at the sampling locations are:
7am to 12 noon and 4-6 pm at Milk Project, LBRCE. The movement of public for office or schools/colleges will be more during this period. Almost continuous high traffic flow throughout the sampling period is observed at Chittinagar, as it is a very busy commercial area. At NTTPS, the peak hours are 7-9 am, 4-9 pm. This is understood from the fact that movement of heavy vehicles are restricted in peak hours while office or school going public will be travelling more during this period.
The major percentage contribution of the traffic flow is
from 2- and 3- wheelers compared with 4-wheelers and others (Refer Fig. 5). The ranges of percentage contributions of 2- and 3-wheelers at the sampling locations are: 79% at Milk Project, 73% at Chittinagar,
67% at LBRCE, 54% at NTTPS 2nd gate respectively. This
Balashanmugam et al (2011) also opined the movement of vehicles in narrow lanes and outdated vehicles, poorly managed vehicles are responsible for heavy noise in urban areas.
Fig. 5. Percentage distribution of vehicle flow at sampling locations
The 4-wheeler movement is high at NTTPS 2nd gate and
LBRCE with 25% and 18% respectively. Movement of heavy vehicle is very high at NTTPS, which is also located on Vijayawada-Bhadrachalam highway, for unloading of coal and/or procuring fly ash by the vendors for their requirements. Similarly, as LBRCE is located on the Vijayawada-Bhadrachalam highway, movement of heavy vehicles will be high compared to others.
69% of vehicular traffic in the sampled locations is from
2-, and 3-wheelers, only 14% of vehicles contribute towards the 4-wheeler movement (Refer Fig. 6). This clearly indicates that urban traffic is primarily composed of mainly 2- and 3-wheelers only and the movement of 4-wheelers such as buses, lorries, trucks etc is relatively less at the sampling locations.
Fig. 6. Overall percentage distribution of vehicle flow at all the sampling locations
Based on the study and the alarming results the following suggestions are made:
Phased elimination of diesel vehicles and replacing them
with alternate fuel such as gasoline or biodiesel which can operate an engine producing less noise than that of a diesel engine.
Avoiding traffic congestions by widening the existing
roads.
Construction of bye-pass roads for the heavy vehicles not to
enter into the city during day time.
Quickening of bye-pass constructions to avoid traffic
diversions and protect health and safety of public from noise pollution.
Use of greenery on the roads at lane dividers for sound
attenuation.
Diversion of traffic near silent zones such as hospitals,
schools, religious places, etc.
Provision of proper parking places for the vehicles. This is a
major problem that is causing a lot of traffic congestion in that area.
Traffic constables should be posted at all prominent
locations other than the junctions to regulate the traffic and reduce the noise levels.
Installation of continuous noise measurement units at
prominent locations in the city which will induce awareness on public.
Regular maintenance of the vehicles.
Monitoring and penalizing vehicles that are old and
emitting high noise.
Avoiding fancy air horns as they cause lot of distraction to
the traffic and increase the noise pollution.
Creating awareness to the public through hoardings, cinema
halls, print-audio-visual media about noise pollution and its impact on society.
Summary and Conclusion
The ambient and traffic noise levels are studied in and around Vijayawada. The results of ambient noise levels are analyzed based on Lavg, L10, L50, L90, Leq, NPL, NC parameters. Ambient noise levels are beyond the permissible limits at the urban locations sampled. Noise pollution due to traffic flow is studied. Traffic flow is measured at four locations representing
residential, commercial, industrial, and silent zones.
Simultaneously, sound levels are collected and analyzed using traffic flow, distance from sampling point to c/c of road, Lavg, L10, L50, L90, Leq, TNI, NC parameters. The results are compared with the permissible limits. The noise levels at all these locations are beyond the permissible limits. It is noted that, high noise levels are recorded at high traffic flows. The 2-, and 3-wheelers are contributing to 69% of vehicular flow at the sampling locations. Few suggestions are given to improve the situation.
REFERENCES
Ambika N. Joshi, Nitesh C. Joshi, Payal P. Rane, 2015. “Noise
Mapping in Mumbai City, India”. International Journal of
Innovative Science, Engineering & Technology, Vol. 2 Issue 3, March 2015, pp. 380-385.
Anurag V. Tiwari, Prashant A. Kadu, and Ashish R.Mishra 2013. “Study of Noise Pollution Due To Railway and Vehicular Traffic at Level Crossing and Its Remedial
Measures” American Journal of Engineering Research
(AJER) e-ISSN: 2320-0847 p-ISSN: 2320-0936 Volume-2, Issue-4, pp-16-19.
Balashanmugam, P., Nehrukumar, V., Balasubramaniyan, K. and Balasubramanian, G. 2013. “Effect of Road Traffic Noise Pollution in Cuddalore Town: A Case Study”,
[image:8.595.41.286.506.660.2]CPCB, 2016. Status of Ambient Noise Level in India.
Doshi Pratik, Prem Halani, Vinit Jasoliya, Madhur Jain, and Vinaya Sawant (2015). “Honking with Reduced Effect on
Noise Pollution”, International Journal of Advanced
Research in Computer and Communication Engineering,
Vol. 4, Issue 10, October 2015, pp.
Garg, S.K. 2014. Sewage Disposal and Air Pollution Engineering, Khanna Publishers, 29th Edition, New Delhi. Kavita K. Ghogare, 2014. “Study of Traffic Noise Pollution at
Intersection of Major Roads for Akola City (M.S)”,
International Journal for Research in Applied Science & Engineering Technology (IJRASET), Volume 2 Issue XII, December 2014, ISSN: 2321-9653, pp. 462-468.
Langdon F.J. and W E Scholes (1968). “The traffic noise index: A method of controlling noise nuisance”, Building Reaseach Station, Current papers.
Marathe P.D. (2012). “Traffic Noise Pollution”, IJED: Vol. 9, No. 1, (January-June 2012), pp. 63-68.
Mishra Rajeev Kumar, Santosh Rangnekar, and Manoranjan Parida, 2008. “Survey on Noise Pollution and its
Management”. Journal of IPHE, India, Vol (2008-09), 4,
pp. 30-34.
Mondal, N.K. 2013. “Vehicle noise interference and its impact
on the community”, International Journal of Current
Science, 2013,( 5), pp. 161-169.
Ozer Serkan, Hasan Yilmaz, Murat Ye and Pervin Ye, 2009. “Evaluation of noise pollution caused by vehicles in the city
of Tokat, Turkey”, Scientific Research and Essay Vol.4
(11), pp. 1205-1212, November, 2009, ISSN 1992-2248. Balashanmugam, P., Ramanathan, A.R. Nehrukumar, V. and
Balasubramaniyan, K. 2013. “Assessment of Noise
pollution in Chidambaram Town”, International Journal of
Research in Engineering and Technology, Volume: 02 Issue: 10, Oct-2013, pp. 85-93.
Suhas Vijay Patil, and Adavi, P. R. 2015. “Development of Passenger Car Units (PCU), Case study- NAL Stop, Pune”,
International Journal of Science and Engineering, Volume 3, Special Number ICRAESM – 2015, pp: 89-95.
Sundara Kumar, K. 2011. “Assessment of Urban Noise
Pollution in Vijayawada City, A.P, India”, International
Journal of Earth Sciences and Engineering, Volume 04, No 06, October 2011, pp. 459-464.
Swain, B. K. and Shreerup Goswami, 2013. “Integration and comparison of assessment and modeling of road traffic
noise in Baripada town, India”, International Journal of
Energy and Environment, Volume 4, Issue 2, 2013 pp.303-310.
Tandel Bhaven, Joel Macwan, and Pratik N. Ruparel, 2011. “Urban Corridor Noise Pollution: A case study of Surat
city, India”, International Conference on Environment and
Industrial Innovation, IPCBEE, Vol.12 (2011).
Vidyasagar, T. and Nageswararao, G. 2016. “Noise Pollution
Levels In Visakhapatnam City (India)”, Journal of
Environmental Science & Engineering, 48 (2), 139-142. Vilas K. Patil, and Nagarale, P.P. 2013. “Modelling of Road
Traffic Noise in Selected Areas of Nashik City”,
International Journal of Advanced Technology in Civil Engineering, ISSN: 2231 –5721, Volume-2, Issue-1, 2013.
Wikipedia, 2017. Available at internet via
https://en.wikipedia.org/wiki/Passenger_car_equivalent. Xie Lin-hua, Cai Ming and Li Er-da, 2013. “Comprehensive
Evaluation Of Traffic Noise Pollution Based On Population
Exposure”, 13th COTA International Conference of
Transportation Professionals (CICTP 2013), Procedia - Social and Behavioral Sciences 96 (2013) 2179 – 2186. Zuhdi Salhab and Husein Amro, 2012. “Evaluation of
Vehicular Noise Pollution in the city of Hebron, Palestine”,
International Journal of Modern Engineering Research (IJMER), Vol. 2, Issue. 6, Nov.-Dec. 2012 pp-4307-4310 ISSN: 2249-6645.