A Brain Image Database for Structure/Function
Analysis
Stan I. Letovsky, Sara H. J. Whitehead, Chul H. Paik, Gerald A. Miller, Joanne Gerber, Edward H. Herskovits, Truxton K. Fulton, and R. Nick Bryan
BACKGROUND AND PURPOSE:Lesion-deficit– based structure-function analysis has tradi-tionally been empirical and nonquantitative. Our purpose was to establish a new brain image database (BRAID) that allows the statistical correlation of brain functional measures with anatomic lesions revealed by clinical brain images.
METHODS: Data on 303 participants in the MR Feasibility Study of the Cardiovascular Health Study were tested for lesion/deficit correlations. Functional data were derived from a limited neurologic examination performed at the time of the MR examination. Image data included 3D lesion descriptions derived from the MR examinations by hand segmentation. MR images were normalized in-plane using local, linear Talairach normalization. A database was implemented to support spatial data structures and associated geometric and statistical operations. The database stored the segmented lesions, patient functional scores, and several anatomic atlases. Lesion-deficit association was sought by contingency testing (x2-test) for
every possible combination of each neurologic variable and each labeled atlas structure. Significant associations that confirmed accepted lesion-deficit relationships were sought.
RESULTS:Two-hundred thirty-five infarctlike lesions in 117 subjects were viewed collectively after mapping into Talairach cartesian coordinates. Anatomic structures most strongly corre-lated with neurologic deficits tended to be situated in anatomically appropriate areas. For example, infarctlike lesions associated with visual field defects were correlated with structures in contralateral occipital structures, including the optic radiations and occipital gyri.
CONCLUSION: Known lesion-deficit correlations can be established by a database using a standard coordinate system for representing spatial data and incorporating functional and structural data together with appropriate query mechanisms. Improvements and further ap-plications of this methodology may provide a powerful technique for uncovering new structure-function relationships.
This study introduces our Brain Image Database (BRAID), a large-scale archive of normalized digital spatial data and functional data, with an analytical query mechanism. We outline the underlying design of BRAID and describe one of its many applications, the elucidation of brain structure-function relation-ships. BRAID stores spatially defined data from dig-ital brain images that have been mapped into
normal-ized cartesian coordinates, allowing image data from large populations of patients to be combined and compared. The database also contains neurologic data from each patient and a query mechanism that can perform statistical structure function correlations. The latter capability is relatively novel.
The traditional method of cerebral structure-func-tion determinastructure-func-tion is lesion-deficit analysis, using ei-ther human subjects with lesions caused by neurologic disease or animal models with experimentally created brain lesions. Lesions are located either by postmor-tem anatomic dissection or by in vivo neuroimaging. While historically productive, both methods of lesion localization have important disadvantages. Classic clinicopathologic studies are greatly limited by the requirement for documenting clinical deficits in a living subject for correlation with subsequent autopsy material. Numerous confounding variables and logis-tic constraints between the clinical assessment in life and postmortem lesion analysis have often limited Received April 28, 1997; accepted after revision August 4, 1998.
Supported by NIH grant ROI AG13743–01, by National Heart, Lung, and Blood Institute grant N01-HC-15103, and by an Engines for Innovation grant of software from Illustra (Oakland, CA).
Presented in part at the annual meeting of the American Society of Neuroradiology, Nashville, May 1994.
From the Russel H. Morgan Department of Radiology and Radiological Science, Division of Neuroradiology, The Johns Hop-kins Hospital, Baltimore.
Address reprint requests to R. N. Bryan, MD, PhD, NIH Clinical Center, Bldg 10, Room I C-660, Bethesda, MD 20892.
©American Society of Neuroradiology
such work to case reports or short case series (1). Clinicopathologic correlation in large populations is feasible but arduous, and compromised by the incom-parability of in vivo/ex vivo data (2). Lesion-deficit analysis using in vivo imaging techniques requires that images of different patients be morphologically com-parable; both inherent anatomic variations and dif-ferences in imaging technique need to be taken into account (3). These methods have not previously been conducive to large-scale studies, and statistical meth-ods of analysis have rarely been performed.
BRAID overcomes several of these disadvantages. The digitized and normalized state of the spatial data in BRAID facilitates large-scale population studies and makes the old lesion-deficit method of structure-function determination amenable to statistical analy-sis. Functional brain measures and in vivo structural data can be obtained contemporaneously and entered into BRAID for subsequent analysis. In this study, we sought to show that BRAID can reveal established brain structure-function relationships from normal-ized spatial data from a group of MR images contain-ing chronic cerebral infarcts along with information about the patients’ neurologic deficits.
Methods
The prototype database currently holds data on the 303 participants in the MR Feasibility Study of the Cardiovascular Health Study (CHS), an epidemiologic study of risk factors for stroke and heart disease in the elderly. Participants in the CHS were recruited in four communities from Medicare eligibility lists provided by the Health Care Financing Administration, with random sampling to provide eight subgroups stratified by age and sex. The following communities were included: Forsyth County, NC; Pittsburgh, PA; Sacramento County, CA; and Washington County, MD. Exclusion factors included institu-tionalization; terminal illness; inability to walk, communicate, or give informed consent; or likelihood of moving from the area during a period of 3 years after entry into the study. The 303 participants in the MR Feasibility Study were selected from the full CHS cohort of 5280 subjects on the basis of MR imaging availability, history of stroke (n5101), no history of stroke with cardiovascular disease risk factors (n5101), and no history of stroke without cardiovascular disease risk factors (n5101) (4). Available functional data include the 250 CHS entry variables (including demographic, historical, physical, he-matologic, noninvasive cardiac and pulmonary, and limited psychological and cognitive test variables) plus the variables obtained from a limited neurologic examination performed at the time of MR imaging (5). The neurologic examination was administered by a CHS field center research associate and included only the neurologic variables summarized in Table 1, which were used as the functional variables for this study.
Data Acquisition and Lesion Delineation
All subjects underwent unenhanced brain MR imaging using oblique axial sections parallel to the anterior commissure-posterior commissure (AC-PC) line, including conventional spin-echo T1-weighted images with parameters of 500/16/1 (TR/TE/excitations), spin-density/T2-weighted images with pa-rameters of 3000/30–100/0.5, 5-mm contiguous sections, a 2563192 matrix, and a 24-cm field of view. Infarctlike lesions were defined as lesions greater than 3 mm in maximum dimen-sion, having a vascular distribution, no mass effect, and in-creased spin-density/T2-weighted signal intensity (and de-creased T1-weighted signal in the white matter and brain stem
only) (4). Each infarctlike lesion was delineated as a region of interest (ROI) on each section by a neuroradiologist partici-pating in the study, using thresholding and segmentation supplemented by manual editing of T2-weighted images on a digital image workstation (ISG Technologies, Toronto, Cana-da). Each ROI was reconstructed into a 3D image.
Registration to Atlas
Images from a stereotactic brain atlas created by Talairach and Tournoux were digitized with the authors’ permission and used as the basis for a normalized cartesian coordinate system centered on the AC (6). Our MR image data, with infarcts defined, were mapped onto this coordinate system by the local, linear transformation of several atlas dimensions to match those of the subject, as described by Talairach and Tournoux (6). Three axial planes parallel to the AC-PC line (through the AC-PC plane and the most superior and inferior extent of the cerebrum), three sagittal planes (through the midline and the most lateral extent of the cerebrum), and four coronal planes (through the AC and the PC and the most anterior and posterior cerebrum) were used to register (normalize) the atlas and its coordinate system to a subject’s MR image. These planes also were used to divide each atlas hemisphere into nine parts, each of which was scaled linearly with the subject’s brain MR images. By using these linear conversions, a spatially intact MR image could be viewed with an atlas-derived overlay, stretched or shrunk to fit the individual (Fig 1).
[image:2.587.307.534.73.232.2]A limited analysis of the registration error resulting from this normalization technique was performed. Registration er-ror in this study estimates how well the stereotactically normal-ized Talairach atlas plate cortex aligns (or registers) with the patient’s MR section cortex. To assess the error of registration, 30 or 32 equally spaced points were placed along the cortical surface of selected transaxial images. Subsequently, a sample of 30 or 32 points on each of the corresponding atlas plates was similarly placed along the surface of the cortex. The atlas images containing these surface points were then stereotacti-cally normalized to fit the patient’s transaxial sections, and the error distances between the corresponding points were mea-sured in millimeters. Positive (negative) registration errors are attributed to atlas registration points falling outside (inside) the patient’s cortex registration points. Zero error results when the atlas and the patient’s registration points coincide. Three rep-resentative sections from three subjects were selected to eval-uate atlas-to-patient section cortex registration error across patients at different transaxial levels. The selected Talairach atlas plate numbers 109, 115, and 123 were 40 mm above, 6 mm above, and 12 mm below the AC-PC line, respectively. The number of registration point pairs, a registration error mean, and 95% confidence interval of the mean were calculated for each subject and section level.
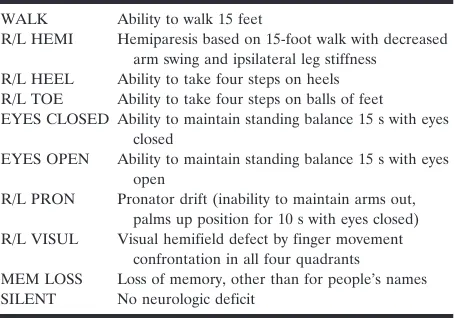
TABLE 1: Neurologic variables
WALK Ability to walk 15 feet
R/L HEMI Hemiparesis based on 15-foot walk with decreased arm swing and ipsilateral leg stiffness
R/L HEEL Ability to take four steps on heels R/L TOE Ability to take four steps on balls of feet EYES CLOSED Ability to maintain standing balance 15 s with eyes
closed
EYES OPEN Ability to maintain standing balance 15 s with eyes open
R/L PRON Pronator drift (inability to maintain arms out, palms up position for 10 s with eyes closed) R/L VISUL Visual hemifield defect by finger movement
Image Database
BRAID was implemented in Illustra (Oakland, CA), a com-mercial object/relational database management system (DBMS), running first on a Sun SPARC 20 workstation (Mountain View, CA) and later on a Silicon Graphics Impact workstation (Mountain View, CA). The object/relational data model extends the relational data model by incorporating fea-tures of object-oriented data models, including the ability to define new data types and methods that operate on them. These data types and methods can be defined in conventional programming languages, such as C, registered with the DBMS server, and then invoked in data definitions or Structured Query Language queries, respectively. The definition of such extensions is important for operating on types of data, includ-ing medical images, that are not effectively supported by con-ventional relational DBMSs.
Each 3D image data type is qualified by an abstract type and an implementation type. The abstract type is the range of a function whose domain is the 3D box defined by the Talairach coordinates. For example, a Boolean image (image data type with Boolean abstract type) defines a Boolean value at every point in Talairach space. This is useful for defining ROIs, such as lesions, as well as for defining anatomic structures in an atlas. In this study, each anatomic structure in each atlas was represented by a Boolean image, as was each lesion in each
patient as well as the set of all lesions in each patient, using a separate Boolean image.
Color images were used to produce visualizations of image data. Operations defined on images include sum, product, and volume. The sum of a set of binary lesion images, for example, is an integer image that represents a kind of histogram of lesion intensity. In addition to image-related extensions, we have also added some purely numerical operators to BRAID to facilitate statistical analysis, notably operators for performingx2-tests.
Statistical Analysis
BRAID was searched for correlations between lesions and deficits as follows: for each anatomic structureSin the atlas, and for each neurologic variableV, queries were performed to construct the following 2 32 contingency table relating the binary (normal/abnormal) variablesSandV:
Lesion inS
Yes No
Deficit inV Yes a b
No c d
A patient was assumed to have a lesion in the structureSif the intersection of all stroke regions (in the patient) with the FIG 1. A, T2-weighted MR image at the AC-PC plane.
B, Talairach registration box superimposed on the MR image.
C, Rescaled Talairach atlas plate superimposed on MR image.
D, T2-weighted MR image with infarctlike lesion (arrow) in left periventricular white matter.
E, Talairach atlas superimposed on MR image with infarctlike lesion (in orange).
structure was at least 1 voxel; a patient was assumed to have no lesion in the structureSif the overlap was 0 voxels. In other words, a structureSwas defined as normal if and only if it did not overlap with any of the infarctlike lesions.
We evaluated all possible structure-function pairs on 14 neurologic variables (V) (Table 1) and 90 (including right and left) anatomic structures (S) (Table 2) from the Talairach-Tournoux atlas, performing a contingency table analysis for each, for a total of 1260 tests (7). We used the x2-test to
evaluate each table (7–9). For those contingency tables in which at least one cell had expected counts of less than five, we performed the Fisher exact test and reported results of these tables separately.
In an effort to evaluate the effect of increasing the sample size for neurologic variables in which a lateralized function was believed to be symmetrically localized to the opposite hemi-sphere, we artificially doubled the observed counts by flipping the data; that is, adding a population of mirrored controls and patients with mirror-image lesions and contralateral deficits. For example, for a patient with a right visual field deficit, we created a mirror patient with a left visual field deficit, and so on. This manipulation is obviously arbitrary and presumptive but is based on accepted neurologic structure/function local-izations on which this preliminary analysis is focused.
Since the exploratory analysis of the entire data set involved over a thousand individualx2-tests, a Bonferonni correction for
chance test significance was needed. The standard Bonferonni correction of our analysis would require that we divide our significance threshold by 1260. This correction vastly overesti-mates the number of independent tests, since many of the neurologic and structural variables are associated with each other (eg, right occipital lobe and right optic radiations). For such data, the standard Bonferroni correction is a poor heuris-tic; instead, we chose to apply the sequential Bonferroni cor-rection in which the value of a is sequentially relaxed (ie, increased) as each hypothesis is evaluated (10). In essence, this modification is equivalent to a standard Bonferroni correction in which any hypothesis already found to be significant is ignored. Empirically, this modification has been found to yield reasonable results (10), and we have thus applied it to our analysis.
Results
Having assembled a database of lesions and func-tional data together with a query formalism extended with image operators, we can generate interesting visualizations of the data. Image results are typically displayed as a table of axial sections; color coding and anatomic overlays are specified as part of the query expression. Figure 2 shows a section with the total lesion density for the data set of 303 subjects, of whom 117 had 235 infarctlike lesions, with yellow intensity encoding the number of lesions overlapping at any point. We selected subsets of these lesions by various criteria of interest. Figure 2B and C shows the locations of voxels having at least five or nine infarct-like lesions, respectively. The latter image indicates the most common location of infarctlike lesions. We also selected lesions on the basis of the patients’ neurologic deficits. For example, Figure 3A shows the subset of lesions from patients with a left visual field defect, and Figure 3B shows the subset of lesions in subjects without such a defect.
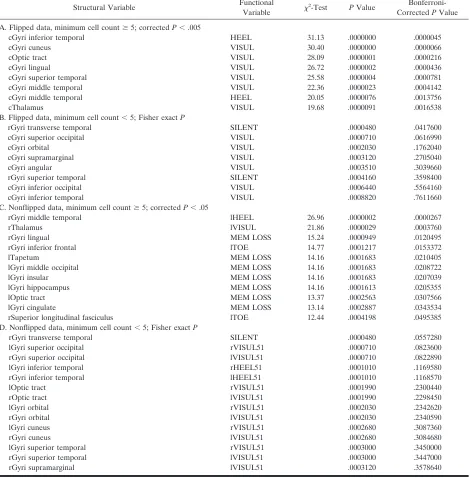
The search for statistically significant lesion-deficit correlations provided encouraging results. The most significant x2 statistics and associated P values are
presented in Table 3, sections A through D, and include the standard and exactx2results as well the
sequential Bonferroni correction for the number of tests performed. Many of these correlations are con-sistent with expectations. For example, infarcts asso-ciated with visual field defects were significantly cor-related with lesions in the contralateral optic tract, cuneus, lingual and superior temporal gyri, as well as the orbital, superior occipital, and hippocampal gyri. Infarctlike lesions in those subjects with the func-tional variable HEEL or TOE deficits were corre-lated (although less strongly) with the contralateral frontal and temporal structures. Lesions in subjects who had no neurologic deficits (silent) tended to be in the insula and noneloquent parts of the right (non-TABLE 2: Atlas anatomic variables
Cerebrum Gray matter
Frontal
Gyri superior frontal (GSUF) Gyri middle frontal (GMIF) Gyri inferior frontal (GIFR) Gyri medial frontal (GMER) Gyri precentral (GPRE) Gyri rectus (GRFC) Gyri cingulate (GCIN) Gyri paracentral lobule (GPAL) Parietal lobe
Gyri postcentral (GPOS) Gyri angular (GANG) Gyri supramarginal (GSPM) Gyri superior parietal lobule (GSUP) Gyri inferior parietal lobule (GIPL) Gyri precuneus (GPCN)
Occipital lobe
Gyri superior occipital (GSUO) Gyri middle occipital (GMIO) Gyri inferior occipital (GIOC) Gyri orbital (GORB) Gyri lingual (GLIN) Gyri cuneus (GCUN) Temporal lobe
Gyri insula (GINS)
Gyri transverse temporal (GTRT) Gyri superior temporal (GSUT) Gyri middle temporal (GMIT) Gyri inferior temporal (GITE) Gyri fusiform (GFUS) Hippocampus (HIP) White matter
Corpus callosum (CPC) Cingulum (CIN)
Inferior longitudinal fasciculus (ILF) Superior longitudinal fasciculus (SLF) Occipitofrontal fasciculus (FOF) Optic tract (TOPR)
Tapetum (TAP) Basal ganglia
Caudate (CAU) Putamen (PUT)
[image:4.587.306.537.78.556.2]dominant) frontal and temporal lobes. However, un-expected structure function correlations were found, including the numerous and widespread anatomic correlations with the functional variable MEMORY LOSS.
In terms of registration precision, sections with strictly positive or negative registration errors re-sulted from “incorrectly” selected atlas plates along the z-axis, whereas sections with both positive and negative registration errors resulted from “correctly” chosen atlas plates. The mean registration error for sections with correctly selected atlas plates was20.1 mm (95% confidence interval: 20.6, 0.3) and for incorrectly selected plates was 4.3 mm (95% confi-dence interval: 3.6, 4.9).
Discussion
Relational DBMSs typically provide an image data type that is simply an opaque binary string that que-ries cannot interpret or manipulate in any interesting
way; thus, to combine operations on images with other relational operations, a hybrid client needs to be built that mixes relational queries with image op-erations performed by routines external to the data-base. By using object/relational technology, we were able to develop a unified system in which image and relational operations could be freely intermixed within a single query and executed completely on the server side.
In developing BRAID, we extended the Illustra DBMS with a family of 3D image data types suitable for representing both the raw and derived content of brain images. Although, for this study, only Boolean image variables were used in BRAID, the database also supports integer images that define an integer value at every point; this extension is useful to repre-sent original image data, as well as for other purposes. Other abstract types include float, vector, tensor, and color. Vector images can be used to represent mor-phologic data (ie, image warps); tensor images repre-sent SDs of vector image averages.
The product of Boolean images is the intersection FIG 2. A, Axial atlas image through the AC-PC plane with all infarctlike lesion re-gions demarcated (Talairach cortex in blue, infarctlike lesion in yellow).
B, Axial atlas image of regions with five or more infarctlike lesions.
C, Axial atlas image of regions with seven or more infarctlike lesions.
of two ROIs; products of Boolean images with other image types can also be used to mask another image and project just the part of it that intersects an ROI. Other operations allow conversion between different abstract image types, such as conversion of an integer image to a color image for display, as well as gener-ation of a 2D section of a 3D image and conversion of a 2D section to some display format. Figure 2 was generated by summing lesions, converting the sum to a yellow-scaled color image, adding the Talairach cortices in blue, obtaining a particular 2D section, and converting to Graphics Interchange format, all within a single Structured Query Language statement.
Each image data type has an implementation type as well as an abstract type. Implementation types may be thought of as file formats; they specify the syntax of an image representation, as opposed to the ab-stract type, which specifies its semantics. Examples of implementation types might include array formats, such as Digital Imaging and Communications in Med-icine (DICOM). BRAID is intended to support many implementation types and to automatically convert them so they can be freely intermixed in operations without the user having to be concerned about how any given image is represented. At present, however, only a single implementation is broadly supported; it is a format we call line segment, because it represents an image as a set of standard (Talairach axial) z planes, having at each yvalue a list of xpairs plus a value, defining x parallel line segments of constant value. Since default values are not explicitly repre-sented, this format can be compact and expressive for ROIs and supports reasonably efficient implementa-tions of sums, intersecimplementa-tions, and integraimplementa-tions.
The results indicate that the combination of mo-dem neuroimaging and database methods has made possible the statistical analysis of lesion-deficit
corre-lations. A key feature of the statistical analysis that distinguishes it from its anecdotal precursors is its ability to take negative data into account; for each region, the statistics analyze not only those subjects who had a lesion and a particular deficit but also those who had a similar lesion without the deficit and those who had the deficit without the lesion. This feature builds in a previously missing form of exper-imental control into lesion-deficit mapping. In other words, the statistical method adds specificity to the analysis.
These initial experiments offer some idea of the types of results that might be obtained with a larger corpus of lesion-deficit data. The current data set seems too small to generate robust statistical lesion-deficit mapping results. This sample-size limitation is reflected by the relatively few correlations that meet the more rigid statistical requirements of the Bonfer-roni correction and a minimum of five expected events in each box of the contingency tables. Sample-size limitations are particularly evident in Table 3, sections B and D, which report results of tests that had fewer than five events in a contingency table cell, thus requiring the use of the Fisher exact test. Be-cause of the small number of events and the strin-gency of the exact test, few correlations were found below the traditional significance levels ofPless than .05 or .005. Doubling the sample size by mirroring lateralized lesions did increase the number of signif-icant correlations, although such an ad hoc maneuver requires the use of a priori assumptions that might or might not be true. However, for the x2-test
applica-bility rule of thumb to be satisfied a significant frac-tion of the time, we would need, conservatively, a 10-fold increase in the number of patients. Such an analysis is now being undertaken with the complete FIG 3. A, Axial image of all lesions in subjects with left visual field deficit.
B, Axial image of all lesions in subjects without left visual field deficit.
C, Axial image with left visual fieldx2-correlated anatomic regions (in red). Red intensity is a function of thePvalue of
CHS data set, which contains 1300 infarctlike lesions in approximately 1100 subjects.
Contingency table analysis is certainly not the only possible approach to the statistical identification of lesion-deficit correlations. It has the disadvantage of requiring an atlas to frame the hypotheses to be tested; it would thus be difficult to detect a correla-tion of a deficit with a region that had not been explicitly identified in the atlas. An atlas-free analysis method, by contrast, could allow the data themselves to define new functional regions. Activation analysis methods, such as significance probability mapping (11), are atlas-free in this sense.
Spatial resolution of the current approach is lim-ited by a number of factors, including the spatial resolution of the original MR images, precision of segmentation of lesions, precision of registration to the Talairach coordinate system, the underlying bio-logical variability in the localization of function across subjects, the size of the lesions, and, in an atlas-based method, the size of the atlas structures. Of these factors, the spatial resolution of the MR image is the least limiting at this point. Our validation experiments suggest that the error associated with registration is on the order of a few millimeters, although this will vary significantly with different regions and registra-TABLE 3: Structure-function correlations
Structural Variable FunctionalVariable x2-Test PValue
Bonferroni-CorrectedPValue A. Flipped data, minimum cell count$5; correctedP,.005
cGyri inferior temporal HEEL 31.13 .0000000 .0000045
cGyri cuneus VISUL 30.40 .0000000 .0000066
cOptic tract VISUL 28.09 .0000001 .0000216
cGyri lingual VISUL 26.72 .0000002 .0000436
cGyri superior temporal VISUL 25.58 .0000004 .0000781
cGyri middle temporal VISUL 22.36 .0000023 .0004142
cGyri middle temporal HEEL 20.05 .0000076 .0013756
cThalamus VISUL 19.68 .0000091 .0016538
B. Flipped data, minimum cell count,5; Fisher exactP
rGyri transverse temporal SILENT .0000480 .0417600
cGyri superior occipital VISUL .0000710 .0616990
cGyri orbital VISUL .0002030 .1762040
cGyri supramarginal VISUL .0003120 .2705040
cGyri angular VISUL .0003510 .3039660
rGyri superior temporal SILENT .0004160 .3598400
cGyri inferior occipital VISUL .0006440 .5564160
cGyri inferior temporal VISUL .0008820 .7611660
C. Nonflipped data, minimum cell count$5; correctedP,.05
rGyri middle temporal lHEEL 26.96 .0000002 .0000267
rThalamus lVISUL 21.86 .0000029 .0003760
rGyri lingual MEM LOSS 15.24 .0000949 .0120495
rGyri inferior frontal lTOE 14.77 .0001217 .0153372
lTapetum MEM LOSS 14.16 .0001683 .0210405
lGyri middle occipital MEM LOSS 14.16 .0001683 .0208722
lGyri insular MEM LOSS 14.16 .0001683 .0207039
lGyri hippocampus MEM LOSS 14.16 .0001613 .0205355
lOptic tract MEM LOSS 13.37 .0002563 .0307566
lGyri cingulate MEM LOSS 13.14 .0002887 .0343534
rSuperior longitudinal fasciculus lTOE 12.44 .0004198 .0495385 D. Nonflipped data, minimum cell count,5; Fisher exactP
rGyri transverse temporal SILENT .0000480 .0557280
lGyri superior occipital rVISUL51 .0000710 .0823600
rGyri superior occipital lVISUL51 .0000710 .0822890
lGyri inferior temporal rHEEL51 .0001010 .1169580
rGyri inferior temporal lHEEL51 .0001010 .1168570
lOptic tract rVISUL51 .0001990 .2300440
rOptic tract lVISUL51 .0001990 .2298450
lGyri orbital rVISUL51 .0002030 .2342620
rGyri orbital lVISUL51 .0002030 .2340590
lGyri cuneus rVISUL51 .0002680 .3087360
rGyri cuneus lVISUL51 .0002680 .3084680
lGyri superior temporal rVISUL51 .0003000 .3450000
rGyri superior temporal lVISUL51 .0003000 .3447000
rGyri supramarginal lVISUL51 .0003120 .3578640
[image:7.587.65.535.80.558.2]tion methods. For instance, in Figure 2, the location of the region with the most infarctlike lesions appears to be in the insula, but direct observation of the data reveals that most of these lesions are actually located more medially in the lateral putamen. This is the result of registration errors related to large ventricles that are prevalent in this population but that are not explicitly addressed in the relatively crude Talairach registration. We have not validated the segmentation process, but we expect its error contribution to be small, within the range of a few millimeters.
The resolution of our atlas-based analysis was ulti-mately limited by the anatomic resolution of our atlas, the sizes of the observed lesions, and the sample size; we were only able to get correlations with identified structures, and these had a certain size range. Had the structures been smaller, the problem of insufficient sample size would have been worse, since we would have had fewer lesions overlapping any given struc-ture. Also, if the lesions are too large, a fine-grained atlas may not help much; it will take many lesions to tease apart the effects of nearby structures, since most lesions that overlap one will also overlap the other. (The situation is analogous to genetic mapping, in which large population sizes are required to resolve the distances between tightly linked genes, because recombinations between them occur so rarely.) This effect of lesion size is reflected in the correlations of visual deficits with remote temporal and parietal structures. In these cases, a few large (poorly localiz-ing) lesions that involved many nearby structures overwhelmed the fewer small (more localizing) le-sions involving the same structures. In an atlas-free method, we would expect spatial resolution to be directly related to the number of subjects. All these concerns point to the need for very large sample sizes to perform more sensitive analyses of the sort de-scribed here. These sample sizes might be feasible in the context of a system in which clinicians could submit MR images and patient descriptions to a cen-tralized database; hospitals would then function as data collection points for the database. While the administrative and logistic aspects of such a collection process would be very challenging, they are being approached by the human brain mapping community. Significant issues were found on the functional side as well. Correlations can only be detected with those functional variables that have been measured. The set of neurologic variables assessed as part of the CHS protocol, and used in this study, are not only limited in detail but are those for which clear localizations of function have long been established. The problem with such variables is that we will most likely learn only what we already know. A large battery of func-tional variables, including fine-grained cognitive mea-sures and mathematical, linguistic, spatial, emotional, perceptual, and memory assessments, would afford greater opportunities for the detection of interesting correlations. However, the required sample size is also increased as a result of Bonferonni corrections; moreover, it becomes logistically difficult to ensure
that such a large battery is consistently and com-pletely assessed for each participant. Poorly localizing functional variables are likely to yield nonspecific and confusing anatomic correlations. For instance, the variable MEMORY LOSS correlated with many widespread anatomic structures. The inability to per-form this function might be a result of localized sions in different individual structures, multiple le-sions, or even global effects, such as atrophic degeneration, a nonspecific deficit with many possible anatomic correlates. Finally, a key difficulty with these data is the lack of pretreatment controls; since we do not observe subjects before the occurrence of the lesions, we do not know whether their deficits are caused by those lesions. In addition, subjects may be observed at many different stages of recovery from the infarction; deficits may abate as the missing func-tions are taken on by other parts of the brain, thereby obscuring the correlation and increasing the sample size required to resolve it. Thus, although we have identified a novel and interesting approach to the statistical analysis of lesion-deficit correlations, the successful application of this approach beyond the proof-of-concept stage needs to overcome signif-icant practical hurdles.
Apart from functional brain mapping, a BRAID-type database could play a useful role in understand-ing the epidemiology of cerebrovascular disease. As shown in the sample images, we can visualize the distribution of lesions in brain space and select por-tions of that distribution associated with nonspatial variables. These need not be neurologic function ables. They could be demographic or lifestyle vari-ables, such as age, sex, hypertension, tobacco use, and cholesterol level. If any such variables influence the distribution of lesions, it might be possible to detect their effect using BRAID.
Conclusion
References
1. Broca P.Localisation des fonctions cerebrales: siege du langage articule.Bull Soc Anthropol1863;4:200–203
2. Fisher CM.Lacunes: small, deep cerebral infarcts.Neurology1965; 15:774–784
3. Damasio H, Damasio AR.Lesion Analysis in Neuropsychology. New York: Oxford University Press; 1989
4. Bryan RN, Manolio TA, Schertz LD, et al.A method for using MR to evaluate the effects of cardiovascular disease on the brain: the Cardiovascular Health Study. AJNR Am J Neuroradiol 1994;15: 1625–1633
5. Fried LP, Borhani NO, Enright P, et al.The Cardiovascular Health Study: design and rationale.Ann Epidemiol1991;1:263–276
6. Talairach J, Tournoux P.Co-Planar Stereotaxic Atlas of the Human Brain: 3-D Proportional Systems: An Approach to Cerebral Imagery. New York: Thieme; 1988
7. Crow EL, Davis FA, Maxfield MW.Statistics Manual. New York: Dover; 1960
8. Keeping ES.Introduction to Statistical Inference. New York: Dover; 1995
9. Fienberg SE.The Analysis of Cross-Classified Categorical Data. 2nd ed. Cambridge, MA: MIT Press; 1980
10. Anderson EB.The Statistical Analysis of Categorical Data. 3rd ed. Boston: Springer; 1994