*Present address: Central Research Laboratory, Biox Co. Ltd, Miyamachi 2-84-3, Omiya 330, Japan. †Present address and address for reprint requests: JSPS Liaison Office, Bonn, ‘Bonn Center’, HI-1104, Bundeskanzlerplatz 2-10, 5300 Bonn 1, Germany.
Key words: Paramecium caudatum, chemotaxis, chemoaccumulation, ciliary activity.
QUANTITATIVE ANALYSIS OF CHEMOACCUMULATION IN
SPECIMENS OF PARAMECIUM CAUDATUM IN RELATION TO
THEIR MOTILE ACTIVITIES
HIROYUKI NAKAZATO* and YUTAKA NAITOH†
Institute of Biological Sciences, University of Tsukuba, Tsukuba, Ibaraki 305, Japan
Accepted 2 November 1992
Summary
1. The quantitative relationship between chemoaccumulation and locomotor activity in specimens of Paramecium caudatum was examined by employing a novel chemoaccumulation assay system.
2. Distribution of the specimens in two adjoining solutions with different chemical compositions was dependent on both the rate of arrival of the specimens at the border between two solutions (the arrival rate) and the ratio of the number of specimens crossing the border to that arriving at the border in unit time (the pass ratio).
3. The arrival rate was higher when the forward swimming velocity was higher and when the frequency of spontaneous avoiding responses was lower. The pass ratio was higher when the degree of the avoiding response at the border was lower.
4. The translocation rate was defined as the number of specimens crossing from one solution to another in unit time, corresponding to the product of the arrival rate and the pass ratio.
5. In the steady-state condition, the distribution ratio, which is defined as the ratio of the number of specimens in the test solution to that in the reference solution, was proportional to the ratio of the translocation rate towards the test solution from the reference solution to that towards the reference solution from the test solution.
6. When specimens showed a higher arrival rate in one solution than the other the pass ratio was lower, so that the arrival rate and the pass ratio acted antagonistically in establishing chemoaccumulation.
7. The involvement of membrane-potential-mediated changes in the motile activity of specimens in establishing chemoaccumulation is discussed.
Introduction
responses of the specimens were the major factors determining distribution (Van Houten
et al. 1975, 1981; Van Houten, 1977, 1978, 1992; Van Houten and Van Houten, 1982).
Translocation of an individual Paramecium caudatum from one solution to another requires first its arrival at the border between the two solutions, and second its crossing the border. To look at the mechanisms governing accumulation of specimens in the two solutions (chemoaccumulation) (Jennings, 1906; Frankel and Gunn, 1961; Diehn et al. 1977), it is important to obtain quantitative data on the motile activity of the specimens in both solutions and at the border under controlled conditions. The involvement of these motile activities in establishing chemoaccumulation can then be analyzed. The motile activity cannot be determined by Van Houten’s assay system.
We recently determined the motile activities of specimens of P. caudatum by employing a novel chemoaccumulation assay system. We found that the number of specimens arriving at the border between solutions was primarily dependent on their kinetic activity, their forward swimming velocity (orthokinesis) and the frequency of spontaneous avoiding responses (klinokinesis) in each solution. The major factor determining which individuals crossed the border was the avoiding response (or the change in the swimming direction; klinophobic response) at the border. We quantitatively analyzed the interaction between the kinetic activity and the phobic response in establishing chemoaccumulation in terms of the rate of arrival of specimens at the border and the ratio of the number of specimens arriving at the border to the number passing across the border. Some of the results have been presented verbally elsewhere (Nakazato and Naitoh, 1980, 1981, 1982).
Materials and methods
As shown in Fig. 1, three pieces of coverslip (0.2mm in thickness), a (18mm332mm), b1and b2(18mm38 mm), were assembled into a thin trough with the
aid of two small plastic clips (c). Two troughs were put in parallel 2mm apart from each other on a conventional glass slide (S). The thin space (18mm316mm30.2mm) between the trough and the glass slide is termed ‘the assay chamber’. One chamber (the reference chamber) was filled with about 50 specimens of Paramecium caudatum suspended in a reference solution while the other (the test chamber) contained the test solution to be examined. The test chamber was then gently pushed towards the reference chamber so that its edge came into contact with that of the reference chamber. The two solutions thereby came into contact, giving a sharp concentration gradient of the test chemical at the border. Care was taken to minimize any mechanical agitation of the solutions at this point. Mixing of the solutions at the border by mechanical agitation and/or by diffusion was examined in a model experiment, where the change in colour of a solution containing the Ca2+-sensitive dye chlorophosphonazo III (0.5mmol l21) in the
reference chamber was determined photometrically after it had made contact with a Ca2+
-containing solution in the test chamber. The colour change did not extend beyond 2mm from the border in 10min, a value that is reasonable given the diffusion coefficient of Ca2+in water at 20˚C (Jacobs, 1967).
which water-saturated air (the water vapour pressure adjusted to that of the reference solution) was circulated at a constant flow rate (1ml s21) to minimize condensation or evaporation of water from the assay chambers during experimentation. Most of the CO2
in the circulating air was removed with NaOH, as more consistent data could be obtained under these atmospheric conditions. The specimens in the chambers were recorded on a videotape under dark-field illumination (9 Wm22), and their motile activities were evaluated visually on the replayed pictures on a television screen.
Specimens of P. caudatum (S41, wild type) cultured in a bacterized (Klebsiella
pneumoniae) fresh lettuce medium were collected when they were in the early stationary
growth phase and washed gently with a reference solution. The cell density was adjusted to approximately 1000cellsml21. The specimens were kept immersed in the solution for at least 15min prior to experimentation.
The reference solution was a mixture of 1mmol l21KCl and 1mmol l21CaCl2(final
concentration). The test solutions were mixtures of KCl with varying concentrations (1–10mmol l21) and 1mmol l21 CaCl2unless otherwise stated. All the solutions were
buffered to pH7.4 with 10mmol l21(final concentration) Tris–HCl buffer. The assays were performed at a controlled temperature of 22±3˚C and at constant light intensity (9 Wm22).
In the shallow assay chambers, the specimens are forced to swim virtually in two dimensions. To examine whether this enforced swimming differs from their free swimming in a deeper chamber, kinetic activities were compared between the specimens in the shallow (0.2mm) assay chamber and those in a deeper (1cm) chamber swimming in a solution with 8mmol l21K+. In the deeper chamber the forward swimming velocity
was 1.26±0.20mm s21 and the frequency of spontaneous avoiding responses was 1.97±0.52min21(each value is a mean and S.E. obtained from 15 measurements with 15
different specimens), while in the shallow chamber these values were 1.36±0.25mm s21
Fig. 1. Construction and arrangement of the chambers used to assay the chemoaccumulation of the specimens of Paramecium caudatum. a, b1and b2, three pieces of coverslip; c, plastic clip; S, glass slide. See the text for the details.
S
a
c
c
b1
and 2.15±0.58min21, respectively. No significant differences in the kinetic activities were found between them.
Results and discussion
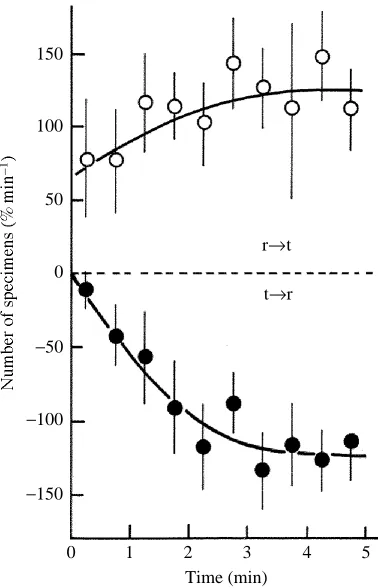
In the first series of experiments, the number of specimens crossing the border from the reference solution to a test solution containing 5mmol l21K+and from the test solution to
the reference solution was determined every 30s after the solutions made contact. As shown in Fig. 2, both numbers (expressed as a percentage of the number of specimens initially introduced into the reference chamber) increased with time and reached their respective steady-state values in 3–4min. It should be noticed that the steady-state values were equal (approximately 120 % min21), indicating that the distribution of specimens in the assay chambers became steady in 3–4min. In fact, the number of specimens in the reference chamber decreased, while that in the test chamber increased, with time to reach their respective steady-state values in 3–4min (47.2±3.6% in the reference solution;
−50 0
−100
−150 150
100
50
r→t t→r
2 3 4 5
0 1
[image:4.612.130.319.285.579.2]Time (min)
53.8±3.6% in the test solution). The numbers remained unchanged for several minutes and then the specimens began to flock together (thigmotaxis), so that their distribution in the chambers deviated from the steady state. In the following experiments we examined steady-state chemoaccumulation, so all data were obtained 4min after the two solutions made contact.
The number of specimens in the assay chamber (N), the number of specimens that arrived at the border in 1min (N), the number of specimens crossing the border in 1min (n), the forward swimming velocity (V; mm s21) and the frequency of spontaneous avoiding responses (F; min21) were determined for the specimens in both the reference and test solutions (Table 1). Ten different test solutions were employed for ten successive series of experiments. From these data, the arrival rate, A (N/N), the pass ratio, P (n/N), the translocation rate, T (n/N), and the distribution ratio, D (Nt/Nr and Tr/Tt), were
calculated (Table 1).
In the control experiment (experiment 1) reference solution was introduced into the test chamber. The specimens distributed themselves uniformly in both chambers so that the distribution ratio, D was almost 1. The pass ratio of the specimens in the reference solution, Pr, and that in the test solution, Pt, were both 1. This indicates that the specimens
crossed the border freely between the two chambers without mechanical and/or chemical obstruction.
In experiment 2, a test solution made by adding 14mmol l21sucrose to the reference solution was employed. The osmotic effect of this solution on the specimens approximates that of a test solution with 10mmol l21K+, which has the highest ionic
concentration among the test solutions employed (Naitoh, 1964). A change in osmotic pressure experienced by the specimens when and after they cross the border had little effect on their motile activities, and the specimens became uniformly distributed in the chambers as in the control experiment. Therefore, the osmotic effects of the test solutions on chemoaccumulation can be ignored in the present experiments.
A series of test solutions containing varying K+concentration ([K+]
t=1.5–10mmol l21)
was employed in experiments 3–9. When [K+]t was lower than 2.0mmol l21, Pr was
almost 1 but tended to decrease with increasing [K+]
tfrom 2.5 to 5.0mmol l21, and was
almost zero at 10mmol l21. Close observations of the swimming behaviour of specimens in the reference solution revealed that all the specimens arriving at the border crossed into the test solution without showing an avoiding response when [K+]t was lower than
2.0mmol l21. Prwas, therefore, 1. The specimens exhibited an avoiding response at the
border when [K+]twas greater than 2.5mmol l21. The degree of the avoiding response
increased with increasing [K+]
t, and Prdecreased inversely. When [K+]t was as high as
10mmol l21, strong avoiding responses prevented the specimens from crossing the border into the test solution. Prwas accordingly 0. In contrast, once specimens entered
any one of the test solutions, they crossed back over the border into the reference solution without showing an avoiding response. The pass ratio of the specimens into the test solutions, Pt, was, therefore, 1, irrespective of [K+]t. Instead, the specimens showed an
When [K+]t was equal to or lower than 2.0mmol l21 (experiments 3, 4) more
specimens accumulated in the test solution than in the reference solution, though individuals crossed the border freely (Pr=Pt=1). However, the arrival rate of specimens in
the test solution, At, was significantly lower than that in the reference solution, Ar. It
should be noticed here that the translocation rate (Trfor the specimens in the reference
solution, Ttfor the specimens in a test solution) corresponds to the product of the arrival
rate and the pass ratio (Tr=Ar/Pr; Tt=At/Pt). In this case Tt was lower than Tr and,
accordingly, D was greater than 1. Thus, the specimens accumulated more in the test solution than in the reference solution.
When [K+]
twas between 2.5 and 4.0mmol l21(experiments 5–7), Prwas smaller than
Pt(Pr<Pt=1), indicating that the specimens in the reference solution experienced slight
difficulty in crossing the border into the test solution. More specimens accumulated in the test solution than in the reference solution as in experiments 3 and 4. Because the decrease in Tr, due to the decrease in Pr, was smaller than the decrease in Tt, due to the
decrease in At, D became greater than 1.
When [K+]
t was 5mmol l21(experiment 8), specimens were more or less uniformly
distributed in the assay chambers (D=1). Prwas smaller than Pt, and Arwas larger than At,
as in the previous cases when [K+]
twas 2.5–4.0mmol l21. In this case, however, Ttwas
virtually equal to Tr, and D was accordingly almost 1; that is, the decrease in Atbalanced
the decrease in Prin determining the translocation rate.
When [K+]twas 10mmol l21(experiment 9), almost all the specimens remained in the
reference solution (D=0). Since Prwas so low (0.018) and Trwas almost zero, D was,
accordingly, almost zero.
In the last experiment (experiment 10), a mixture of 2mmol l21K+and 4mmol l21
Ca2+was employed as a test solution. The specimens accumulated more in the reference
solution than in the test solution (D<1). In this case, Atwas virtually equal to Ar, while Pr
was smaller than Pt(Pr<Pt=1). Trwas, therefore, smaller than Tt, and D was, accordingly,
less than 1.
Our results clearly demonstrate that the steady-state chemoaccumulation of specimens of Paramecium caudatum is dependent on both the pass ratio and the arrival rate. The pass ratio was related to the avoiding response exhibited by the specimens at the border. In contrast, the arrival rate was dependent on the kinetic activities of the specimens in each solution. A was lower when V was lower in a solution of high K+concentration. F
was higher when V was lower. It is presumed that A is proportional to the probability that the specimens arrive at the border. The probability is theoretically lower when V is lower and/or F is higher. Therefore, V and F act synergistically to determine the arrival rate. Theoretical considerations on the arrival rate in relation to the kinetic activities will appear elsewhere.
It should be noted that the test solution with high [K+] caused an avoiding response in
specimens arriving at the border from the reference solution, while the same solution lowered V and raised F for specimens that had entered it. In contrast, the reference solution caused escape (orthophobic) responses in specimens that arrived at the border from a test solution with a higher [K+], and the reference solution made V higher and F
therefore, acted antagonistically to establish the chemoaccumulation. This means that a solution discouraging specimens from entering into it encourages them to stay in it, and a solution that encourages them to enter it, discourages them from staying in it, or encourages them to leave it. The antagonism was clearly demonstrated in the present experiments in terms of the translocation rate, T, as the product of A and P. At one extreme, the accumulation was determined solely by the kinetic activities when the phobic response was negligible (Pr=Pt=1; no phobic response occurred: experiments 3, 4)
while, at the other extreme, accumulation was determined only by the klinophobic response when kinetic activities were the same in both solutions ( Ar=At: experiment 10).
In general, the accumulation was determined by both the kinetic activities and the klinophobic response. Van Houten’s classification of the repellents and attractants for
Paramecium into two categories, I and II, is consistent with and can be explained in terms
of A and P, i. e. mechanism I for the chemokinesis of Van Houten corresponds to the pass-ratio-dominated accumulation in wild-type specimens and to the arrival-rate-dominated accumulation in pawn mutants. Mechanism II corresponds to the arrival-rate-dominated accumulation in wild-type specimens.
In the present experiments, special attention was focused onto the chemoaccumulation of Paramecium caudatum in K+-containing solutions. It is well known that K+produces a
membrane depolarization in Paramecium when externally applied. Moreover, ciliary motile activity, on which most of the swimming behaviour of Paramecium depends, is under the control of membrane potential responses (Eckert, 1972; Eckert and Naitoh, 1972; Naitoh, 1974, 1982; Eckert and Brehm, 1979). A specimen swimming in the reference solution experiences a rapid increase in external [K+] when it crosses into a test
solution of higher [K+]. An increase in [K+] produces a membrane depolarization,
causing first a klinophobic response and then reducing V and increasing F. In contrast, when the specimen crosses the border back into the reference solution it experiences a sudden decrease in [K+]. This decrease produces a membrane hyperpolarization, causing
an initial orthophobic response and then V rises while F falls. The change in the level of the membrane potential and the resultant changes in motile activity increase as [K+]
increases. It is, therefore, concluded that the chemoaccumulation of specimens of
Paramecium caudatum in a K+-containing test solution is controlled by
membrane-potential-mediated motile responses.
It should be noted here that the membrane potential is the sum of the transmembrane diffusion potential and the surface potentials. The diffusion potential is determined by the ratio of K+concentration to the square root of Ca2+concentration, the ‘Ja ratio’, and the
surface potential is dependent on the concentrations of these cations (Hook and Hildebrand, 1980; Onimaru and Naitoh, 1982). The kinetic activities of Paramecium are primarily dependent on the diffusion potential, while the phobic responses are dependent on both diffusion and surface potentials (Naitoh, 1968; Naitoh and Eckert, 1968; Machemer, 1989). This is well demonstrated in experiment 10, where Arwas equal to At,
since the Ja ratio of the test solution was the same as that of the reference solution (1.0); at the same time Prwas lower than Pt, since the surface membrane was depolarized by the
higher ionic strength of the test solution.
concentration of chemicals in the solutions. They are modified by temperature, by light intensity, by the physical shape of the vessels containing the specimens and even by the density of the specimens. The conditions under which the culture of Paramecium was raised affect motile activities.
Though it is not clearly shown in Table 1, the swimming velocity of the specimens in the reference solution was often higher when the K+concentration of the test solution was
higher. This indicates that the specimens returning to the reference solution swam faster than those that stayed in the reference solution. This suggests the presence of a rather slow adaptation of the kinetic activities to a change of solution. The degree of the phobic responses at the border was also affected by the time that the specimens stayed in each solution. Detailed analysis of these adaptation phenomena and their correlates with the chemoaccumulation process remain unexamined.
Quantitative analysis of the distribution of free-swimming microorganisms in terms of the arrival rate and the pass ratio greatly contributes to an understanding of fundamental mechanisms common to various types of accumulation behaviour exhibited by microorganisms.
We thank Dr K. Sugino for theoretical considerations of the accumulation of free swimming microorganisms. We thank Dr D. Macer for reading the manuscript. We also thank the following organizations for their financial support: Mitsubishi Foundation, Nippon Petrochemical Co. Ltd, Honda R & D Co. Ltd and the Ministry of Education, Science and Culture of Japan (411802, 510902, 56105002).
References
DIEHN, B., FEINLEIB, W., HAUPT, E., HILDEBRAND, E., LENCI, F. ANDNULTSCH, W. (1977). Terminology of behavioral responses in motile microorganisms. Photochem. Photobiol. 26, 559–560.
ECKERT, R.(1972). Bioelectric control of ciliary activity. Science 176, 473–481.
ECKERT, R. ANDBREHM, P. (1979). Ionic mechanisms of excitation in Paramecium. A. Rev. Biophys.
Bioeng. 8, 353–383.
ECKERT, R. AND NAITOH, Y. (1972). Bioelectric control of locomotion in ciliates. J. Protozool. 19, 237–243.
FRANKEL, G. S. ANDGUNN, D. L.(1961). The Orientation of Animals. New York: Dover Publ. Inc. HOOK, C. ANDHILDEBRAND, E. (1980). Excitability of Paramecium and the significance of negative
surface charges. J. math. Biol. 9, 347–360.
JACOBS, M. H.(1967). Diffusion Processes. New York: Springer Verlag.
JENNINGS, H. S.(1906). Behavior of The Lower Organisms. New York: Columbia University Press. MACHEMER, H. (1989). Cellular behaviour modulated by ions: Electrophysiological implications.
J. Protozool. 36, 463–487.
NAITOH, Y.(1964). Determination of a physiological saline solution for Opalina. Zool. Mag. (Tokyo) 73, 267–274.
NAITOH, Y. (1968). Ionic control of the reversal response of cilia in Paramecium caudatum. J. gen.
Physiol. 51, 85–103.
NAITOH, Y.(1974). Bioelectric basis of behavior in protozoa. Am. Zool. 14, 883–895.
NAITOH, Y. (1982). Protozoa. In Electrical Conduction And Behaviour in ‘Simple’ Invertebrates (ed. G. A. B. Shelton), pp.1–48. Oxford: Clarendon Press.
NAITOH, Y. ANDECKERT, R. (1968). Electrical properties of Paramecium caudatum: Modification by bound and free cations. Z. vergl. Physiol. 61, 427–452.
NAKAZATO, H. ANDNAITOH, Y. (1980). Factors determining the chemotactic behavior in Paramecium.
NAKAZATO, H. ANDNAITOH, Y. (1981). Chemotaxis in Paramecium caudatum. Zool. Mag. (Tokyo) 90, 677.
NAKAZATO, H. AND NAITOH, Y. (1982). Chemotaxis in Paramecium caudatum. II. Responses to attractants and repellents. Zool. Mag. (Tokyo) 91, 422.
ONIMARU, H. ANDNAITOH, Y. (1982). Liberation of bound calcium and opening of calcium channels in
Paramecium caudatum. Zool. Mag. (Tokyo) 91, 422.
VANHOUTEN, J.(1977). A mutant of Paramecium defective in chemotaxis. Science 198, 746–748. VAN HOUTEN, J. (1978). Two mechanisms of chemotaxis in Paramecium. J. comp. Physiol. 127,
167–174.
VANHOUTEN, J.(1992). Chemosensory transduction in eukaryotic microorganisms. A. Rev. Physiol. 54, 639–663.
VAN HOUTEN, J., HANSMA, H. AND KUNG, C. (1975). Two quantitative assays for chemotaxis in
Paramecium. J. comp. Physiol. 104, 211–223.
VANHOUTEN, J., HAUSER, D. C. R. ANDLEVANDOWSKY, M.(1981). Chemosensory behavior of protozoa. In Biochemistry and Physiology of Protozoa (ed. M. Levandowsky and S. Hutner), pp. 67–125. New York: Academic Press.