Jeffrey J. Brown 1, 2 John
R.
Hesselink 1 John F. Rothrock3This articles appears in the May/June 1988
issue of AJNR and the August 1988 issue of AJR. Received April 24, 1987; accepted after revision November 4, 1987.
Presented in part at the annual meeting of the American Society of Neuroradiology, San Diego,
January 1986.
1 Department of Radiology, and the Magnetic
Resonance Institute, University of California, School of Medicine, San Diego, CA 92103. Address reprint requests to J. R. Hesselink, UCSD Medical Center, 225 Dickinson St., San Diego, CA 92103.
2 Present address: Department of Radiology, University of California School of Medicine, San Francisco, CA 94143.
3 Department of Neurology, and Magnetic Res-onance Institute, University of California, School of Medicine, San Diego, CA 92103.
AJNR 9:477-482, May/June 1988 0195-6108/88/0903-0477
© American Society of Neuroradiology
477
MR and CT
of Lacunar Infarcts
Twenty-two patients with clinical signs and symptoms compatible with lacunar tran-sient ischemic attack or stroke of varying chronicity were evaluated with MR imaging. CT was also performed in 21 of these patients. MR revealed small, deep cerebral lesions in locations appropriate to the clinical symptoms in 19 patients. Lacunar infarcts were imaged by CT in 11 patients; however, no lesions were identified on CT that were not detected with MR. Presumed lacunar infarcts were identified on MR images in 17 additional patients. Lacunae generally appeared as focal areas of decreased signal intenSity on T1-weighted images and as focal areas of increased signal intensity on T2-weighted images. T2-T2-weighted MR images detected a greater number of lacunar infarcts than did mixed T1-/T2-weighted images, which in turn detected more lacunae than did T1-weighted images. In general, acute lacunar infarcts (within 1 week of onset or recurrence of clinical symptoms) were seen only on T2-weighted images, while chronic lesions (more than 1 week) were seen on both T1- and T2-weighted images.
Our results indicate that MR is superior to CT for evaluating lacunar infarcts, and second, that T2-weighted images are more sensitive than T1- and mixed T1-/T2-weighted images for detecting lacunar infarcts.
Lacunar stroke accounts for up to 19% of all cerebral infarctions [1]. Although patients with lacunar disease generally manifest one of a number of well-defined
lacunar syndromes, there is an overlap in the clinical presentation of acute lacunar
infarction with ischemic insults to the cerebral cortex, especially in the setting of unstable carotid artery disease [2]. An important role of the neuroradiologist in
evaluating a stroke patient is to help characterize the pathophysiology of the
ischemic event, as this may guide the clinician in the choice of therapy.
The purpose of this study was to evaluate the efficacy of MR imaging in the evaluation of patients with presumed lacunar transient ischemic attacks or stroke, to compare the sensitivity of MR and CT in the setting of acute and chronic lacunar disease, and to describe the MR characteristics of lacunar infarctions.
Subjects and Methods
Twenty-two patients with presumed lacunar transient ischemic attacks or stroke were
evaluated with MR. CT was also performed in all but one of these patients. Each patient had a history, or current manifestations, of lacunar ischemia, including pure motor deficit, pure sensory deficit, or motor/subcortical sensory deficit with or without associated dysarthria but
without dysphasia or visual impairment. The patients included 10 men and 12 women, 42-83 years old. Ten of the patients (group 1) presented with multiple lacunar attacks defined
as two or more discrete episodes of anterior circulation cerebral ischemia within 24 hr of initial evaluation or three or more such episodes within 72 hr preceding evaluation. Eighty
percent or greater resolution of neurologic deficits between attacks was required for inclusion
in this acute group. MR and CT scanning were performed within 48 hr of the most recent
symptomatic episode in each case. Five patients (group 2), considered to have recent or
subacute lacunar stroke, were evaluated within 30 days (48 hr, 4 days, 5 days, 11 days, and
remote or chronic lacunar stroke were evaluated more than 3 months after the onset of symptoms.
Presumed lacunar infarcts were identified in 17 additional patients (group 4) in a retrospective review of MR images obtained over a 4-month period. This group included nine men and eight women 47-81 years old. Since no recent ischemic episodes were reported, these infarcts were considered to be of the remote type.
MR images were obtained on a superconducting 1.5-T MR sys-tem: A slice thickness of 5 mm was used with a 2.5-mm gap between slices. Axial images were obtained on a 256 x 256 matrix with a 20-cm field of view. T1-weighted pulse sequences consisted of 600/25/ 2 (TRfTE/excitations), mixed T1-fT2-weighted sequences of 2000/ 25-35/2, and T2-weighted sequences of 2000/60-70/2. High-reso-lution CT was performed on aGE 9800 or Technicare 2020 scanner with a 10-mm slice thickness and contiguous sectioning.
T2-weighted and mixed T1-fT2-weighted images were obtained in all patients. T1-weighted images were obtained in 30 of 39 patients;
five additional patients had T1-weighted images, but the anatomic sites shown to contain lacunar lesions by CT or T2-weighted imaging were not included on the images. CT was performed in 21 of 22 patients in the prospective groups (groups 1-3) and in three of 17 patients in group 4. The CT scans and MR images were reviewed to determine the number of lacunar infarctions detected by each imaging sequence.
For the purpose of this study, lacunar infarcts were defined as discrete areas of decreased attenuation on CT or abnormal signal intenSity on MR ranging from 2 to 15 mm in diameter and located in the basal ganglia, internal capsule, thalamus, brainstem, or corona radiata inferiorly to the level of the lateral ventricles. Data from both the prospective and retrospective portions of the study were com-bined to make some basic observations about the MR appearance of lacunar infarcts with different imaging sequences. In addition to noting the morphologic features on the MR image, Signal-intensity values were obtained of each lacuna by using a normal-appearing white-matter structure, such as the splenium of the corpus callosum,
as an intemal standard. The signal-intensity values were expressed as ratios of the signal intensity of the lacunar infarcts compared with the normal white matter. A ratio of greater than one indicates that the lacuna has a signal intensity greater than that of white matter;
conversely, a ratio of less than one corresponds to a lacuna with low signal intenSity relative to white matter.
All data are expressed as the group mean ± 1 SO. The Wilcoxon signed ranks test was used to compare signal-intensity ratios ob-tained with each imaging technique to one. The two-sample Wilcoxon test was used to compare signal-intensity ratios among groups 1-4 with each imaging technique.
Results
The number of lacunae imaged within each group and their anatomic sites are listed in Table 1. Groups 1-3 constitute
the prospective portion of this study. In these groups, a total of 58 lacunae were imaged in 22 patients (Table 2). In two patients with presumed lacunar transient ischemic attacks (group 1), no lesion was detected with either MR or CT. This
is most likely due to the acute and/or transient nature of the
ischemic events in these patients. In group 4, which was analyzed retrospectively, 42 lacunae were imaged in 17 pa-tients (Table 2). Undoubtedly, additional lacunae were missed owing to the 2.5-mm interslice gap used on the MR images,
• GE Signa.
partial-volume averaging, and inherent limitations in contrast and spatial resolution of both imaging techniques. The per-centages stated below are based on the total number of lacunae detected by MR and/or CT rather than on the true total number of lacunae in our study population. Absolute numbers would require careful pathologiC study of each case. In the prospective portion of the study (groups 1-3), CT detected 28% of the lacunae that were imaged by MR in patients studied by both techniques. No lacunae identified on CT were missed by MR. The T2-weighted sequence was the
most sensitive MR technique, detecting 98% of the lacunae that were imaged (Table 2). The one lacuna not detected on T2-weighted images was imaged only on T1-weighted im-ages. Sixty-seven percent of the total number of lacunae identified were detected on mixed T1-fT2-weighted images and 40% on T1-weighted images.
In the patients analyzed in a retrospective manner (group 4),98% of the lacunae were seen on T2-weighted MR images (Table 2). The one lacuna not seen on T2-weighted images was detected on both T1- and mixed T1-fT2-weighted im-ages. Eighty-eight percent of lacunae were visualized with mixed T1-fT2-weighted images and 46% with T1-weighted images. In patients who had both CT and MR imaging, CT detected 64% of the lacunae that were seen on MR. Again, no lacunae detected by CT were missed by MR.
Lacunae generally appeared as focal areas of decreased signal intensity on T1-weighted images and as foci of in-creased signal intenSity on T2-weighted images (Table 3, Figs. 1 and 2). In addition, lacunae were significantly brighter on second-echo (T2-weighted) images than on first-echo (mixed T1-fT2-weighted) images. A total of eight lacunae in seven patients had an atypical appearance on the mixed T1-/ T2-weighted images, characterized by a perimeter of high signal intensity (signal-intensity ratio = 1.020 ± 0.007) sur-rounding a lower-intensity center (Signal-intensity ratio =
1.007 ± 0.005) (Fig. 3). We postulate that this appearance is
from central cavitation with surrounding gliosis.
Of the 22 patients in groups 1-3, 19 had evidence of lacunar infarction on MR and 11 on CT. The MR images and CT scans were normal in three. The acute and subacute lacunae (group 2) were detected with a T2-weighted se-quence, but they were not seen on T1-weighted images or CT scans (Table 2). In patients with multiple lacunar attacks (group 1) or a history of remote lacunar stroke (group 3), some lacunae were detected by CT scanning and T1-weighted imaging, although a greater percentage of lesions was identified on T2-weighted images.
In patients who had both CT and MR imaging, only one (7%) of 15 brainstem lacunae detected by MR was also seen on CT. However, in anatomic sites other than the brainstem, 24 (43%) of 56 lacunae seen by MR were also seen on CT.
The Signal-intensity ratios were significantly higher in group
AJNR:9, May/June 1988 MR AND CT OF LACUNAR INFARCTS 479
TABLE 1: Locations of Lacunae in Relation to Clinical Group
No. of Lacunae
Group Lentiform Internal Corona
Nucleus Caudate Capsule Thalamus Radiata Brainstem Other" Total
1, Lacunar TIAs 6 1 6 5 5 2 0 25
2, Recent lacunae 1 0 1 2 2 6 1 13
3, Remote lacunae 1 1 6 5 1 4 2 20
4, Retrospective 7 1 11 7 2 13 1 42
Total 15 3 24 19 10 25 4 100
Note.-Lacunae that involve two or more adjacent anatomic structures are listed according to the primary site of involvement. • Claustrum, external capsule, paracapsular area.
TABLE 2: Detection of Lacunar Infarcts by MR and CT
No. of Patients No. (%) of Lacunae Detected with:8
With MR No. of Mixed
Group Total and/or Lacunae T1- T1-fT2- T2- CT
CT Weighting Weighting
Detection Weighting
Prospective:
1, Lacunar TIAs 10 8 25 14/23 (61) 16/25 (64) 24/25 (96) 10/25 (40)
2, Recent lacunae 5 5 13 0/9 8/13 (62) 13/13 (100) 0/12
3, Remote lacunae 7 6 20 5/16 (31) 15/20 (75) 20/20 (100) 6/20 (30)
Subtotal 22 19 58 19/48 (40) 39/58 (67) 57/58 (98) 16/57 (28)
4, Retrospective 17 17 42 12/26 (46) 37/42 (88) 41/42 (98) 9/14 (64)
Total 39 36 100 31/74 (42) 76/100 (76) 98/100 (98) 25/71 (35)
Note.- TIAs = transient ischemic attacks.
• No. of lacunae imaged by specific technique/total no. of lacunae imaged by ali techniques. Totals vary because some patients did not have CT scanning, and
in some patients mixed T1-/T2-weighted images were obtained and exclusively T1-weighted images were not.
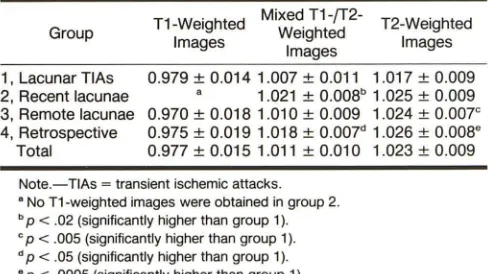
TABLE 3: MR Signal Intensities of Lacunar Infarcts
Group
1, Lacunar TIAs 2, Recent lacunae 3, Remote lacunae 4, Retrospective
Total
T1-Weighted Mixed T1-fT2- T2-Weighted
I mages Weighted Images Images
0.979 ± 0.014 1.007 ± 0.011 1.017 ± 0.009 1.021 ± 0.008b 1.025 ± 0.009 0.970 ± 0.018 1.010 ± 0.009 1.024 ± 0.007e 0.975 ± 0.019 1.018 ± 0.007d 1.026 ±
0.008e 0.977 ± 0.015 1.011 ± 0.010 1.023 ± 0.009
Note.- TIAs = transient ischemic attacks. • No T1-weighted images were obtained in group 2.
b P < .02 (significantly higher than group 1). c P < .005 (significantly higher than group 1). d P < .05 (significantly higher than group 1). • P < .0005 (significantly higher than group 1).
Discussion
Lacunar infarcts are small. deep cerebral infarcts. most often encountered in the setting of hypertension. These in-farcts result from occlusion of very small penetrating branches that arise proximally from the major cerebral arteries. including the middle and posterior cerebral arteries. the basilar artery. and. less commonly. the anterior cerebral and vertebral
arter-ies [3. 4]. Lacunae occur almost exclusively in the deep regions of the brain. predominantly involving the basal ganglia.
internal capsule. thalamus. and brainstem [5]. In 1975. Fisher [6] reported a series of 1042 consecutive autopsies in which 114 patients were found to have a total of 376 lacunae. Thirty-seven percent were in the lenticular nuclei. 16% in the pons. 14% in the thalamus. 10% in the caudate. and 10% in the internal capsule. The arterial supply of the regions of the brain at risk for lacunar infarction include the lenticulostriate branches of the anterior and middle cerebral arteries. thala-moperforating branches of the posterior cerebral arteries. and paramedial branches of the basilar artery. Arterial branches range in diameter from 100 to 500 j.Lm and are therefore generally too small to be evaluated by angiography [3]. Most of these arteries have no distal anastamoses and many are single. unbranched vessels.
[image:3.612.53.561.98.197.2] [image:3.612.51.560.261.408.2] [image:3.612.53.297.483.620.2]A
B
c
o
lacunae [3]. Less common causes of lacunar infarction include microemboli, arterial dissection, and arteritis secondary to chronic meningitis [3].
Clinically, lacunar strokes are recognized by characteristic clinical features. The most common lacunar syndrome is pure motor hemiparesis, which accounts for 30-60% of lacunar
infarcts. Other important lacunar syndromes include pure
sensory stroke, combined sensorimotor stroke, ataxic
hemi-paresis, dysarthria/clumsy hand syndrome, and a number of thalamic and brainstem syndromes [3]. Patients with lacunar
stroke often have a gradual onset of symptoms that may
progress in a stepwise, stuttering, or smooth manner [2].
Antecedent transient ischemic attack is relatively common in lacunar infarction, occurring in approximately 25% of patients
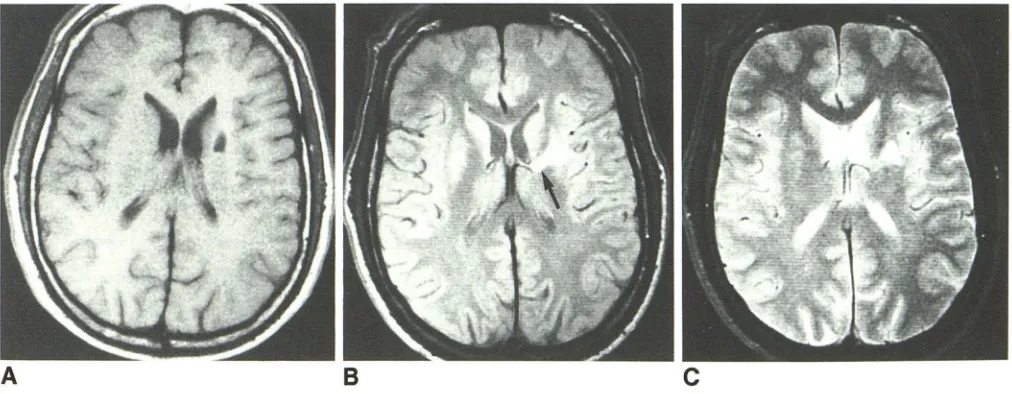
Fig. 1.-A, CT scan shows low-density lesion in left putamen (arrow).
B, Axial T1-weighted MR image, 600/25,
shows left putaminal lacuna as low-signal area. C, Mixed T1-/T2-weighted MR image, 2000/ 25, shows left putaminal lacuna and a second lesion in left thalamus/internal capsule (long ar·
row).
D, T2-weighted MR image, 2000/70, shows
lesions in left putamen and left thalamus/internal capsule (long arrow) as areas of increased sig-nal intensity. C and D also show small focal area of increased signal intensity in left insular cortex
(short arrows).
[1]. Although there tends to be a high probability of recurrence of symptoms, the prognosis in lacunar stroke is generally favorable and current therapy is prophylactic, primarily involv-ing careful surveillance for and medical management of hy-pertension.
[image:4.612.56.392.80.545.2]AJNR:9, May/June 1988 MR AND CT OF LACUNAR INFARCTS 481
A
B
C
Fig. 2.-74-year-old man with right-sided face, arm, and leg numbness. MR images were obtained 11 days after onset of clinical symptoms. CT was not performed.
A, Axial T1-weighted MR image, 600/25, shows no abnormalities.
8 and C, Mixed T1-/T2-weighted image, 2000/25 (8), and T2-weighted image, 2000/70 (C), show left thalamic lacuna (arrows) as areas of increased
signal intensity. Failure of T1-weighted image to show lesion is compatible with relatively recent onset of symptoms.
B
C
Fig. 3.-A, T1-weighted MR image, 600/25, shows lacuna in superior aspect of left putamen as area of decreased signal intensity.
8, Mixed T1-/T2-weighted MR image, 2000/25, at slightly lower level shows lacuna in left putamen with bright rim surrounding lower-intensity center, suggesting cavitation. High-signal lesion involves genu of left internal capsule (arrow).
C, T2-weighted MR image, 2000/70. Central part of putaminal lesion has higher signal than surrounding tissue.
Focal ischemic insults to the brain, unless complicated by hemorrhage, are seldom identified on CT scans during the first 24 hr of ischemia. Most lacunae less than 2 mm in diameter cannot be resolved by current CT scanners [8-10],
and brain stem lacunae larger than 2 mm in diameter are routinely missed owing to artifacts [5].
The detection of acute cerebral ischemic lesions by both CT and MR is based in large part on the development of edema in the ischemic region [11, 12]. Ischemic brain edema is thought to be a combination of cytotoxic edema, which is
predominantly intracellular and of major importance during the early stages of acute ischemia, and vasogenic edema,
which occurs later and involves the leakage of intravascular fluid and proteins through an impaired blood-brain barrier into predominantly extracellular spaces [11]. The increase in intra
-cellular water content in cytotoxic edema is from ischemic
inhibition of metabolism, which results in a loss of energy sources that maintain ionic concentration gradients between intra-and extracellular compartments [11].
[image:5.612.60.558.84.282.2] [image:5.612.54.560.350.547.2]acute and subacute lacunae (Table 2, Fig. 1). The superior sensitivity of MR during the acute phase of ischemia is most likely due to the capability of T2-weighted imaging to detect very small changes in tissue water content. In experimental animals, abnormal accumulation of water in ischemic brain tissue is detectable within 5 min after the onset of ischemia
[11]. Studies have shown that relaxation times of acutely
ischemic brain tissue are prolonged when compared with
values obtained from normal brain tissue [13-16].
Brant-Zawadzki et al. [16] detected cerebral ischemic changes on
MR images as early as 30 min after unilateral occlusion of the
middle cerebral artery in cats. By 4 hr after middle cerebral artery occlusion they detected MR evidence of cerebral
ische-mia in all 13 experimental animals in their study.
The current data indicate that MR is more sensitive than CT in the detection of recurrent lacunar attacks, as well as recent and remote lacunar stroke (Table 2). T2-weighted images were found to be more sensitive than T1- (Figs. 1 and
2) or balanced T1- and T2-weighted images for detecting these lesions. These conclusions are based on several as-sumptions that should be examined:
First, we assumed that any small, discrete lesion in an anatomic site characteristic for lacunae represented a region
of lacunar ischemia or infarction. Many of these lesions
oc-cupied regions in the brain that correlated well with the clinical symptomatology; however, for many other lesions, there was no clinical correlation. The assumption that these lesions are indeed lacunae is supported by the CT findings in previous studies, which correlated the CT and pathologic appearances of lacunae [17]. However, for the lesions that were detected only with MR, such pathologic correlation has not been ac-complished. The situation is further complicated by the
prev-alence of focal white-matter lesions (usually seen as areas of
increased signal intensity on T2-weighted images) which are
identified routinely on MR images in older patients. These
lesions, often of little or no apparent clinical significance, may represent areas of chronic ischemia, but again pathologic proof is lacking, and the potential exists for confusion with areas of lacunar ischemia or infarction. Finally, while our study compares the sensitivities of CT and MR, and of different MR
imaging techniques with each other, the absolute sensitivities
of these techniques in the detection of lacunar infarcts, es-pecially in the acute setting, are unknown and await further pathologic studies.
Our data were drawn from routine clinical imaging studies with standard technical parameters for both CT and MR. The
10-mm slice thickness used for CT scanning is subject to
partial-volume effects. The 2.5-mm interslice gap may account
for the two lacunae missed by MR. Very likely, both MR and
CT would have detected more lacunar infarcts if thinner
contiguous or overlapping sections were obtained with longer imaging times, but such techniques are impractical in a routine clinical setting.
On the basis of our results, in the clinical setting of sus-pected lacunar disease, T2-weighted MR imaging in the axial or coronal plane is recommended for screening for lacunar infarction. If a high-signal abnormality is identified within a lacunar territory, then T1-weighted images should be obtained through the area to further characterize the abnormality and to exclude hemorrhage. If the abnormality is not seen on T1-weighted images, it is more likely to be a recent lacuna (Table 3, Fig. 2), and an MR follow-up study may show evolution of the infarct. The signal intensity and MR appearance of blood on T1- and T2-weighted images are variable, depending on the age of the hemorrhage [18]. Finally, although not patho-logically proved, the signal intensity on the mixed
T1-fT2-weighted image may indicate whether or not central cavitation exists (Fig. 3), and this information would help distinguish acute from remote lacunar infarcts.
REFERENCES
1. Mohr JP, Caplan LR, Melski JW, et al. The Harvard cooperative stroke registry: a prospective registry. Neurology 1978;28:754-762
2. Miller VT. Lacunar stroke: a reassessment. Arch Neuro/1983;40: 129-134
3. Mohr JP. Lacunes. Neurol Clin 1983;1 :201-221
4. Fisher CM. Lacunar strokes and infarcts: a review. Neurology
1982;32: 871-876
5. MohrJP. Lacunes.Stroke 1982;13:3-11
6. Fisher CM. Small, deep cerebral infarcts. Neurology 1965;15:774-784
7. Donnon GA, Tress BM, Bladin PF. A prospective study of lacunar infarction
using computerized tomography. Neurology 1982;32:49-56
8. Pullicino P, Nelson RF, Kendall BE, et al. Small deep infarcts diagnosed on computed tomography. Neurology 1980;30:1090-1096
9. Weisberg LA. Computed tomography and pure motor hemiparesis. Neu-rology 1979;29: 490-495
10. Weisberg LA. Lacunar infarcts: clinical and computed tomographic
corre-lations. Arch Neurol 1982;39: 37 -40
11. Katzman R, Casen R, Klatzo I, et al. IV. Brain edema in stroke: study group on brain edema in stroke. Stroke 1977;8:512-540
12. Go KG, Edzes HT. Water in brain edema. Arch Neuro/1975;32:462-465
13. Buonanno FS, Pykett IL, Brady TJ, et al. Proton NMR imaging in
experi-mental ischemic infarction. Stroke 1983;14:178-184
14. Spetzler RF, Zabramski JM, Kaufman B. Acute NMR changes during MCA occlusion: a preliminary study in primates. Stroke 1983;14:185-191
15. Mano I, Levy RM, Crooks LE, et al. Proton nuclear magnetic resonance imaging of acute experimental cerebral ischemia. Invest Radiol
1983; 18: 345-351
16. Brant-Zawadzki M, Pereia B, Weinstein P, et al. MR imaging of acute experimental ischemia in cats. AJNR 1986;7:7-11
17. Alcala H, Gado M, Torack RM. The effects of size, histologic elements and water content in the visualization of cerebral infarctions: a computerized cranial tomography study. Arch Neuro/1978;35: 1-7
18. Gomori LM, Grossman RL, Goldberg HL, et al. Intracranial hematomas: