Through the processes of selection, there has been a remarkable convergence of both the designs and materials used in natural and synthetic structural systems. This is not surprising, since biological systems experience mechanical demands similar to those imposed on man-made systems. Biological structural elements, which often show high fracture toughness, have been used in man-made systems for millennia but have only recently been recognized as model designs for crack growth resistance. These elements are now known to be formed from nanoscale composites which are fundamental in providing high fracture toughness.
Most mechanically characterized structural biomaterials are composites of two or more nanoscale elements which usually include polymeric fibres embedded in either a globular or amorphous matrix. For example, wood cell walls are formed from a composite of cellulose fibres (3.5 nm in diameter) in a lignin matrix; other biological composites include insect cuticle (chitin fibres in a protein matrix) and bone (hydroxyapatite crystals in a collagen fibre matrix). In man-made composites, the fibres have a characteristically high tensile stiffness (or modulus) and serve to provide most of the material strength; the matrix usually binds fibres and transfers stresses to them (usually by shear), aids in withstanding
compressive forces and inhibits cracks from propagating through the fibres, which would otherwise be in direct contact (Harris, 1980). Composites with weak (but not too weak) fibre–matrix interfaces also offer a crack-blunting effect by increasing the radius of curvature of the crack tip and by diverting the crack along the interface (Cook and Gordon, 1964). Crack diversion releases strain energy that would otherwise fuel the crack lengthening process, thereby increasing the fracture toughness. When combined, the two components, or phases, synergistically raise the fracture toughness beyond that of the individual elements. However, although this observation has been made in synthetic materials, it is not often shown empirically in biomaterials, and even in a highly studied natural composite such as keratin, the mechanical contributions of each phase are still speculative.
Keratin is a protein-based fibre-reinforced nanoscale composite that is prevalent in the integument of terrestrial vertebrates. Hoof, horn, nail, claw and feather are examples of structures formed from this class of proteins. Keratins have filamentous (intermediate filaments, IFs; Parry et al., 1987; Steinert, 1991; Fraser and Parry, 1993; Steinert et al., 1993a,b, 1994; Parry, 1995) and matrix (globular proteins; Feughelman, 1994) phases that are believed to have analogous roles to those JEB1818
Small-scale components of the equine hoof wall were tested to determine their mechanical roles in the morphological hierarchy. Macroscale tensile tests conducted on samples of the inner wall tubules and intertubular material showed a sixfold difference in mean initial stiffnesses (0.47 and 0.08 GPa, respectively), indicating that the inner wall tubules stiffen the wall along its longitudinal axis. The similarity in material properties of tubule and intertubular samples from the mid-wall suggests that tubules in this region offer only minor reinforcement along the longitudinal axis.
Microscale tests conducted on rows of keratin strands from the inner wall tubules and intertubular material, and on intertubular keratin strands of the mid-wall, produced estimates of the stiffnesses of the hydrated matrix
(0.03 GPa) and intermediate filament (IF; 3–4 GPa) components of the nanoscale (α-keratin) composite. The results from these tests also suggest that the properties of the keratin composite vary through the wall thickness. Birefringence measurements on inner wall and mid-wall regions agree with these observations and suggest that, although the keratin IF volume fraction is locally constant, the volume fraction changes through the thickness of the wall. These findings imply that modulation of the hoof wall properties has been achieved by varying the IF volume fraction, countering the effects of specific IF alignments which serve another function and would otherwise adversely affect the modulus of a particular region.
Key words: horse, hoof wall, material stiffness, cracking, keratin. Summary
Introduction
MICROMECHANICS OF THE EQUINE HOOF WALL: OPTIMIZING CRACK
CONTROL AND MATERIAL STIFFNESS THROUGH MODULATION OF THE
PROPERTIES OF KERATIN
MARIO A. KASAPI* ANDJOHN M. GOSLINE
Department of Zoology, University of British Columbia, Vancouver, British Columbia, Canada V6T 1Z4
*e-mail: [email protected] (http://www.zoology.ubc.ca/labs/biomaterials/)
of the phases of fibre-reinforced composites. Beyond the composite nature of α-keratin at the nanoscale, the solid,
keratinized cells that comprise specialized tissues such as horn and hoof wall are further organized into either hollow tubular structures (approximately 200µm in diameter) or intertubular material, forming what has been suggested to be a macroscale composite (Fig. 1; Nickel, 1938; Ryder, 1962; Kasapi and Gosline, 1997), and the hoof wall may therefore be considered as a multi-level or hierarchical composite. The tubules have been the focus of a number of previous studies (Nickel, 1938; Wilkens, 1964) that aimed to determine the precise structure and function of these wall components.
The mechanical functions of hoof wall tubules appear to be more complex than that of a simple fibre of a fibre-reinforced composite; design complexity in both the tubular and intertubular components facilitates the control of crack growth (Kasapi and Gosline, 1997) and appears to increase fracture toughness. However, two fundamental, long-standing hypotheses of tubule function have yet to be tested: (1) that the tubules reinforce the wall along their axis of orientation and therefore, to some degree, are analogous to the fibres of fibre-reinforced composites at the macroscale, and (2) that the IFs and globular proteins of keratin form a composite at the nanoscale.
Results from a previous study on the tensile properties of hoof wall from different regions through the hoof wall thickness indicate that IF alignment does not correlate with mechanical stiffness (Kasapi and Gosline, 1997) and so
appear to refute the analogy of keratin as a typical composite. However, since IFs appear to increase wall strength along their axes of orientation (Kasapi and Gosline, 1996, 1997), it may be that the properties of keratin change through the hoof wall thickness, and that the functions of the phases are still conserved. If so, then on a local scale (within a small area of the wall), IF orientation should correlate with tensile stiffness, and each hoof wall cell should behave mechanically as a fibre-reinforced composite. The structures that they comprise should therefore behave according to the alignment of their IFs and the mechanical properties of the keratin in that region.
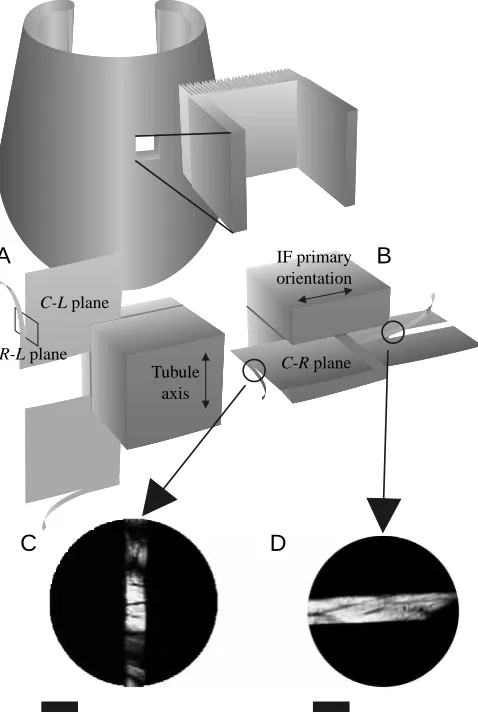
We have recently detailed the three-dimensional IF orientation within keratinized cells of the equine hoof wall toe region (Kasapi and Gosline, 1997) and have determined that the innermost region of the hoof wall is morphologically ideal for determining the mechanical functions of the wall micro and macro components. It contains large (over 300µm in diameter) easily isolated tubules with IFs organized primarily along the tubule axis (Fig. 2; see Kasapi and Gosline, 1997). In this region, most of the IFs in the surrounding intertubular material are aligned nearly perpendicular to the tubule axis. Simple tensile tests on isolated samples of tubules and intertubular material from this region may provide insight into the mechanical role of these substructures on a local scale and may suggest the roles of their constituent phases. Mechanical testing at a very fine scale may be conducted to determine the mechanical properties of the phases, since the exact orientation
Tubule
Intertubular material
100 µm
8 nm
[image:2.609.231.555.425.731.2]Intermediate filament
of IFs within cells is now known (see Kasapi and Gosline, 1997).
Using the morphological map, fine strands of hoof wall material may now be obtained in which the precise IF orientation is known. By testing keratin strands from specific regions in orthogonal directions and with known IF alignment, estimates of the tensile stiffness of the nanoscale fibre and matrix phases may be obtained. This procedure would be more representative of the true keratin phases than results from previous studies which utilized material (usually wool hairs) composed of many cells joined in series and in parallel.
The modulus of a fibre-reinforced composite in any particular direction depends on the moduli and volume fractions of the fibrous and matrix phases. If all fibres are aligned similarly and if a tensile force is applied parallel to the fibre axis, the modulus in that direction (E1) is given by the
Voigt estimate:
E1= EfVf+ EmVm, (1)
where E is the modulus of elasticity (or Young’s modulus), subscripts f and m denote fibre and matrix, respectively, and V
is the volume fraction. If stressed perpendicular to the fibre axis, then the modulus in that direction (E2) is:
The preceding equations are useful for predicting the modulus of a material given the moduli of the phases, but they assume that both the fibrous and matrix phases are linearly elastic and that the fibres are uniform in properties and shape, continuous and similarly aligned. In addition, the fibrous phase must be isotropic (have equal properties in all directions). These criteria are violated to some degree in most biological systems, because the fibres are usually polymeric; these equations must therefore be used with caution. They may, however, be used to provide estimates of the modulus of each phase if the overall modulus and volume fractions of each phase are known.
Hoof wall substructures are thought to be of paramount importance in providing high fracture toughness and controlling crack growth (Kasapi and Gosline, 1997). The mechanism by which they accomplish this, however, is still speculative since the mechanical properties of tubules and intertubular material are still unknown. Without information about the mechanical properties of these components, a complete understanding of the relationship between form and function is not possible. This study attempts to ascertain the functions of these substructures by quantifying the mechanical properties of isolated tubules and intertubular material specimens of equine hoof wall, and it also presents estimates of the properties of the nanoscale phases of α-keratin.
Materials and methods
Hoof wall material from the right front hoof of one horse (destroyed for reasons other than this study) was used here. It was decided that data from a single hoof were appropriate for this study to avoid adding inter-animal variability to the variance in the data, which would have made small differences more difficult to distinguish statistically. The conserved wall morphology previously observed between animals (see Kasapi and Gosline, 1997) indicated that data obtained from one animal may be generalized. The hoof was roughly cut with a bandsaw, and the hoof wall was separated from the third phalanx using a scalpel. Care was taken not to remove any of the stratum medium. Tissues were then sealed in plastic bags (to retain moisture) and refrigerated at 4 °C until used. Specific methodologies used in each type of test are described below.
Tests on samples of tubule dimensions
Tests to determine the mechanical properties of tubules and intertubular material were conducted by first sectioning hoof wall blocks in the radial–longitudinal (R-L) plane. Sections approximately 300µm thick were produced using a water-cooled Gillings-Hamco thin-sectioning machine equipped with a circular saw blade and then placed in distilled water with 0.2 % sodium azide (to prevent bacterial growth). Under a (2)
E2= EfEm .
EfVm+ EmVf Inner wall
Mid-wall
A
B
C
D
Tubule
100 µm 100 µm
Intertubular material
Tubule Intertubular
[image:3.609.51.296.74.402.2]material
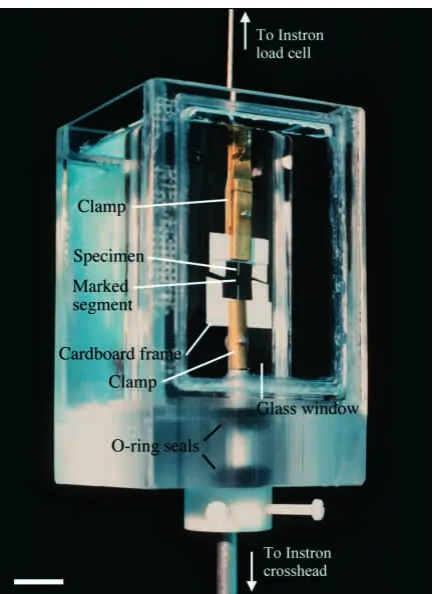
dissecting microscope, individual tubules or strips of intertubular material were dissected out with a single-edged razor blade. Final test specimen size was approximately 300µm×300µm×25 mm. Individual samples were placed on a paper towel wetted with distilled water (to minimize tissue dehydration), and the top surface of the specimen was blotted dry. A fine-tipped permanent black felt pen (Staedtler lumocolor) was used to mark a segment (mean 4.0 mm) near the centre of the specimen. Sample ends were glued to a cardboard frame using cyanoacrylate adhesive, and the frame was clamped to an apparatus designed for tensile testing of specimens under water (Fig. 3). The assembly was submerged, and the frame sides were carefully cut. The marking and adhesion steps were performed quickly (<2 min) to minimize dehydration. Tests were conducted at room temperature (approximately 20 °C).
An Instron 1122 testing machine was employed to provide a constant cross-head displacement rate of 2 mm min−1
(corresponding to a mean strain rate of approximately 3.33×10⁻³s−1). Specimen extension, however, was determined
directly by tracking the change in length of the marked reference segment using a Panasonic video camera (model CL-350) interfaced with a video dimension analyzer (VDA). A
custom-made semi-conductor strain gauge force transducer (778 V N−1at 1000 gain) provided load data. Outputs from both
devices interfaced with a personal computer and were sampled at 5 Hz using PC software (Labtech Notebook).
Force (N) and VDA (m) data were processed on a spreadsheet to convert these parameters to stress σ(N m−2) and
strain ε(∆LⲐL0, where L0is the length of the marked reference
segment), respectively. Cross-sectional areas of specimens were required to convert forces to stresses and were also necessary to ensure that the correct substructure was isolated. Used specimens were thin-sectioned immediately adjacent to either end of the marked segment using a razor blade. Sections were viewed under a compound microscope at 40× total magnification, and the images were captured using a Panasonic (model WV-BL600) video camera interfaced with a Matrox PIP frame grabber; an inner wall tubule cross-sectional sample is shown in Fig. 4. V for Windows software was utilized to digitize points necessary for the determination of cross-sectional areas.
Extension data occasionally contained periods of noisy or otherwise unusable data as the result of VDA tracking difficulties. Therefore, a polynomial function was fitted to the extension data (Fig. 5) using Tablecurve software (Jandel Scientific), and this function was used to calculate specimen strain. The initial longitudinal modulus (or stiffness), Ei,L, was
defined as the slope of a linear regression through the initial part of the stress–strain curve. A yield stress was determined using the offset method described in ASTM E8M-94a (ASTM, 1994) and an offset strain of 0.5 %. Total energy was measured as the area under the stress–strain curve.
[image:4.609.59.276.359.656.2]The above procedures with the following modifications were also used to determine the hysteresis of wall macroscale components. Specimen dimensions and strain data were not recorded since force–extension curves provide the values necessary to determine energy loss or hysteresis. Extension was provided by the cross-head movement. Each test involved a single tensile cycle to either 2 % or 40 % extension.
[image:4.609.324.545.537.692.2]Fig. 3. The chamber used in the tensile testing of specimens of tubule dimensions. Specimens were glued to a cardboard frame using cyanoacrylate adhesive and then clamped to the test apparatus. During tests, the chamber was filled with distilled water; two O-ring oil seals mounted in the floor of the chamber permitted vertical sliding of the chamber while a specimen was mounted. Scale bar, 1 cm.
Mechanical tests on horse hair
It has been suggested that hoof wall tubules are hollow simply as a result of manufacturing constraints and that solid rods would be better reinforcing elements (Kasapi and Gosline, 1997). Determination of the mechanical properties of body hairs immediately proximal to the hoof wall could therefore help to ascertain a possible compromise which may have occurred during the evolution of hoof wall. Ten body hairs were collected from the region just proximal to the hoof wall used in this study. The full length of the shaft was obtained by allowing the skin to degenerate for a few weeks at 4 °C before removal. Hairs were then stored at 4 °C in distilled water with 0.2 % sodium azide until use. Specimens were mounted and marked using the methods decribed above; however, it was not possible to track the marked segment with the video dimension analyzer. Instead, video output was routed through a Panasonic digital timer (0.01 s resolution; model WJ-810) and recorded on a Panasonic (model AG-1960) video recorder at 30 frames s−1. Strain data were obtained from taped sequences
by digitizing each end of the marked reference segment using V software. The initial 20 s period was digitized at 0.5 s intervals, to obtain high-resolution data for accurate determination of the initial stiffness, and at 4 s interval for the remainder of the test. A polynomial function was fitted to the extension data using Tablecurve software (Jandel Scientific), and this function was used to calculate specimen strain. In addition, four samples of fully hydrated horse tail hair approximately 200 mm long were tested at a strain rate of 4.2×10⁻³s−1 using the cross-head displacement to determine
strain.
Keratin strand production and mechanical testing
Fine strands of hoof wall keratin were produced to isolate micro-samples of the intracellular keratin composite for mechanical testing (Fig. 6). First, wall tissue was shaped into approximately 1 cm×1 cm×1 cm blocks that encompassed the
entire wall thickness. Sections 7µm thick were produced using a microtome (American Optical, model 820, with a stainless-steel blade) and then placed in distilled water. Specimens were then sectioned perpendicular to the plane of the section to produce narrow strips. To do this, wet sections were first sandwiched between two Teflon sheets (0.8 mm thick). A water-soluble embedding medium (Tissue-Tek O.C.T. compound) was applied to a freezing microtome stage, and a section was placed into the solution on one end. The stage was then cooled to approximately −10 °C, thereby fixing the
Time (s)
0 50 100 150 200
3 4 5 6
VDA
output (V)
Raw VDA data
[image:5.609.57.296.71.242.2]Polynomial fit
Fig. 5. A sample of raw strain data from the video dimension analyser (VDA) plotted as a function of time. A polynomial function was fitted to each set of strain data, and the function was used instead of the raw data.
Tubule axis C-L plane
IF primary orientation
C-R plane R-L plane
A
B
[image:5.609.324.563.211.568.2]C
D
specimen perpendicular to the stage surface. The Teflon sheets were then removed, and additional mounting solution was applied to secure the sections fully. The freezing microtome was equipped with a disposable stainless-steel blade and was set to produce sections 7.5µm thick. This procedure produced keratin strands measuring approximately 7µm×7.5µm×10 mm. To produce keratin strands from inner wall tubules, the first section was made in the circumferential–longitudinal (C-L) plane; the second, orthogonal section was made along the radial–longitudinal (R-L) plane (Fig. 6A). Keratin strands from the inner and middle intertubular material were produced by first sectioning blocks along the circumferential–radial (C-R) plane and then along the C-L plane (Fig. 6B). Test specimens were carefully removed from the blade by gently rolling the end of a glass rod in the melted embedding medium containing the strands. The rod was dipped into a Petri dish containing distilled water to dissolve the mounting solution and free the specimens. Strands were removed from the distilled water using a two-pronged miniature fork constructed from insect pins. Dehydration of specimens occurred almost immediately after removal from the water. Dehydrated strands were then transferred to a mechanical test system.
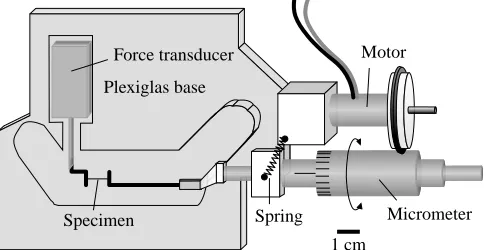
A micromechanical test apparatus (Fig. 7) was constructed to test the mechanical properties of hoof wall keratin strands at room temperature. The body of the test system was a milled Plexiglas block that fitted onto the stage of a Leitz Orthoplan polarizing compound microscope. A custom-made force transducer fitted into the well such that it was submerged in distilled water during an experiment, allowing experiments to be conducted under water. A stainless-steel wire extension was fixed to the end of the transducer beam, and another was attached to the end of a micrometer. A drive system consisting of a small motor provided a constant displacement rate (2.37 mm min−1). A mounting apparatus was constructed for
precise mounting of the strands. Specimens were fixed to the apparatus and slowly lowered across the wire extensions onto two drops of adhesive (Devcon 5 min epoxy).
During an experiment, force data were collected at 5 Hz using a personal computer with an analog-to-digital board and Labtech Notebook software. Specimens were illuminated with plane polarized light and viewed with a 40×water immersion objective lens (total magnification 400×). Tests were recorded (at 30 frames s−1) using a Panasonic (model WV-BL600) video
camera attached to the microscope; the former interfaced with the digital timer and the video recorder. Strain data were obtained from taped sequences by digitizing selected points within a single hoof wall cell using V software. Strain measurements were synchronized with force traces by determining the time of failure on the video tape and in the force record (failure occurred in a single frame). Taped sequences were digitized at 0.25 s intervals for the initial 10 s period and at 0.5 s intervals for the remainder of the test. For these sequences, it was determined that a linear regression would best describe the strain data. Captured images from taped sequences were then used to determine one dimension (that visible on the monitor) of the keratin strands, and it was estimated that the second dimension was 7µm.
Determination of the effects of dehydration and freezing
To investigate the possible effects of dehydration (which occurred during test specimen preparation) on the stiffness of rehydrated wall tissue, three-point bend tests were conducted on fully hydrated specimens before and after dehydration at room temperature. Dynamic tests were conducted because this methodology does not require mounting and thereby avoids material dehydration. Our dynamic test system was not sensitive enough to determine the properties of keratin strands or of specimens with the dimensions of individual tubules; consequently, specimens for this series of experiments were thicker, measuring approximately 12 mm×1 mm×1 mm. The three-point bend apparatus (described previously in Kasapi and Gosline, 1996; Katz and Gosline, 1992) ultimately provides the storage modulus parameter E′ as a function of frequency. However, since only the relative changes in mechanical properties were investigated, quantification of specimen dimensions was not required, and the data are therefore reported as magnitude (the ratio of the force to the displacement) and phase (the phase difference between the force and displacement recording) as a function of frequency. Small-amplitude vibrations at frequencies ranging from 0.04 to 100 Hz were applied to the beams, and a pre-load of approximately 9 g was applied to each beam.
To determine whether freezing affected the initial modulus of tissue samples, three-point bend tests were also conducted on hoof wall beams before and after freezing on the microtome stage (cooled to approximately −10 °C ). Specimens of the same approximate dimensions as those listed above were produced, and a preload ranging from 2 to 4 g was applied to each beam. Samples were tested before and after being frozen for approximately 10 min. Mechanical properties were characterized over the same frequency range as described above. Force transducer
Micrometer Motor
Specimen Spring
Plexiglas base
[image:6.609.48.291.497.622.2]1 cm
Birefringence measurements and the determination of IF volume fraction
The volume fraction of each phase of the keratin composite was determined by converting birefringence measurements to percentage IF content. To do this, a calibration was needed that related IF volume fraction to birefringence. Tissue birefringence is easily determined; however, IF content is more difficult to ascertain. Therefore, a previously reported value of IF volume fraction for another hard α-keratin was used. Bendit (1980) determined the total matrix-phase volume fractions for various hard α-keratin tissues. His value for horse hair was chosen for the birefringence calibration, since this tissue was felt to be most closely related to the hoof wall. Although not specified by Bendit (1980), it is assumed here that tail hair was used since these specimens are large and easily accessible.
The birefringence B of dry horse tail hair was first determined using green light (λ=546 nm, where λ is wavelength) following the λ/4 plate Sénarmont method and using the relationship:
B = Γ/t , (3)
where the specimen retardation Γ (in nm) is θ×3.033 nm degree−1, where θ is the extinction angle in
degrees and t is specimen thickness (in nm). The volume fractions of horse hair α-keratin matrix (high sulphur and high glycine–tyrosine content) and IF proteins are 24 % and 76 %, respectively (Bendit, 1980). The assumption was made that all birefringence was due to IFs. Normalizing percentage IF content for mean horse hair birefringence (2.19×10⁻²±0.08×10⁻²° nm−1; mean ±1 S.E.M., N=12) provided
the calibration factor necessary to convert birefringence to IF volume fraction (IF(%)=3.48×10⁻³×birefringence). However,
since birefringence is dependent on specimen thickness, the accuracy of the microtome sectioning procedure was quantified. Using the light microscope, 16 thickness measurements were made on each of three hoof wall sections (produced from a dry hoof block using a microtome setting of 10µm). The pooled mean from the 48 measurements was 10.2±0.2µm (mean ± 1 S.E.M.).
Birefringence measurements were made on 10µm sections produced from a dry hoof block. Both cross-sectional (C-R plane) and longitudinal (R-L plane) sections were necessary to determine the birefringence of tubules and intertubular material. Three R-L plane sections were used to determine the birefringence of the inner tubules, and three sections were produced to determine the birefringence of the intertubular material from the inner, middle and outer regions. Samples were mounted in immersion oil, and 20 birefringence measurements were made from each section (i.e. 60 measurements for each of the inner tubules and the inner, middle and outer intertubular material).
Results
The effects of freezing/dehydration
Neither the freezing nor the dehydration method produced a measurable effect on the initial modulus of our hoof wall
specimens over the frequency range tested. Fig. 8A compares properties from a sample before and after complete dehydration. The shapes of all curves were very similar before and after treatment, and differences in both magnitude and phase could be attributed to mounting error. Fig. 8B shows the mechanical response of a specimen before and after removal and remounting without treatment, and it exemplifies the apparent changes in mechanical properties due simply to the remounting procedure. These artefacts were also apparent in
0 1 2 3
3 4 5 6
0 20 40 60 80 100
3 4 5 6
A
C
B
Frequency (Hz)
Storage magnitude
Hydrated Rehydrated Dry
First mount Second mount
[image:7.609.323.561.70.534.2]Before freezing After freezing
tests to determine the effects of freezing. In these tests, the differences between the curves (Fig. 8C) could be accounted for as the manifestation of mounting artefacts. These results agree with those of Landeau et al. (1983), who found no effect of repeated rehydration on the compressive mechanical behaviour of equine hoof wall, but disagree with those of Leach (1980), who found that freezing of equine hoof wall specimens at −20 °C lowered the initial longitudinal compressive modulus by 13 %. The differences are probably due to dissimilarities in methodology (his specimens were frozen for 2 days, whereas our specimens were frozen for only a few minutes; his freezing temperature was approximately 10 °C colder than that of our sample preparation and he measured compressive stiffness, not tensile stiffness).
The tensile properties of specimens of tubule dimensions
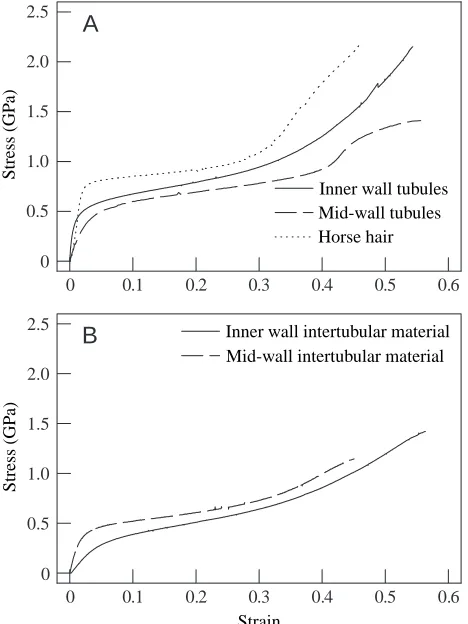
[image:8.609.50.284.375.687.2]The shapes of stress–strain curves from both hoof wall macroscale components and body hairs were similar to those obtained from mechanical tests of specimens of a much larger scale (see Kasapi and Gosline, 1996, 1997). Representative stress–strain curves for tubules and intertubular material from the inner and middle regions of the hoof are compared in Fig. 9A,B with horse body hair samples. In all tensile tests, stress–strain curves showed an initially stiff, nearly linear
region followed by a rapid decline in instantaneous modulus or a ‘yield’. After a period of relatively low resistance to extension, the sample stiffness gradually rose until failure.
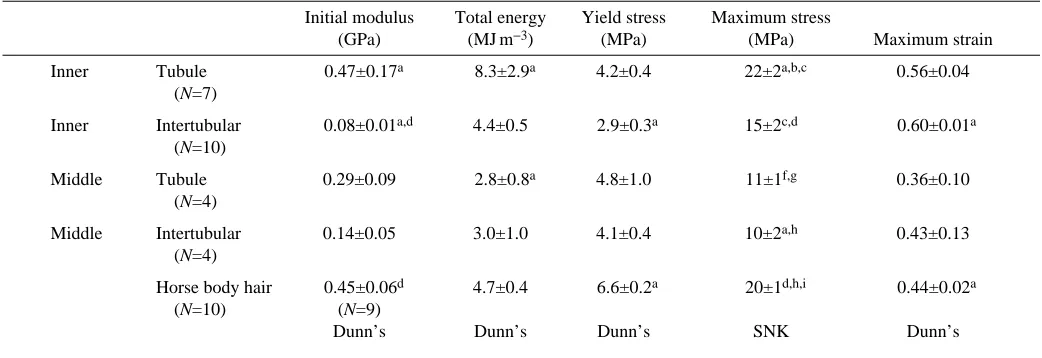
Initial longitudinal tensile stiffness or modulus Ei,Lof wall
macroscale components was dependent on region through the wall thickness and correlated locally with IF orientation. Ei,Lof
tubules from the inner third of the wall was highest (0.47 GPa; Table 1) and approximately six times higher than that of the adjacent intertubular material (0.08 GPa). The stiffnesses recorded for these tubules ranged over almost one order of magnitude, from 0.12 to 1.14 GPa; a threefold range of Ei,Lwas
recorded for the intertubular material in this region (0.04–0.12 GPa). Tubules from the mid-wall and body hairs obtained just proximal to the hoof wall, however, showed a mean initial tensile stiffness similar to that of the inner region tubules (0.29 and 0.45 GPa, respectively). Horse tail hair Ei,L
was 2.3±0.1 GPa (mean ± 1 S.E.M., N=4). As with inner wall tubules, a large range of stiffness values was recorded for mid-wall tubules, with values ranging from 0.14 to 0.57 GPa. Although Ei,Lof the intertubular material from the middle region
(0.14 GPa) was approximately half that of tubules from the same region, this difference was not statistically significant; the range in stiffness for these samples was over sixfold (0.04–0.27 GPa). Horse body hair specimens yielded at stresses (6.6 MPa) considerably higher than that of any hoof wall macroscale component, and their mean yield stress was over twice as great as that of the inner wall intertubular samples. Surprisingly, inner wall tubules yielded at a stress (4.2 MPa) that was not significantly different from that of mid-wall tubules (4.8 GPa) and was very similar to that of mid-wall intertubular samples (4.1 MPa). Yield stresses of inner (2.9 MPa) and mid-wall (4.1 MPa) intertubular materials were statistically similar.
Failure appeared to occur randomly along the specimen length and was therefore thought not to be influenced by the grips or marking of the specimen. Since the ultimate properties from specimens that failed near the grips were often higher than those that failed away from them, they were included in the data analysis. Ultimate stress was highly dependent on specimen type (ranging from 10 MPa in mid-wall intertubular specimens to 22 MPa in inner wall tubules; Table 1), whereas maximum strain was independent of specimen type (pooled mean 0.52). Total energy was not highly dependent on specimen type; however, inner wall tubules were three times tougher than mid-wall tubules (8.3 MJ m−3and 2.8 MJ m−3, respectively).
Because of the low sample sizes, statistical analyses were performed on neither hysteresis nor extension resistance data; however, large unexpected differences were observed that are worth noting. Hysteresis in tests conducted to 40 % extension was at least twice as high as that in tests conducted to 2 % extension (Table 2). In the latter tests, the lowest hysteresis value was found in inner wall intertubular samples (7.8 %) and the highest value was found in mid-wall intertubular specimens (23.8 %). Inner and mid-wall tubules had similar mean hysteresis values (16.4 % and 19.1 %, respectively). When strained to 40 % extension, the hysteresis values of inner wall tubules and intertubular samples were similar (40.0 % and
0 0.1 0.2 0.3 0.4 0.5 0.6
0 0.5 1.0 1.5 2.0 2.5
0 0.1 0.2 0.3 0.4 0.5 0.6
A
B
Stress (GP
a)
Inner wall tubules Mid-wall tubules Horse hair
0 0.5 1.0 1.5 2.0 2.5
Stress (GP
a)
Strain
Inner wall intertubular material Mid-wall intertubular material
37.6 %, respectively), as were those of the mid-wall tubules and the intertubular material (50.8 % and 49.9 %, respectively). After a 30 min recovery period, inner wall tubules showed a 2.5-fold reduction in hysteresis in tests conducted to 2 % strain. There was also a small decline in inner and mid-wall tubules tested to 40 % extension. This phenomenon was also observed in intertubular samples from the inner and mid-wall extended by 40 %, with hysteresis values dropping by 3.3 % and 4.6 %, respectively, after a 30 min recovery period. In contrast, the hysteresis of inner wall intertubular material tested to 2 % extension increased from 7.8 to 16.5 %. There were no exceptions to these trends in any of these tests. In tubule samples from the mid-wall tested to 2 % extension, a
slight increase in hysteresis was observed; however, this increase did not always occur (in one of the samples, the hysteresis was lower after 30 min). The hysteresis of intertubular samples from this region tested to 2 % extension was slightly lower after the recovery period, although this behaviour was also inconsistent (the hysteresis of one sample was higher after the 30 min recovery period). Since the dimensions of samples subjected to hysteresis tests were not determined, extension resistances (force/extension) of the initial portion of the curve were measured instead of the normalized modulus parameter E. The extension resistance, however, is analogous to E. In all tests conducted to 2 % strain, extension resistance increased after the 30 min recovery period; in tests conducted to 40 % strain, extension resistance was considerably lower after the recovery period (Table 3).
The mechanical properties of intracellular keratin from tubules and intertubular material
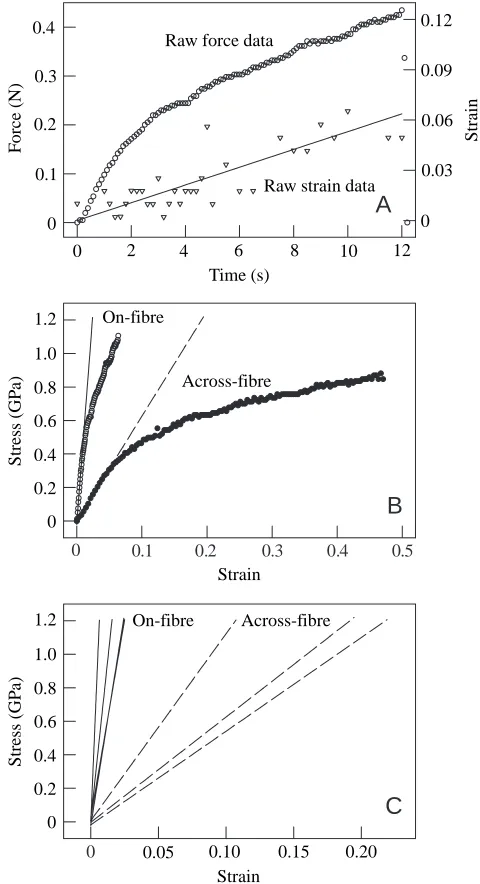
[image:9.609.47.568.97.276.2]Tests on the very thin keratin strands were extremely difficult to conduct; of the many samples sectioned, only a small fraction were successfully mounted on the test system. Of the 45 samples that were successfully mounted, data from only 20 tests could be analyzed. Specimens were rejected as a result of either premature failure or unsuitable video recordings (due to excessive movement of specimens or unsuitable strain markers). Fig. 10 shows data from mid-wall keratin strand experiments; Fig. 10A shows a sample of raw force and digitized strain data of an on-fibre tensile specimen (samples tested parallel to the IF axis) from the middle region. In Fig. 10B, the data from Fig. 10A have been converted into stress and strain, and the data have been plotted as open circles. For comparison, the results from an across-fibre specimen Table 1. Mean longitudinal mechanical properties for hoof wall macroscale components of tubule dimension and horse body
hairs obtained just proximal to the hoof wall
Initial modulus Total energy Yield stress Maximum stress
(GPa) (MJ m−3) (MPa) (MPa) Maximum strain
Inner Tubule 0.47±0.17a 8.3±2.9a 4.2±0.4 22±2a,b,c 0.56±0.04
(N=7)
Inner Intertubular 0.08±0.01a,d 4.4±0.5 2.9±0.3a 15±2c,d 0.60±0.01a (N=10)
Middle Tubule 0.29±0.09 2.8±0.8a 4.8±1.0 11±1f,g 0.36±0.10
(N=4)
Middle Intertubular 0.14±0.05 3.0±1.0 4.1±0.4 10±2a,h 0.43±0.13 (N=4)
Horse body hair 0.45±0.06d 4.7±0.4 6.6±0.2a 20±1d,h,i 0.44±0.02a
(N=10) (N=9)
Dunn’s Dunn’s Dunn’s SNK Dunn’s
Data are presented as mean ± 1 S.E.M.
Values in columns with similar letters are statistically different from one another (ANOVA; P<0.05). The statistical test used is indicated at the foot of each column.
The number of specimens used is indicated under the specimen type, unless otherwise indicated.
[image:9.609.48.298.551.714.2]Ei,Lfrom one horse body hair tensile test was omitted due to an irregular stress–strain curve at the beginning of the experiment. SNK, Student–Newman–Keuls.
Table 2. Hysteresis data for tensile loading of hoof wall
macroscale components
Hysteresis (%)
2% extension 40% extension
0 min 30 min 0 min 30 min
Inner Tubule 16.4±3.8 6.4±2.5 40.0±1.3 38.8±0.1 (N=3) (N=3) (N=3) (N=2)
Inner Intertubular 7.8±4.5 16.5±2.3 37.6±1.5 34.3±1.0 (N=2) (N=2) (N=2) (N=2)
Middle Tubule 19.1±2.4 20.1±1.3 50.8±0.6 46.6±0.6 (N=3) (N=3) (N=4) (N=4)
Middle Intertubular 23.8±2.6 21.8±2.2 49.9±0.8 45.3±0.7 (N=3) (N=3) (N=3) (N=3)
Data are presented as mean ± 1 S.E.M.
(samples tested perpendicular to the IF axis) are also plotted (filled circles). In all keratin strand specimens, the mean initial tensile modulus Eiof hoof wall keratin was much higher along
than across the fibre axis (Table 4). Although an analysis of variance (ANOVA) found a statistically significant difference between means, the pairwise multiple comparison procedure (Student–Newman–Keuls method) could not determine any differences, probably as a result of the small sample numbers. It is worth noting, however, that mean on-fibre Ei (range
0.17–0.85 GPa) was approximately 10 times higher than the across-fibre Ei(range 0.020–0.080 GPa) of tubule keratin from
the inner region, and intertubular on-fibre Ei values were 24
and 12 times higher than the across-fibre Ei values for inner
and mid-wall keratin, respectively. On-fibre Eifor inner wall
intertubular keratin ranged from 0.17 to 0.69 GPa; across-fibre
Ei for keratin from this material ranged from 0.012 to 0.039 GPa. On-fibre and across-fibre Eiwere similar between
tubules and intertubular material of the inner region. Mid-wall intertubular on- and across-fibre Ei values (ranges
0.47–1.90 GPa and 0.056–0.11 GPa, respectively), however, were approximately double those of the inner wall samples.
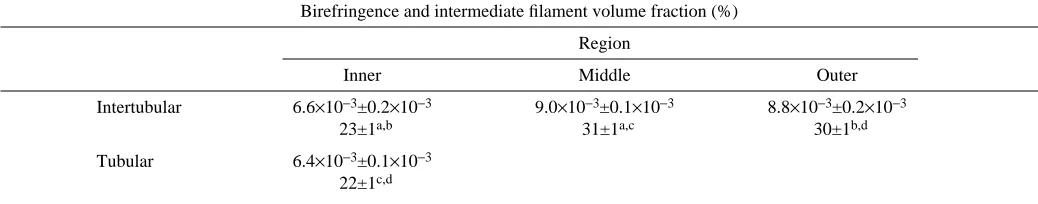
Intermediate fibre volume fraction
There was no significant difference in IF volume fraction between keratin of tubules (22 %) and the intertubular material of the inner wall (23 %; Table 5); however, the pooled volume fraction of IFs in this keratin (23 %) was significantly lower than those of the intertubular material from the middle (31 %) and outer (30 %) wall. No difference in IF volume fraction was found between middle and outer wall intertubular keratin.
Discussion
Modulation of the wall properties through modification of the properties of keratin
A gradual change in stiffness through the wall thickness of the horse hoof was reported by Leach (1980) and Kasapi and
[image:10.609.42.293.87.237.2]Gosline (1997). This progression to a stiffer material proceeding outwards appears to be necessary to provide for a more gentle transfer of loads to the collagenous suspensory elements of the dermis and arises partly as a result of the relative proximity of the tissue to a source of moisture (see Leach, 1980). This gradation of stiffness has been correlated with water content Table 3. Change in initial extension resistance after 30 min
Change in initial extension resistance after 30 min (%)
2 % extension 40 % extension
Inner Tubule 2.0±1.3 −9.4±2.5
(N=3) (N=2)
Inner Intertubular 3.0±1.8 −8.99±0.01
(N=2) (N=2)
Middle Tubule 2.6±1.6 −18.9±0.9
(N=3) (N=4)
Middle Intertubular 29±19 −20±1
(N=3) (N=3)
Note that positive values indicate an increase in extension resistance, negative values denote a decrease.
Values are presented as means ± 1 S.E.M.
0 0.1 0.2 0.3 0.4 0.5
0
A
B
C
0.4
0.3
0.2
0.1
0
F
orce (N)
Raw force data
Raw strain data
0 2 4 6 8 10 12
0.12
0.09
0.06
0.03
0
Strain
Time (s)
1.2
1.0
0.8
0.6
On-fibre
Across-fibre
0.4
0.2
0
Strain
Stress (GP
a)
On-fibre Across-fibre 1.2
1.0
0.8
0.6
0.4
0.2
0
Stress (GP
a)
0.05 0.10 0.15 0.20 Strain
[image:10.609.315.555.161.603.2](Leach, 1980; Kasapi and Gosline, 1997), and it has been suggested that the change in water content alone could account for these differences (Kasapi and Gosline, 1997); however, results from the present study offer an additional explanation.
Our findings suggest that the IF volume fraction changes through the wall thickness. IF contents in the outer and mid-wall are higher than that of the inner wall by 30 % and 35 %, respectively (see Table 5). Since IFs are believed to provide most of the stiffness in α-keratins, this reduction in IF content would explain the low Ei,Lof the inner wall relative to the middle
and outer walls found by Kasapi and Gosline (1997), even though the IFs of the inner wall are more strongly aligned along the tubule axis (the test axis) than in either the mid-wall or outer wall (Kasapi and Gosline, 1997). Within the inner region, the IF volume fractions of keratin from tubules and the intertubular material are similar, implying that IF volume fraction is locally constant. Modulation of the wall stiffness through variation in IF volume fraction may be necessary, since the IFs in the tubules and intertubular material of the mid-wall are generally aligned at a large angle to the tubule axis, and many of those in the inner wall are organized along the tubule axis (see Fig. 2; Kasapi and Gosline, 1997). If the IF volume fractions were constant across the wall, the strong axial IF orientation of the inner wall would result in a higher tensile stiffness than has been observed in this region (Kasapi and Gosline, 1997). An increase in IF volume fraction is not necessary to raise the longitudinal stiffness from the middle to the outer wall, since intertubular IF alignment is closer to the tubule axis towards the outer wall (for the formation of another crack-diversion mechanism; see Kasapi and Gosline, 1997), and this alignment alone should increase Ei,L. In this
manner, although the IF volume fractions of the middle and outer walls are similar (see Table 5), the stiffness increases towards the outer wall. Therefore, the findings from this study suggest that the mechanical properties of hoof wall material are also modulated by varying both the IF organization and volume fraction.
Variation in the mechanical properties of hard α-keratins by modification of IF volume fraction also appears to have occurred between different tissue types (Bendit and Gillespie, 1978; Bendit, 1980; also see Fraser and MacRae, 1980). Bendit (1980) found a strong correlation between matrix protein
content and transverse compressive Ei for various hard α
-keratins. His findings suggest that the modulation of hard α -keratin mechanical properties between tissues of different animals has been achieved through variation in the ratio of matrix proteins to IF proteins. Differences also exist in the protein constituents of the hoof wall. Grosenbaugh and Hood (1992) found variations in both matrix and IF protein constituents between the stratum internum and stratum medium of the equine hoof wall. It is not known, however, whether these differences exist within the stratum medium and whether this would affect the mechanical properties of the tissue.
[image:11.609.315.567.100.223.2]If modulation of IF content in the hoof wall serves to control the wall stiffness, then one must also explain why modulation of the properties of keratin is necessary to counter the effects of IF orientation in a particular region. Clearly, IF organization must serve a role other than to affect the material stiffness, or the desired stiffness would be achieved simply with the appropriate IF alignment. Kasapi and Gosline (1997) suggest that the evolution of hoof wall design may be explained in terms of fracture control. In the inner wall, where material stiffness must be relatively low for safe load transfer, a possible crack-diversion mechanism has been identified that prevents cracks from propagating inwards. The inner wall mechanism has been formed by the production of relatively large tubules (up to 385µm in diameter; M. A. Kasapi and J. M. Gosline, unpublished data) with IFs oriented primarily along the tubule axis (see Fig. 2). This Table 4. Initial nanoscale tensile modulus values of keratin
from different wall macroscale components and regions
Initial tensile modulus, Ei(GPa)
On-fibre Across-fibre
Inner Tubule 0.42±0.21 0.036±0.015
(N=3) (N=4)
Inner Intertubular 0.51±0.17 0.021±0.009
(N=3) (N=3)
Middle Intertubular 0.91±0.34 0.077±0.018
(N=4) (N=3)
Data are presented as mean ± 1 S.E.M.
Table 5. Birefringence data (upper value) and corresponding intermediate filament volume fractions (lower value) of keratin
from tubules and intertubular material
Birefringence and intermediate filament volume fraction (%)
Region
Inner Middle Outer
Intertubular 6.6×10⁻³±0.2×10⁻³ 9.0×10⁻³±0.1×10⁻³ 8.8×10⁻³±0.2×10⁻³
23±1a,b 31±1a,c 30±1b,d
Tubular 6.4×10⁻³±0.1×10⁻³ 22±1c,d
Data are presented as mean ± 1 S.E.M.
[image:11.609.48.567.598.700.2]particular morphology redirects cracks initiated inwards to a path along the tubule axis, since mechanical tests show that cracks apparently find propagation across the IF axis more difficult than along the IF axis (Kasapi and Gosline, 1996, 1997).
In addition to associating with most of the cellular water (see Fueghelman, 1994), matrix proteins appear to have a much lower tensile stiffness than IF proteins (Feughelman, 1959). Owing to the small sample sizes of these tests, however, it was not possible to provide statistical confirmation of the effects of IF volume fraction on the mechanical properties. The results shown in Fig. 10B,C suggest large differences in mechanical properties between IF and matrix proteins. The results from this study therefore agree with those of Feughelman (1959).
Estimates of the tensile stiffnesses of the matrix and IF proteins may be obtained using the results from the present study. If the transverse (across-fibre) modulus is assumed to be approximately equal to the matrix stiffness, then Eiof the fully
hydrated matrix protein is approximately 0.03 GPa (the average of the two inner wall across-fibre values; see Table 4). This value is similar to that obtained for the matrix compressive Ei
from fully hydrated horse hair specimens (0.06–0.13 GPa; Bendit, 1980). By rearranging equation 1 and approximating the volume fractions of the phases at full hydration, we may estimate
Ei,Lfor the IF proteins. The water contents of fully hydrated inner and mid-wall specimens are approximately 48 % and 41 %, respectively (Kasapi and Gosline, 1997). Using a mean dry hoof wall (ignoring the medullary cavity) density of 1200 kg m−3(M.
A. Kasapi and J. M. Gosline, unpublished data), these values equal 37 % and 33 % water volume fraction for inner and mid-wall, respectively. If we assume that the water associates exclusively with the matrix proteins, then the inner and mid-wall fully hydrated matrix volume fractions are 85 % and 79 %, respectively. Assuming that the mechanical properties of matrix proteins are isotropic, and assigning Vm=0.85 for the inner wall,
we find that inner wall Efis approximately 3 GPa, approximately
100 times higher than that of the wet matrix Ei. Using Em=0.03
for the wall (the inner wall estimate is better than the mid-wall across-fibre value, since the inner mid-wall wet matrix volume fraction is higher), an estimate of Ef=4 GPa for the mid-wall is
obtained. These estimates agree reasonably well with a previous estimate of Ef(4.6 GPa) obtained by Feughelman (1959).
The differences in IF volume fraction do not correlate well with the gradation in water content. Kasapi and Gosline (1997) estimated inner, middle and outer wall water contents (at 100 % relative humidity) to be 48, 41 and 35 %, respectively. The inner wall is expected to be more hydrated than the middle and outer wall at the same relative humidity; however, according to IF volume fraction, middle and outer wall samples should have the same water content. This discrepancy may be due, at least in part, to differences in tubule morphology. Using data from Kasapi and Gosline (1997), the medullary cavities of mid- and outer wall tubules occupy 1.5 % and 4.5 % of the hoof wall area, respectively. There is, therefore, correspondingly less stratum medium material in the outer wall to absorb water, hence the lower water content. Possible differences in protein type and content could also contribute to the discrepancy.
Mechanical properties of the macroscale components of the hoof wall
Hysteresis represents the energy loss of a system during loading. The hysteresis even at a low extension (2 %), which is thought to be within the linear range of this material, suggests that viscoelastic behaviour is a significant factor in the mechanical properties of this material even at low strains (see Table 2). It further suggests that pre-straining of this material in mechanical tests is not recommended since the material properties will change even with low pre-strains. It should also be noted that in situ hysteresis is expected to be higher for all tests, since specimens were tested at hydration levels beyond their normal states, and the viscous energy loss of polymeric systems decreases as water content increases.
The increase in extension resistance after the initial cycle suggests that some molecular reordering has occurred along the test axis and that full reversion has not occurred even after 30 min (see Table 3); re-zeroing of the crosshead was necessary, even after the recovery period, to take up the slack that resulted after the first cycle. It is not possible to determine whether the increase in resistance is due to IF or matrix proteins movement; however, the results in Table 2 suggest that matrix proteins are not the primary source of the energy loss. In most tests, the lowest hysteresis value is observed in inner wall intertubular samples which have IFs aligned primarily perpendicular to the test axis. If matrix proteins were the primary viscoelastic components of α-keratin, then inner wall intertubular specimens should display the highest loss, since the IFs of these samples will generally bear load perpendicular to, not along, their primary axis and would probably, therefore, not contribute significantly to the process. Instead, higher hysteresis values are observed in samples where the loading direction is along the IF axis, suggesting that IFs are viscoelastic. In the mid-wall, intertubular and tubular hysteresis values are very similar because of the general similarities in IF orientation relative to the tubule axis.
With a large extension (40 %), samples showed high mean energy losses ranging from 38 to 51 %. The hysteresis value was slightly lower after the recovery period, suggesting some molecular reordering of the composite. However, in these tests, the extension resistance was generally lower in the second cycle, suggesting a number of possibilities. Some reordering may have occurred, resulting in a loss of molecular alignment along the test axis. Sliding of molecules appears to have occurred, causing specimens to remain in an extended state; consequently, they became narrower. Since specimen dimensions were not corrected after the first cycle, extension resistances would be underestimates of the true material properties. Molecular disruption may also have occurred at this extension, resulting in inferior mechanical properties after the first cycle. Birefringence measurements on wool tested to a strain of 60 % suggest that specimens will revert to their original conformation when provided with a sufficient recovery period (Gupta and Rao, 1991).
IF alignment is parallel and perpendicular to the test axis, respectively, hysteresis values are similar and considerably lower than those of the mid-wall, where IFs are generally at intermediate angles. This result is also unexpected on the basis of the differences in IF volume fraction. Clearly, some other variable component of the α-keratin composite is responsible for this observation, and further testing is necessary to understand this behaviour.
It has recently been suggested that tubules are hollow simply as a result of a manufacturing constraint and that the incorporation of solid fibres would be mechanically advantageous (Kasapi and Gosline, 1997). If this is true, then this compromise may be reflected in a difference in mechanical properties between tubules and hair. Apart from possibly offering resistance to cooperative buckling, no other justification for the incorporation of hollow fibres into a composite has been provided, since they offer only minor improvements in bending stiffness and in decreased thermal conductivity, and their hollow form does not serve to facilitate hydration of distal portions of the wall to maintain optimal fracture properties (Kasapi and Gosline, 1998). Interestingly, the mechanical properties of horse body hairs obtained from the area just proximal to the coronary band are similar to those of the inner wall tubules. Although this finding shows that the tensile properties have not been compromised in the formation of hollow tubules, tubules do not appear to confer any advantage to the tensile properties of the wall over that which would be conferred by the incorporation of horse hairs. They would still, however, act as localized stress raisers and may therefore reduce the relative fracture toughness. The similarity in Eibetween inner equine hoof wall tubules
and body hair is not in conflict with the difference in IF volume fraction (23 % and 76 %, respectively). Ei,Lof fully hydrated
horse tail hairs (2.3 GPa) is 4.8 times higher than that of inner wall tubules and horse body hair (0.47 and 0.45 GPa, respectively). This suggests that the IF content of equine body hair is much lower than that of tail hair and similar to that of inner wall tubules. The 3.3-fold higher IF content of tail hair explains most of the observed differences in Ei,L, and suggests
that this is, indeed, the hair type examined by Bendit (1980). The results of Kasapi and Gosline (1997) suggested that, although the mechanical functions of tubules depend on their position through the wall, all tubules provide some degree of mechanical reinforcement along their longitudinal axes. The tubules of the inner wall appeared to provide the highest degree of reinforcement along the primary axis, probably as a result of the high degree of IF organization along the axis. The results of the present study show that these tubules, which occupy up to 50 % of the stratum medium material in the inner wall (Kasapi and Gosline, 1997), are the high (longitudinal) stiffness elements of this region. In this sense, this region of the wall functions as a macroscale composite; however, it must be noted that the intertubular material may not be considered to be a ‘matrix’, since it is formed from highly ordered IFs and is therefore probably not isotropic.
Inner wall tubules are capable of withstanding a 1.4-fold higher stress before yielding (Table 1) and a 1.9-fold higher stress
before failure than the adjacent intertubular material. These findings suggest that the high degree of IF alignment along the tubule axis offers relatively high resistance to deformation and delays any permanent or temporary molecular reordering such as a partial transition from α-helices to β-sheets (see Bendit, 1960), relative to the intertubular material. It should be noted here that perfect isolation of wall macroscale components was not possible, and tubule specimens therefore contained a portion of the intertubular material (Fig. 4) and occasionally vice versa. If the true ultimate (failure) properties of one component are higher than those of the other, then the ultimate properties will be compromised by the weaker component. Since perfect isolation of a desired wall macroscale component was virtually impossible, this may explain the similarity in this parameter between tubules and the intertubular material from both regions (see Table 1), and this would result in an underestimation of the ultimate properties of the stronger, tougher component.
In the mid-wall, all material properties determined here are statistically similar between the tubules and intertubular material. On the basis of the Ei,Lvalues obtained here and a
whole-tubule volume fraction of 29 % (M. A. Kasapi and J. M. Gosline, unpublished data), the mean Ei,Lfor fully hydrated
mid-wall should be 0.18 GPa. This is considerably lower than the mean mid-wall Ei,Lof 0.43 GPa determined by Kasapi and
Gosline (1997). If, however, the highest recorded values for the tubules (0.57 GPa) and intertubular material (0.27 GPa) are considered, the resulting mean mid-wall Ei,L(0.36 GPa) would
be much closer to that recorded previously. This suggests that the mean mid-wall Ei,Ldata presented here are underestimates
of the actual Ei,L, and that the highest recorded values are
probably closer to the true Ei,L of these macroscale wall
components. On the basis of this and the similarities of all other parameters between mid-wall tubules and intertubular material (see Table 1), mid-wall tubules would not act to reinforce the longitudinal stiffness to a great extent. This explains why only minor crack deviation occurs as a propagating crack encounters tubules in this region (Kasapi and Gosline, 1996, 1997).
The Ei,Lvalues presented here for inner wall tubules agree
with the on-fibre tensile modulus of keratin from inner wall tubules (compare Tables 1 and 4). This result suggests that the methodologies for these tests are reliable and confirms that most of the inner wall tubular IF alignment is along the tubule axis. However, the true material Ei,L of these tubules is
approximately 10–13 % higher than the values presented here since the cross-sectional areas included the medullary space, which does not support load. Areas were not corrected thereby permitting direct comparisons with previous tensile tests. Since tubule samples contained some intertubular material (see Fig. 4), our value of Ei for these structures is again an
underestimate; the highest values (approximately 1 GPa) are probably more representative of the true Eiof these structures.
Using equation 1, a mean whole inner-wall Ei of 0.30 GPa
(Kasapi and Gosline, 1997) and an intertubular Eiof 0.08 GPa,
stiffness is probably responsible for this discrepancy since, on the basis of the data presented here, the mean tubule stiffness should be 1 GPa. This suggests that the mean on-fibre Ei for
keratin from this region is also an underestimate and that the highest value (0.85 GPa) is probably closer to the true on-fibre
Ei for this keratin. This discrepancy could result from the necessary assumption of one of the keratin strand dimensions (recall that only one dimension could be verified visually).
Future directions: other levels of the functional hierarchy
Two levels of equine hoof wall morphological hierarchy have been studied here, the nanoscale (α-keratin phases) and the macroscale (tubules and intertubular components). There remains, however, the possibility of another intermediate scale. The extracellular glycoprotein adhesive (Matoltsy, 1975) and cornified cell envelope that line the inside of these cells (Steven and Steinert, 1994) may form an additional level of functional hierarchy. Although the intercellular space and the cell envelope are only approximately 30 and 15 nm thick, respectively, extensive plasma membrane interdigitation may increase the effective thickness of this cell interface complex to approximately 750 nm. Unfortunately, little is known about the mechanical properties of this complex, except that it appears to conform to strains elastically (Fraser and MacRae, 1980; present study). If we hypothesize that the intracellular blocks of α-keratin (i.e. the nanoscale composite) act as short fibres surrounded and connected by a ‘matrix’ formed by cell interface complexes, forming a microscale composite (see Fig. 11), then we may make inferences about the mechanical behaviour of the cell interface complex. If the stiffness of the matrix for this short-fibre composite is significantly less than the stiffness of the fibre, then the stiffness of the bulk material in the on-fibre direction (inner wall whole tubules) should be less than the on-fibre stiffness of the α-keratin within
individual cells (see Fig. 11A). The agreement in stiffness between inner wall on-fibre specimens (Ei,L=0.42 and
0.51 GPa; Table 4) and whole tubules (Ei,L=0.47 GPa; Table 1)
suggests that the stiffness of the complex is near the stiffness of the combined matrix and fibrous phases tested on-fibre. As a first approximation, we estimate that the stiffness of the complex is 0.5 GPa.
If the stiffness of the interface complex is indeed similar to the on-fibre stiffness of α-keratin, it could account for the apparent difference in inner wall across-fibre intertubular stiffness (Ei is approximately 0.02 GPa; Table 4) and the
stiffness of the macroscale intertubular material (0.08 GPa; Table 1). For tests in this direction (see Fig. 11B), the cell interface complex forms the higher-stiffness element that reinforces the ‘composite’, raising its modulus above that of the α-keratin measured across-fibre. Small sample sizes prevented statistical confirmation of this apparent difference in stiffness. The contribution of the interface complex could also explain the greater than twofold difference between our Ei
value for fully hydrated matrix protein and that found by Bendit (1980) for fully hydrated horse hair. It would be expected that our value (0.03 GPa) would be lower than Bendit’s (1980) estimates (0.06–0.13 GPa), since his experiments were conducted on specimens that included the cell interface complex. Further testing, however, is necessary to verify our inferences about the mechanical properties of the hypothesized microscale composite.
The formation of hoof wall tissue through the adhesion of hardened cells forms an additional level of the morphological hierarchy, but it remains to be demonstrated whether the microscale composite is merely a reflection of a manufacturing limitation or whether any functional properties of the hoof wall arise from it. Preliminary examination of fracture surfaces indicate that cracks propagate through cells (along the IF axis)
A
B
Cell interface complex
Intermediate filament Matrix
[image:14.609.243.562.69.309.2]750 nm Fig. 11. Diagram of the hypothesized microscale
and also along cell interfaces (M. A. Kasapi and J. M. Gosline, unpublished data). This suggests that the cell interface complex may play a role in the deviation of cracks away from their initial route to a path following cell interfaces, and this may constitute a fracture toughening mechanism whereby energy is consumed through increasing the crack path complexity. If this is true, the hoof wall would contain at least three levels of functional hierarchy, suggesting that the microscale composite is not merely a reflection of a manufacturing limitation. This hypothesis of a functional role for the cell interface complex, however, requires further investigation.
The results presented here suggest that the mechanical properties of the equine hoof wall are modulated by varying both the IF orientation and the IF volume fraction, in addition to varying the water content (Leach, 1980; Kasapi and Gosline, 1997). IF volume fraction variability is necessary to uncouple IF orientation and Ei through the wall thickness, while still
maintaining the IF orientation effect at a local scale. This allows for the presence of possible crack-diversion mechanisms formed from specific IF alignments which would otherwise alter the wall stiffness gradient that is necessary for the proper transfer of loads to the bony skeleton. Our findings also suggest the presence of an additional scale of functional hierarchy at the cellular level, the interfacial complex. Hysteresis data from this study are contrary to expectations based on current dogma and suggest that further research should be conducted to elucidate the cause of this enigmatic behaviour.
References
ASTM Standard E8M-94a (1994). Standard test methods for tension
testing of metallic materials (metric). Annual Book of ASTM Standards 03.01.
Bendit, E. G. (1960). A quantitative X-ray diffraction study of the
alpha–beta transformation in wool keratin. Textile Res. J. 30, 547–555.
Bendit, E. G. (1980). The location and function of the
high-glycine-tyrosine proteins in keratins. In Fibrous Proteins: Scientific, Industrial and Medical Aspects, vol. 2 (ed. D. A. D. Parry and L. K. Creamer), pp. 185–194. New York: Academic Press.
Bendit, E. G. and Gillespie, J. M. (1978). The probable role and
location of high-glycine-tyrosine proteins in the structure of keratins. Biopolymers 17, 2743–2745.
Bertram, J. E. A. and Gosline, J. M. (1986). Fracture toughness
design in horse hoof keratin. J. Exp. Biol. 125, 29–47.
Bertram, J. E. A. and Gosline, J. M. (1987). Functional design of
horse hoof keratin: the modulation of mechanical properties through hydration effects. J. Exp. Biol. 130, 121–136.
Cook, J. and Gordon, J. E. (1964). A mechanism for the control of
cracks in brittle systems. Proc. R. Soc. Ser. A 282, 508–520.
Feughelman, M. (1959). A two phase structure for keratin fibres.
Textile Res. J. 29, 223–228.
Feughelman, M. (1994). A model for the mechanical properties of
the α-keratin cortex. Textile Res. J. 64, 236–239.
Fraser, R. D. B. and MacRae, T. P. (1980). Molecular structure and
mechanical properties of keratins. In The Mechanical Properties of Biological Materials (ed. J. F. V. Vincent and J. D. Currey). Cambridge: Cambridge University Press. Symp. Soc. Exp. Biol. 34, 211–246.
Fraser, R. D. B. and Parry, D. A. D. (1993). Keratin intermediate
filament structure. J. Mol. Biol. 230, 436–452.
Grosenbaugh, D. A. and Hood, D. M. (1992). Keratin and associated
proteins of the equine hoof wall. Am. J. Vet. Res. 10, 1859–1863.
Gupta, V. B. and Rao, D. R. (1991). Birefringence of wool. Textile
Res. J. 61, 510–516.
Harris, B. (1980). The mechanical behaviour of composite materials.
In The Mechanical Properties of Biological Materials (ed. J. F. V. Vincent and J. D. Currey). Cambridge: Cambridge: University Press. Symp. Soc. Exp. Biol. 34, 37–74.
Kasapi, M. A. and Gosline, J. M. (1996). Strain-rate-dependent
mechanical properties of the equine hoof wall. J. Exp. Biol. 199, 1133–1146.
Kasapi, M. A. and Gosline, J. M. (1997). Design complexity and
fracture control in the equine hoof wall. J. Exp. Biol. 200, 1639–1659.
Kasapi, M. A. and Gosline, J. M. (1998). Exploring the possible
functions of equine hoof wall tubules. Equine vet. J. Suppl. 26, 10–14.
Katz, S. L. and Gosline, J. M. (1992). Ontogenetic scaling and
mechanical behavior of the tibiae of the African desert locust (Schistocerca gregaria). J. Exp. Biol. 168, 125–150.
Landeau, L. J., Barrett, D. J. and Batterman, S. C. (1983).
Mechanical properties of equine hooves. Am. J. Vet. Res. 44, 100–102.
Leach, D. H. (1980). Structure and function of the equine hoof wall.
PhD thesis, Department of Vetinary Anatomy, University of Saskatchewan.
Matoltsy, A. G. (1975). Desmosomes, filaments and keratohyalin
granules: their role in the stabilization and keratinization of the epidermis. J. Invest. Dermatol. 65, 127–142.
Nickel, R. (1938). Über den Bau der Jufröhrchen und seine
Bedeutung für den Mechanismus des Pferdehufes. Morph. Jb. 82, 119–160.
Parry, D. A. D. (1995). Hard α-keratin IF: a structural model lacking a head-to-tail molecular overlap but having hybrid features characteristic of both epidermal keratin and vimentin IF. Proteins
22, 267–272.
Parry, D. A. D., Fraser, R. D. B., MacRae, T. P. and Suzuki, E.
(1987). Intermediate filaments. In Fibrous Protein Structure. Toronto: Academic Press.
Ryder, M. L. (1962). Structure of rhinoceros horn. Nature 193,
1199–1201.
Steinert, P. M. (1991). Organization of coiled-coil molecules in
native mouse keratin 1/keratin 10 intermediate filaments: evidence for alternating rows of antiparallel in-register and antiparallel staggered molecules. J. Struct. Biol. 107, 157–174.
Steinert, P. M., Marekov, L. N., Fraser, R. D. B. and Parry, D. A. D. (1993a). Keratin intermediate filament structure. J. Mol. Biol. 230, 436–452.
Steinert, P. M., Marekov, L. N. and Parry, D. A. D. (1993b).
Diversity of intermediate filament structure. J. Biol. Chem. 268, 24916–24925.
Steinert, P. M., North, A. C. T. and Parry, D. A. D. (1994).
Structural features of keratin intermediate filaments. J. Invest. Dermatol. 103, 19S–24S.
Steven, A. C. and Steinert, P. M. (1994). Protein composition of
cornified cell envelopes of epidermal keratinocytes. J. Cell Sci. 107, 693–700.
Wilkens, H. (1964). Zur makroskopischen und mickroskopischen