The ability to achieve elevated, relatively stable thorax temperatures (Tth) during flight is an important trait allowing honeybees (Apis mellifera) and other endothermic insects to maintain the flight muscle temperatures necessary for maximal force production and to remain active across a wide range of air temperatures (Ta values). The mechanisms by which Tth stability is maintained during flight in honeybees and other insects remain controversial. Recent reviews of honeybee flight thermoregulation by Heinrich (1993) and Heinrich and Esch (1994) have concluded (a) that flying honeybees thermoregulate primarily by varying evaporative heat loss and (b) that heat production by the flight muscles is determined solely by fixed aerodynamic demands and thus is not subject to variation for thermoregulatory purposes. However, Harrison et al. (1996a) have provided data indicating that variation in metabolic heat production is the dominant mechanism of thermal stability between Tavalues of 21 and 38 °C. These data
have been criticized on a number of grounds, in particular the possibility that the honeybees used in the study of Harrison et al. (1996a) were not in steady-state flight (Heinrich and Esch, 1997; Stevenson and Woods, 1997).
To identify conclusively the mechanisms by which flying honeybees maintain thermal stability during flight, it is necessary to quantify all routes of heat exchange (metabolic heat production, evaporation, radiation and convection) during physiologically steady-state conditions and to prepare a complete heat budget. No previous studies of insects flying in respirometry chambers have measured thermal stability as a function of flight duration, which is necessary to demonstrate physiologically steady-state conditions. Furthermore, published heat budget models of flying honeybees have assumed that metabolic heat production (Cooper et al., 1985; Coelho, 1991a) and evaporation (Coelho, 1991a) are independent of Ta. In the light of the studies showing that Printed in Great Britain © The Company of Biologists Limited 1999
JEB1686
Thermoregulation of the thorax allows honeybees (Apis mellifera) to maintain the flight muscle temperatures necessary to meet the power requirements for flight and to remain active outside the hive across a wide range of air temperatures (Ta). To determine the heat-exchange pathways through which flying honeybees achieve thermal stability, we measured body temperatures and rates of carbon dioxide production and water vapor loss between Ta values of 21 and 45 °C for honeybees flying in a respirometry chamber. Body temperatures were not significantly affected by continuous flight duration in the respirometer, indicating that flying bees were at thermal equilibrium. Thorax temperatures (Tth) during flight were relatively stable, with a slope of Tthon Taof 0.39. Metabolic heat production, calculated from rates of carbon dioxide production, decreased linearly by 43 % as Tarose from 21 to 45 °C. Evaporative heat loss increased nonlinearly by over sevenfold, with evaporation rising rapidly at Tavalues above 33 °C. At Tavalues above 43 °C, head temperature dropped below Taby approximately 1–2 °C, indicating that substantial evaporation from the head was occurring at
very high Tavalues. The water flux of flying honeybees was positive at Tavalues below 31 °C, but increasingly negative at higher Ta values. At all Ta values, flying honeybees experienced a net radiative heat loss. Since the honeybees were in thermal equilibrium, convective heat loss was calculated as the amount of heat necessary to balance metabolic heat gain against evaporative and radiative heat loss. Convective heat loss decreased strongly as Ta rose because of the decrease in the elevation of body temperature above Ta rather than the variation in the convection coefficient. In conclusion, variation in metabolic heat production is the dominant mechanism of maintaining thermal stability during flight between Tavalues of 21 and 33 °C, but variations in metabolic heat production and evaporative heat loss are equally important to the prevention of overheating during flight at Ta values between 33 and 45 °C.
Key words: thermoregulation, flight energetics, water loss, heat budget, honeybee, Apis mellifera.
Summary
Introduction
MECHANISMS OF THERMAL STABILITY DURING FLIGHT IN THE HONEYBEE
APIS MELLIFERA
STEPHEN P. ROBERTS* ANDJON F. HARRISON
Department of Biology, Arizona State University, Tempe, AZ 85287-1501, USA
*Present address: Department of Organismal Biology and Anatomy, The University of Chicago, 1027 East 57th Street, Chicago, IL 60637, USA (e-mail: sroberts@midway.uchicago.edu)
metabolic rate during flight (Harrison et al., 1996a,b) and evaporation (Louw and Hadley, 1985) can vary greatly according to thermal conditions, the heat budget models of Cooper et al. (1985) and Coelho (1991a) are insufficient for drawing conclusions about the relative contributions of heat-exchange pathways in flying honeybees. In the present study, we measured the effect of Taon water vapor loss, metabolic rate and body segment temperatures of honeybees flying steadily and in thermal equilibrium. We then employed a heat budget analysis to identify the routes of heat exchange through which thermal stability was maintained. Since rates of flight metabolism can vary significantly among honeybee races (Harrison and Hall, 1993) and even among adjacent colonies (Harrison et al., 1996b), we compared the mechanisms of thermal stability among bees from three colonies.
Materials and methods
Animal capture and handling protocols
For measurements of gas exchange and body segment temperatures during flight, individual departing honeybee (Apis mellifera) foragers were captured from three colonies maintained within the Life Sciences courtyard located on the campus of Arizona State University. Within 1 min of capture, the bee was placed in a 550 ml glass chamber with rounded internal surfaces that was housed in a temperature-controlled cabinet. Bees typically engaged in hovering or slow forward flight without provocation in the glass metabolic chamber, but if they ceased flying and dropped to the bottom of the chamber, they were stimulated to resume flight by gently shaking the chamber with metal tongs. A microphone cemented through the lid of the chamber and connected to an audio tape player was used to record flight activity in the chamber. Analyses were performed only for bees that exhibited continuous or near-continuous (>95 % of the respirometry trial) flight, as determined by visual observation and analyses of computer-digitized (SoundEdit program for Macintosh, Farallon Computing Inc., Emeryville, CA, USA) audio recordings of flight activity. Following each respirometry trial, the bee was immediately weighed to the nearest 0.0001 g on a Mettler AE240 analytical balance.
Body temperatures during flight; effects of Taand flight
duration
To determine whether bees flying in the chamber were at thermal equilibrium, temperatures of the tagmata were measured after 1, 2, 4 and 6 min of continuous flight at 21 and 33 °C, and after 1, 2 and 6 min of flight at 42 °C. Because bees were in thermal equilibrium between 1 and 6 min of flight (see below), we determined the effect of Taon body temperatures of bees flying for 4 min at Ta values ranging from 20 to 45 °C (N=106). At the end of the flight period, the bee (while still in the temperature-controlled cabinet) was shaken from the chamber into a small plastic bag and quickly restrained by gently flattening the bag on a piece of low-density foam. Within 10 s, thoracic, head and abdominal temperatures (Tth, Th and
Tab, respectively) were measured using a Physitemp MT 29/1B microprobe thermocouple (diameter 0.33 mm, time constant 0.025 s) connected to a Physitemp BAT-12 thermometer.
We used the measurements of Tth, Thand Tabduring flight in the chamber to test whether honeybees were increasing heat transfer from the thorax to the head or abdomen at high Ta values. Variation in heat transfer between the thorax and head or abdomen was analyzed according to a model detailed by Baird (1986), May (1991, 1995a) and Stavenga et al. (1993). Variation in the heat transfer between the thorax and head or abdomen was inferred from the ratio of the head or abdominal temperature excess (Th−Ta or Tab−Ta, respectively) to the thoracic temperature excess (Tth−Ta). If the assumptions of the model are met (see Stavenga et al., 1993) and heat transfer from the thorax to the head does not vary with Ta, then the head temperature excess ratio (Rh), where
Rh = (Th−Ta)/(Tth−Ta) , (1) should be independent of Ta. Similarly, if the assumptions of the model are met and heat transfer from the thorax to the abdomen does not vary with Ta, then the abdominal temperature excess ratio (Rab), where
Rab = (Tab−Ta)/(Tth−Ta) , (2) should be independent of Ta. However, if heat transfer from the thorax to the head or abdomen is increased at high Ta, as would be expected if the head or abdomen were being used to dissipate excess heat generated in the thorax, then Rhor Rab should increase with Ta. Conversely, if heat transfer from the thorax to the head or abdomen is increased at low Ta values (as would be expected if Thor Tabwere being regulated at a value above Ta), then Rhor Rabshould decrease with Ta.
Flight metabolism and evaporative heat loss
Using closed-system respirometry, metabolic and evaporative water loss rates were determined at one value of Ta for each flying A. mellifera worker. To achieve low background concentrations of carbon dioxide and water vapor, the flight chamber was always kept in a 100 l rectangular glove box which was continuously perfused with dry, CO2-free air at 30 l min−1by means of a Balston (Haverhill, MA, USA) 75-52 FT-IR purge gas generator and a large Drierite/Ascarite scrubbing column. If the flight chamber was not kept in the perfused glove box, background water vapor levels were much higher, probably due to adsorption of atmospheric water onto the rubber stopper, leading to a poor signal-to-noise ratio for the evaporative water loss measurements. Ta was regulated using a Precision Scientific (model 815) low-temperature incubator (±0.2 °C). After the bee had been placed in the flight chamber, the chamber was flushed with dry, CO2-free air for 1 min at 30 l min−1and sealed. After 6 min of flight, a 50 ml gas sample was taken from the chamber using a 50 ml glass gas-tight syringe (Scientific Glass Engineering, Ringwood, Australia). Using a Sage Instruments (Boston, MA, USA; model 351) syringe pump, the gas sample was injected at 15 ml min−1 into a dry, CO
sequentially over a Thunder Scientific (Albuquerque, NM, USA) PC-2101 electronic humidity sensor, a magnesium perchlorate water-scrubbing column and a Licor (Lincoln, NE; model 6252) carbon dioxide analyzer. The airstream directed over the CO2 analyzer and the water sensor was controlled (±0.1 ml min−1) by a Tylan (San Diego, CA, USA) mass flow controller that had been calibrated with a soapfilm flowmeter.
The carbon dioxide analyzer, accurate to ±1 p.p.m. in the range 0–3000 p.p.m., was calibrated by injections of certified span gases and CO2-free air. The outputs of the carbon dioxide analyzer and the water sensor were digitized and monitored on-line using a Sable Systems (Las Vegas, NV, USA) data-acquisition system and a computer. The water sensor was calibrated with air samples of known vapor densities, which were obtained by flowing saturated air at 80 ml min−1through a large water-jacketed, temperature-controlled glass condensing column. The temperature of the 4:1 ethylene glycol:water mixture pumped through the condensing column jacket was varied by means of a temperature-controlled circulating water bath. The vapor density of excurrent air from the condensing column was determined from the temperature inside the column (range −22 to 0 °C) and the known relationship between saturation vapor pressure and Ta (Lide, 1991). The water sensor was accurate to ±5×10⁻³mg H2O l−1 in the range 0–5 mg H2O l−1. The standard curve relating voltage to water vapor density was nonlinear; a second-order polynomial regression provided an r2value of 0.993.
Initial fractional concentrations of carbon dioxide (FICO∑) and water vapor density (VIH∑O, mg l−1) in the chamber were determined from trials in which gas samples were taken from the chamber (containing a bee) immediately after flushing. There were no detectable changes in either carbon dioxide or water vapor concentration over 6 min for a flushed, empty chamber exposed to ambient air, indicating that there were no significant leaks. For carbon dioxide and water vapor, signal-to-background ratios were greater than 35:1 and 15:1, respectively. Chamber Ta was monitored continuously throughout each trial using a thermocouple inserted through the lid and connected to a Physitemp BAT-12 thermometer.
Body mass-specific rate of water vapor loss (V.H∑O; mg H2O g−1h−1) was calculated as:
V.H∑O= L(VEH∑O−VIH∑O)(Mb)−1(t)−1, (3) where L is the volume of the respirometry chamber (l), Mbis body mass (mg), t is time (h) and VEH∑O is the water vapor density at the end of the trial. Values for V.H∑Owere multiplied by the latent heat of evaporation, 2.45 J mg−1H
2O, to obtain body mass-specific rates of evaporative heat loss (reported as mW g−1).
Body mass-specific rate of carbon dioxide production (V.CO∑; ml CO2g−1h−1) was calculated as:
V.CO∑ = L×1000 ×(FECO∑−FICO∑)(Mb)−1(t)−1, (4) where FECO∑is the fractional concentration of carbon dioxide at the end of the trial. To obtain rates of metabolic heat
production (reported as mW g−1), V.
CO∑was multiplied by the energy yield per amount of CO2 formed, 21.4 J ml−1CO2, assuming simple carbohydrate catabolism (Beenakkers et al., 1984; Bertsch, 1984; Rothe and Nachtigall, 1989), and the fraction of power input liberated as heat during flight. The fraction of power input liberated as heat during flight was estimated to be 0.96 on the basis of body mass-specific rates of metabolism (638 mW g−1; Harrison et al., 1996a) and mechanical power output (27 mW g−1; Ellington, 1984) of honeybees hovering at a Taof 21 °C.
Water flux (F.H∑O; mg H2O g−1h−1) during flight was calculated using the following equation:
F.H∑O= 0.813V .
CO∑−V .
H∑O, (5)
where the multiplier of V.CO∑, 0.813 mg H2O ml−1CO2, is the stoichiometric relationship for the amount of metabolic water formed per amount of carbon dioxide produced during the oxidation of hexose sugars (Withers, 1992), the fuel utilized by honeybees during flight (Gmeinbauer and Crailsheim, 1993; Suarez et al., 1996).
Body surface area
Body surface areas for eight honeybee workers were estimated from geometrical equations. Calipers accurate to 0.01 mm were used to measure the dimensions of the tagmata. The head was assumed to be an isosceles triangular prism. The thorax (minus the legs and wings) was assumed to be a sphere. The portion of the abdomen consisting of tergi 1–3 was assumed to be a cylinder, while the portion of the abdomen consisting of tergi 4–5 was assumed to be a cone. The surface area of the legs, when forcibly flattened between two slide mounts, was determined by computer-aided planimetry using NIH Image software for Macintosh.
Cuticular permeability
The effect of temperature on honeybee cuticular water permeability was determined gravimetrically using dead bees. Freshly caught honeybees were killed by freezing at −5 °C for 1 h and then sealed at the mouth and anus using paraffin wax. They were then weighed to the nearest 0.0001 g and placed in a stream of dry air (2 l min−1) in a temperature-controlled chamber (±0.2 °C). After a 1 h pretreatment period to remove any absorbed water from the cuticle, the honeybees were reweighed and returned to the chamber. Three hours later, the bees were weighed again. Cuticular permeability (µg H2O cm−2h−1mmHg−1; 1 mmHg=133.3 Pa) was determined at 30, 35 and 42 °C (N=8 for each treatment).
Heat budget calculations
Since honeybees flying in the chamber were in thermal equilibrium at Tavalues between 21 and 45 °C (Table 1; Fig. 1), their heat budgets during hovering flight at Tavalues of 21, 33 and 45 °C were calculated using the following equation:
M + E + R + C = 0 , (6)
loss, R is radiative heat flux and C is convective heat flux. Metabolic heat production and evaporative heat loss values were based on data from the respirometry trials. Short-wave radiative heat gain was assumed to be negligible, since respirometry trials were conducted in shaded, indoor conditions. Long-wave radiative heat loss (Rloss) for each body segment was calculated using the Stefan–Boltzman equation:
Rloss = εsσTx4, (7)
where body surface emissivity (εs) was assumed to be 0.98 (Campbell, 1977) and σ=5.67×10⁻⁸W m−2K−4. Body surface temperatures (Tx) were assumed to be the same as internal temperatures (see Fig. 2). This assumption is strongly supported by the observations (a) that honeybee thorax surface temperatures (as determined by infrared thermography) are within 1 °C of internal Tthvalues (as determined by implanted thermocouples), even when Ta is up to 20 °C cooler than Tth (Stabentheiner and Schmaranzer, 1987), and (b) that, at similar
Tavalues, the Tthvalues of the honeybees in our experiment are nearly identical to the thermographically determined thorax surface temperatures of honeybees landing at a shaded nectar feeder (Schmaranzer and Stabentheiner, 1988). Leg temperatures during flight were assumed to be equal to Ta. Long-wave radiative heat gain (Rgain) was calculated using the following equation:
Rgain = aεcσTi4, (8)
where body surface absorptivity (a) is assumed to be 0.98 (Campbell, 1977), the emissivity of the borosilicate glass chamber (εc) was assumed to be is 0.90 (Bolz and Tuve, 1973) and the wall temperature of the of the glass flight chamber (Ti) was assumed to be the same as Ta. Net radiative heat flux (Rgain−Rloss) for each tagma was multiplied by the tagma surface area, and whole-bee radiative heat exchange was
calculated by summing the radiative heat exchange of each tagma. Convective heat exchange was calculated as:
C = (−M−E−R) . (9)
The whole-body convection coefficient (mW °C−1) was estimated by dividing convective heat loss by the mean body surface temperature (Tbs), which was calculated as:
Tbs = [(Th×Sh)+(Tth×Sth) + (Tab×Sab)]/(Sh + Sth + Sab) , (10)
[image:4.609.319.547.72.559.2]where Sxis tagma surface area. Table 1. Results of an independent-measures ANOVA
(SYSTAT, general linear model procedure) for the effects of air temperature, colony and flight duration on the body segment temperatures of honeybees flying continuously in a
550 ml chamber
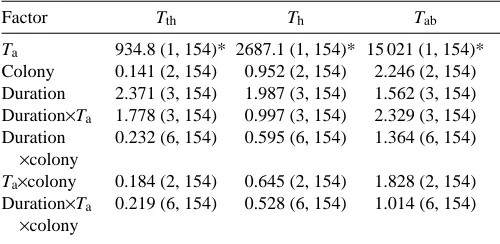
Factor Tth Th Tab
Ta 934.8 (1, 154)* 2687.1 (1, 154)* 15 021 (1, 154)* Colony 0.141 (2, 154) 0.952 (2, 154) 2.246 (2, 154) Duration 2.371 (3, 154) 1.987 (3, 154) 1.562 (3, 154) Duration×Ta 1.778 (3, 154) 0.997 (3, 154) 2.329 (3, 154) Duration 0.232 (6, 154) 0.595 (6, 154) 1.364 (6, 154)
×colony
Ta×colony 0.184 (2, 154) 0.645 (2, 154) 1.828 (2, 154) Duration×Ta 0.219 (6, 154) 0.528 (6, 154) 1.014 (6, 154)
×colony
F values are given with degrees of freedom in parentheses.
Asterisks indicate P values less than 0.00001; all other P values are greater than 0.05.
Tth, thoracic temperature; Th, head temperature; Tab, abdominal temperature; Ta, air temperature.
30 35 40 45 50
Thorax temperature (
°
C)
25 30 35 40 45
Head temperature (
°
C)
20 25 30 35 40 45
Abdomen temperature (
°
C)
Flight duration (min)
Ta =20.1–22.2°C
Ta =31.8–33.6°C
Ta =42–43°C
[image:4.609.41.291.133.255.2]0 2 4 6
Results
Body temperatures during flight
For honeybees flying continuously in a 550 ml glass chamber, body temperatures were not significantly affected by flight duration or colony (Tables 1, 2; Fig. 1). For the body temperatures plotted in Fig. 1, the variances of Tth, Thand Tab decreased significantly as Taincreased (Bartlett’s test, d.f.=2,
BTth=18.55, BTh=49.06, BTab=21.45, all P values <0.001). Body temperatures were significantly affected by Ta(Tables 1,
2; Fig. 2). For bees flying in the chamber, the slope of Tth
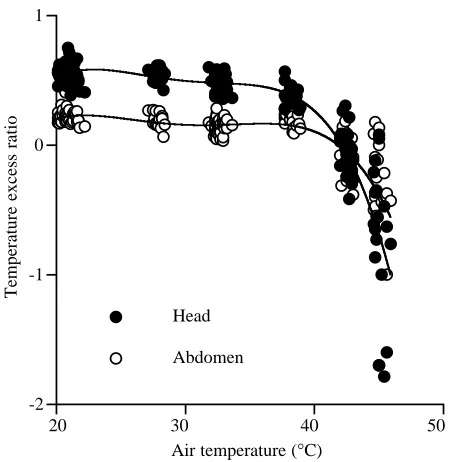
versus Tawas 0.39, while Tabwas much closer to Ta, with a slope of Tab versus Ta of 0.83 (Fig. 2). The Th versus Ta relationship was slightly, but significantly, non-linear (Fig. 2), and Thwas intermediate between Tthand Tabat most Tavalues. However, at Ta values above 43 °C, Th was lower than Ta (paired-sample t-test, d.f.=17, P<0.001). Head and abdominal temperature excess ratios were independent of Tabetween Ta values of 21 and 37 °C (Fig. 3), but decreased dramatically at
Tavalues above 37 °C.
Body mass, surface area and cuticular permeability
The mean body mass of A. mellifera workers included in the analysis of metabolism and water loss was 75.3±0.7 mg (mean ± S.E.M., N=25). There were no significant relationships between body mass and Ta, evaporative heat loss or metabolic heat production. Mean surface areas were: head, 26.8±0.3 mm2; abdomen, 79.5±2.2 mm2; thorax (minus legs and wings), 62.8±1.0 mm2; legs, 68.3±1.1 mm2 (means ± S.E.M.).
Mean cuticular permeabilities of freshly killed, mouth-and-anus-sealed honeybee workers were: 30 °C, 9.0±0.8µg H2O cm−2h−1mmHg−1; 35 °C, 11.5±0.9µg H2O cm−2h−1mmHg−1; 42 °C, 13.4±1.1µg H2O cm−2h−1mmHg−1 (means ± S.E.M.; 1 mmHg=133.3 Pa). The Q10 for cuticular permeability was 1.39.
Metabolic heat production, evaporative heat loss and water flux during flight
[image:5.609.59.288.195.659.2]Carbon dioxide emission was significantly affected by Ta,
Fig. 2. Body temperatures versus air temperature (Ta) (pooled across the three colonies) for honeybee workers flying in a 550 ml respirometry chamber. Least-squares regressions: Tth=0.388Ta+29.653,
N=178, r2=0.90, P<0.00001; T
h=−0.00446Ta2+0.857Ta+14.139,
N=178, r2=0.96, P<0.00001; Tab=0.828Ta+7.191, N=178, r2=0.99,
P<0.00001. Tab, abdominal temperature; Th, head temperature; Tth, thoracic temperature.
20 30 40 50
Head temperature (
°
C)
Th = Ta
30 40 50
Thorax temperature (
°
C)
20 30 40 50
Abdomen temperature (
°
C)
20 30 40 50
Air temperature (°C)
Tab = Ta
Tth =
Ta
Fig. 3. Head and abdomen temperature excess ratios (Rh and Rab, respectively) versus air temperature (Ta) for honeybees flying in a 550 ml respirometry chamber. Rh=(Th−Ta)/(Tth−Ta);
Rab=(Tab−Ta)/(Tth−Ta). Fitted lines are fourth-order least-square polynomial regressions. Tth, thorax temperature.
-2 -1 0 1
Temperature excess ratio
20 30 40 50
Air temperature (°C) Abdomen
[image:5.609.328.553.447.678.2]but not by the colony from which the honeybee was captured (Table 3). Metabolic heat production decreased linearly with increasing Ta (Fig. 4), falling by nearly half (from 639 to 361 mW g−1) as Tarose from 21 to 45 °C. Evaporative heat loss was not significantly affected by colony, but was significantly affected by Ta(Table 3). Evaporative heat loss increased with rising Ta, and the relationship between evaporative heat loss and Ta was non-linear and best described by a second-order polynomial regression (Fig. 4). As Ta increased from 21 to 33 °C, evaporative heat loss approximately doubled (increasing by 37 mW g−1). As Tarose from 33 to 45 °C, evaporative heat loss rose by 171 mW g−1 to values over seven times greater than at 21 °C.
Water flux during flight was not significantly affected by colony, but was significantly affected by Ta(Table 3). Water flux exhibited a significant negative relationship with increasing Ta and was non-linear and best described by a second-order polynomial regression (Fig. 5). Flying bees were in positive water flux at Tavalues below approximately 31 °C
and in strong negative water flux at higher Ta values. The increase in water vapor loss accounted for 61 % of the decline in water flux as Taincreased from 21 to 33 °C and for 91 % of the decline in water flux as Taincreased from 33 and 45 °C.
Heat budget of flying honeybees
[image:6.609.44.557.98.262.2]For honeybees flying in the respirometry chamber, rates of Table 2. Regression equations relating the body segment temperatures of honeybees flying in a chamber to air temperature for
three different colonies
Colony Slope Intercept r2 F P
A (N=66)
Tth 0.394±0.018 29.58±0.59 0.88 494 <0.00001
Th 0.566±0.017 18.67±0.56 0.95 1153 <0.00001
Tab 0.830±0.010 7.22±0.35 0.99 6316 <0.00001
B (N=62)
Tth 0.380±0.014 29.82±0.48 0.92 722 <0.00001
Th 0.572±0.013 18.34±0.44 0.97 1908 <0.00001
Tab 0.820±0.011 7.46±0.36 0.99 6040 <0.00001
C (N=50)
Tth 0.392±0.020 29.49±0.69 0.89 373 <0.00001
Th 0.573±0.021 18.23±0.72 0.94 735 <0.00001
Tab 0.839±0.009 6.74±0.31 0.99 8765 <0.00001
Tth, thoracic temperature; Th, head temperature; Tab, abdominal temperature. Values are means ±S.E.M.
Table 3. Results of an independent-measures ANOVA
(SYSTAT, general linear model procedure) for the effects of air temperature and colony on the rate of carbon dioxide production, rate of water loss and water flux of honeybees
flying in a 550 ml chamber
Factor V˙CO2 V˙H2O F˙H2O
Ta 46.58 (1, 19)* 111.24 (1, 19)* 97.64 (1, 19)* Colony 0.090 (2, 19) 0.732 (2, 19) 0.728 (2, 19)
Ta×colony 0.042 (2, 19) 1.337 (2, 19) 1.427 (2, 19)
F values are given with degrees of freedom in parentheses.
Asterisks indicate P values less than 0.00001; all other P values are greater than 0.05.
Ta, air temperature; V˙CO2, rate of CO2 production; V˙H2O, rate of water loss; F˙H2O, water flux.
Fig. 4. Metabolic heat production (M) (squares) and evaporative heat loss (E) (circles) versus air temperature (Ta) for honeybee workers flying in a 550 ml respirometry chamber. Open symbols, colony A; crossed symbols, colony B; filled symbols, colony C. Least-squares regressions (data pooled for the three colonies):
M=−11.564Ta+881.38, r2=0.74, P<0.00001; E=0.464Ta2−22.018Ta+ 291.38, r2=0.94, P<0.00001. Also shown are rates of metabolic heat production for flying honeybees measured using flow-through respirometry (diamonds; Harrison, et al., 1996a).
0 200 400 600 800
Heat flux (mW g
-1)
20 30 40 50
Air temperature (°C)
Metabolic heat production
[image:6.609.320.549.411.633.2]metabolic heat production and evaporative, radiative and convective heat flux at Tavalues of 21, 33 and 45 °C are plotted in Fig. 6. At all Ta values, radiation from the surface of the honeybee exceeded radiative heat gain such that flying honeybees were always experiencing a net radiative heat deficit. During flight at all Tavalues, metabolic heat production was the only pathway through which the honeybees experienced a heat gain. As Taincreased from 21 to 45 °C, the thermal stability of the thorax was aided by an increase in evaporative heat loss (specifically between 33 and 45 °C) and a decrease in metabolic heat production. Variation in radiative and convective heat losses hindered thermal stability of the thorax, since heat loss through these pathways decreased as Ta increased. The convection coefficient (4.05±0.39 mW °C−1; mean ±S.E.M., N=25) did not vary significantly with Ta (least-squares regression, P=0.58).
Discussion
The heat budget we present for flying honeybees (which is based on empirical measurements of metabolic heat production, evaporative heat loss and body temperatures across a range of Tavalues) indicates that variations in metabolic heat production and evaporative heat loss contribute to thermal balance in flying honeybees. Our respirometry experiments, as well as those from two other recent studies (Harrison et al., 1996a,b), show that metabolic heat production decreases
linearly by nearly half as Ta increases from 21 to 45 °C. Evaporative heat loss shows little change as Taincreases from 21 to 33 °C, but becomes very important to thermal stability at
Tavalues between 33 and 45 °C. The similar effects of Taon body temperatures (Tables 1, 2), the rate of carbon dioxide emission and evaporative water loss (Table 3; Fig. 4) on honeybees from three colonies support the generality of these findings for honeybees.
Body temperatures during flight
The body temperatures of honeybees flying in the chamber were independent of flight duration (Table 1; Fig. 1), indicating that bees flying in the respirometer maintained thermal equilibrium throughout flight bouts of 1–6 min. Honeybees flying in the respirometry chamber exhibited elevated and fairly stable Tth values, with Tth increasing by approximately 4 °C for every 10 °C increase in Tabetween Ta values of 20 and 46 °C (Fig. 1). Similar Tth versus Ta relationships for flying honeybees have been reported by Heinrich (1979, 1980a), Cooper et al. (1985), Coelho (1991b) and Harrison et al. (1996a,b). At a Ta of 45 °C, Tthaveraged 47.1 °C, ranging from 45.9 to 48.7 °C. At this Ta, bees were very close to the maximum Tthat which sufficient power can be generated for flight (49 °C; Coelho, 1991b). The fact that tagma temperatures were less variable during flight at the high
Tavalues (Figs 1, 2) suggests that convergence of Taand this upper thermal maximum causes honeybees to thermoregulate more precisely.
The abdomen is largely thermally independent of the thorax, since Tab during hovering flight closely tracked Ta (Fig. 1). This observation, along with the observation that Rabdid not
-400 -300 -200 -100 0 100
Water flux (mg H
2
O g
-1 h -1)
20 30 40 50
Air temperature (°C)
Xylocopa capitata
[image:7.609.57.286.72.295.2]Apis mellifera
Fig. 5. Water flux (F.H∑O) versus air temperature (Ta) for honeybee workers flying in a 550 ml respirometry chamber. Open symbols, colony A; crossed symbols, colony B; filled symbols, colony C. Least-squares second-order polynomial regression (data pooled for the three colonies): F.H∑O=−0.732Ta2+34.029Ta−354.05, r2=0.95,
P<0.00001. Also shown is water flux versus Tafor the carpenter bee
Xylocopa capitata hovering in the laboratory (dashed line; Nicolson
[image:7.609.328.552.78.294.2]and Louw, 1982).
increase at high Tavalues, indicates that heat is not variably transferred between the thorax and the abdomen as a mechanism of thermoregulation, which is consistent with the conclusions of Heinrich (1980b). This conclusion is supported by studies of the circulatory anatomy of honeybees, which describe the aorta as having nine convolutions in the petiole (Snodgrass, 1956). These loops function as a countercurrent heat exchanger, whereby warm hemolymph being pumped from the thorax to the abdomen is cooled as heat is transferred to forward-flowing hemolymph (Heinrich, 1980a). However, above 37 °C, Rabdecreased dramatically and became negative at 45 °C. According to the model of Baird (1986), a decrease in Rabat high Ta values would indicate an decrease in heat transfer from the thorax to the abdomen if no change in evaporative heat loss occurred. Since this would be counterproductive to thermoregulation of the thorax and since evaporative water loss increases in this Tarange (Fig. 4), these data strongly suggest that significant evaporation occurs from the abdomen at high Tavalues.
Between Tavalues of 21 and 37 °C, Rhvaried little (Fig. 3), suggesting that heat transfer between the thorax and the head was not regulated across these Ta values. However, Th fell below Ta at Ta values above 43 °C, indicating substantial evaporative cooling from the head. A similar effect of Taon
Th was reported for freely flying honeybees by Heinrich (1980b). Despite the high evaporative water loss at high Ta values, honeybees were not observed to tongue-lash or to extrude a drop of water from the mouth. Perhaps the increased evaporative water loss from the mouth can occur if the mouth is simply opened. The fact that both Rab and Rh decreased strongly during flight at high Tavalues (Fig. 3) suggests that evaporation was actively increased at more than one site on the body. This may have been due to several possible mechanisms, including (a) opening of the mouth and sting aperture to expose moist internal surfaces, (b) increasing cuticular water flux via specialized pores such as those of the desert cicada
Diceroprocta apache (Hadley et al., 1989) or exposure of soft,
inter-tergal cuticle sections or (c) increasing respiratory water loss via enhanced ventilatory flow during flight at high Ta values.
Metabolic heat production during flight
As shown in recent studies by Harrison et al. (1996a,b), the metabolic rates of flying honeybees decreased significantly with increasing Ta. The metabolic rates of flying honeybees measured using closed-system respirometry in the present study were nearly identical to the metabolic rates of honeybees in ‘continuous, undisturbed’ flight measured by Harrison et al. (1996a) using flow-through respirometry (Fig. 4), which allows measurement of flight metabolic rate with a much higher temporal resolution than closed-system respirometry. It is unclear what physiological mechanisms allow flying honeybees to decrease rates of metabolism by 43 % as Tarises from 21 to 45 °C. It is possible that hovering honeybees are thermoregulating by actively decreasing mechanical power output (and metabolic power requirements) at high Tavalues
by altering kinematic variables such as wingbeat frequency and stroke amplitude (Ellington, 1984). Another possibility is that honeybees flying at high Tavalues are increasing the efficiency of conversion of metabolic to mechanical power. Finally, it is possible that bees flying at high Ta values reduced the frequency of flight behaviors (turning rates, accelerations, vertical climbs, etc.) that could potentially affect power expenditure and metabolic rate. Although we have no such behavioral data for the honeybees in our study, we consider the latter possibility unlikely, since (a) flight behavior at all Ta values in our experiment consisted of hovering or very slow forward flight, with erratic, darting flight occurring only very rarely, (b) results from previous studies of bees indicate that there is little metabolic difference between hovering and forward flight (bumblebees; Ellington et al., 1990) or ‘agitated’ flight (honeybees; Harrison et al., 1996a,b) and (c) the convection coefficient was independent of Ta, as opposed to a negative convection coefficient versus Ta relationship that would be predicted by a decrease in acceleration and mean flight speed at higher Tavalues.
In support of the mechanical power hypothesis, it has been shown that honeybees flying in the laboratory (Harrison et al., 1996a,b) and in the field (Spangler, 1992) decrease their wingbeat frequency as Ta increases, and that vertical force production by tethered honeybee workers decreases by 45 % as Tth rises from 39 to 45 °C (Coelho, 1991b). A negative relationship between wingbeat frequency and Tahas also been documented for bumblebees (Unwin and Corbet, 1984), solitary bees of the genus Centris (Spangler and Buchmann, 1991; Roberts and Harrison, 1998; Roberts et al., 1998), dragonflies (May, 1995b) and hummingbirds (Berger and Hart, 1974; Chai et al., 1997, 1998), indicating that variations in wingbeat frequency and metabolic heat production may contribute to stable body temperatures in a wide variety of endothermic flying animals. For hovering ruby-throated hummingbirds Archilochus colubris, it is efficiency that is varied for thermoregulation (Chai et al., 1998); in this species, there is a relatively small decrease in wingbeat frequency and metabolic rate (0.2 % °C−1and 0.4 % °C−1, respectively) as Ta rises above 5 °C, yet an increase in wing stroke amplitude results in a constant power output across these Tavalues. For endothermic insects, however, the relative decreases in wingbeat frequency as Ta increases are much larger (0.7–1.9 % °C−1; May, 1995b; Roberts and Harrison, 1998; Roberts et al., 1998), suggesting that variation in wingbeat frequency may account for the wider variation in metabolic heat production in this group. Clearly, the identification of the mechanisms by which metabolic rate is varied will require a complete respirometric and kinematic analysis for insects flying across a range of Tavalues.
in kinematic viscosity with rising Ta (Lide, 1991) predict a slight increase in aerodynamic power requirements (Ellington, 1984) and, presumably, higher metabolic rates and wingbeat frequencies. Regardless of whether the decreases in metabolic rate and wingbeat frequency at high Ta values reflect active thermoregulatory processes or passive, inhibitory effects of high Tth on flight muscle performance, the large decrease in metabolic heat production that occurs as Tarises contributes strongly to the stable Tthvalues of flying honeybees.
Evaporative water loss and water flux during flight
Evaporative water loss rates of flying honeybees increased from 50 to 350 mg H2O g−1h−1as Tarose from 21 to 45 °C and were very high compared with rates of water loss of quiescent honeybees (19 mg g−1h−1, Ta=30 °C; Louw and Hadley, 1985) and of insects in general (Hadley, 1994). The elevated rates of evaporation that bees and other insects experience during flight are most often attributed to high rates of tracheal water loss that occur passively as a result of the increased ventilatory and metabolic demands of flight (Hadley, 1994). Passive temperature effects on respiratory and cuticular water loss predict that total rates of water loss during flight should approximately double as Ta increases from 21 to 45 °C, assuming that flying honeybees expire saturated air from the thoracic spiracles (Bailey, 1954), that ventilation rate is proportional to metabolic rate and that the cuticular permeability Q10 of flying honeybees is 1.39. In our experiment, however, water loss rates increased by sevenfold across this range of Ta values. Thus, the large increase in evaporation at high Ta values is much greater than predicted from passive increases in evaporation and probably represents an active thermoregulatory response, as proposed by Esch (1976) and Heinrich (1980a).
The strong negative relationship between water flux and Ta indicates that the thermal environment may strongly influence the water intake and renal function of flying honeybees. At Ta values below 31 °C, honeybees were in a moderately positive water flux, either requiring excretion of excess water or risking a decrease in hemolymph osmotic concentration. Copious production of hypo-osmotic urine has been reported for carpenter bees (Nicolson and Louw, 1982; Willmer, 1988; Nicolson, 1990) and bumblebees (Bertsch, 1984) flying at cool
Ta values. Our results confirmed the finding of Louw and Hadley (1985) that honeybees are in neutral water flux during flight at Ta values near 30 °C. However, at higher Ta values, the water flux of flying honeybees became strongly negative. Similarly, the water flux of flying carpenter bees (Xylocopa
capitata; Nicolson and Louw, 1982; see Fig. 5) and Centris pallida (Roberts et al., 1998) is positive at low Tavalues and becomes negative at higher Ta values. Thus, this thermal dependence of water flux may be a general phenomenon for flying endothermic bees.
If bees use body water reserves to cool evaporatively at high
Ta values, then this would require either an increased water intake or the risk of an increase in hemolymph osmotic concentration. Willmer (1986) reports that the
desert-inhabiting solitary bee Chalicodoma sicula increases water intake during foraging at high Ta values and experiences elevated hemolymph osmotic concentrations while collecting sand, required for building nest cells, but not while foraging for nectar. For a honeybee that has collected nectar or water, increasing evaporation by regurgitating the contents of the crop is an alternative to depleting body water reserves. However, for an outgoing forager, which has only a few microliters of honey or concentrated nectar in its crop, the water contents of the crop would be lost within a few minutes during flight at 45 °C, after which time body water reserves would necessarily be utilized.
Relative importance of heat flux pathways to thermal stability
As Taincreased from 21 to 45 °C, thermal stability was aided by a decrease in metabolic heat production and an increase in evaporative water loss; however, the relative importance of each pathway was dependent on Ta. As Taincreased from 21 to 33 °C, the decrease in metabolic heat production exceeded the increase in evaporative heat loss by nearly fourfold (Figs 4, 6). However, as Taincreased from 33 to 45 °C, the increase in evaporative heat loss was 4.5 times greater than that between 21 and 33 °C and 1.2 times greater than the decrease in metabolic heat production over the same range of Tavalues. Thus, variation in metabolic heat production was important for thermal stability during flight across a wide range Tavalues, while variation in evaporative heat loss contributed strongly to thermal stability primarily during flight at Ta values above 33 °C.
Thermoregulation during flight in the field
The heat budget we present represents that of honeybees flying in dry, still air and in shaded conditions. In contrast, honeybees flying in the field experience wide variations in airspeed, solar radiation and humidity. A strong increase in convective heat loss at high flight velocities (up to 8 m s−1for foraging honeybees; Fewell et al., 1991) should reduce the need to decrease metabolic heat production or to increase evaporative heat loss. However, the extent to which this occurs will not be known until accurate convective heat loss values are obtained for bees flying at various airspeeds. For a honeybee flying in the field on a clear day, radiative heat gain may exceed radiative heat loss by as much as 700 mW g−1 (Cooper et al., 1985), which is nearly double the metabolic heat production we measured for honeybees flying at 45 °C. Heinrich (1979) and Underwood (1991) have shown that honeybees arriving at feeders and at the hive in sunny conditions have only slightly warmer (1–2 °C) Tthvalues than bees arriving in shaded conditions, suggesting that increases in solar radiative heat gain do elicit some thermoregulatory response.
(Nicolson and Louw, 1982), suggesting either that evaporation is not an important component of thermoregulation during flight in this species or that other mechanisms of achieving thermal stability may be substituted for evaporative heat loss variation under these experimental conditions. To understand better how flying bees maintain thermal balance under natural conditions, more research is necessary to quantify the effects of air speed, solar radiation and humidity on body temperature, metabolic rates, evaporation and microhabitat selection. Tests for these effects on bees flying in natural conditions may be possible by constructing heat budgets from rates of metabolism and water loss determined using injections of doubly-labeled water (Wolf et al., 1996).
Thermal limits to honeybee flight
Sustained flight by honeybees occurs only between Tth values of 29 and 49 °C (Heinrich, 1979; Coelho, 1991b). Our results suggest that the ability of honeybees to fly at cool Ta values is limited by their ability to increase their rates of metabolic heat production. The critical lower Tanecessary for sustained flight in shaded conditions is approximately 15–16 °C, based on the observations that Tthand metabolic rate decrease strongly when Ta falls below 15–16 °C (Harrison et al., 1996a) and that honeybees can sustain flight at 20 °C but not at 10 °C (Heinrich, 1979).
Honeybee flight activity in extremely hot, sunny conditions may be limited over short periods by the minimum rates of power and metabolism necessary for flight or by the ability to enhance evaporative heat loss, and over longer periods by the effects of dehydration on flight performance. The metabolic rates we measured at 45 °C are lower than any published values for freely flying honeybees, suggesting that flight metabolic rates at these temperatures may be near the minimum possible. Given that honeybees fly in the Sonoran Desert on sunny days with radiative heat loads near 700 mW g−1and with Tavalues approaching 50 °C, it is clear that either their ability to increase evaporation or their ability to decrease metabolic heat production must exceed that observed in our study. It seems most likely that flight under these extreme heat loads must depend on further increases in evaporative heat loss, as suggested by Heinrich (1980a).
Can desiccation stress limit honeybee foraging at high Ta values? At Ta values of 45 °C in shaded conditions and relatively still air, the net water flux of flying honeybees was approximately −300 mg H2O g−1h−1, which is equivalent to half their body water per hour, assuming a body water content of 65 % (Hadley, 1994). Honeybee foraging distances vary, but one-way distances of 2–4 km are common (Seeley, 1985). Flight speeds are 5–8 m s−1 (Coelho, 1991a; Fewell et al., 1991), suggesting flight times to foraging patches of 4–10 min and losses of perhaps 10 % of body water. Unfortunately, we are unaware of any studies that have specifically measured the point at which dehydration limits flight ability in honeybees or any other insects. However, it seems likely that honeybees could tolerate this level of dehydration and, assuming that nectar is collected at the foraging patch, water flux over the
entire foraging period will be positive. However, as noted above, sunny conditions may require a tripling of evaporative water rates, leading to strong potential limits of water stress on foraging. Pollen foragers are likely to have the highest risk of dehydration, since they often have completely empty crops (Cooper et al., 1985) and use saliva to pack pollen onto the hindlegs. Supporting the contention that water stress can limit foraging activity under sunny, hot conditions, Cooper et al. (1985) reported that the proportion of returning foragers carrying pollen decreased dramatically when Ta values exceeded 38 °C.
This research was supported by a National Science Foundation Doctoral Dissertation Improvement Grant (IBN-9521543) to S.P.R. and a National Science Foundation Grant (IBN-9317784) to J.F.H. We thank J. H. Fewell, N. F. Hadley, M. Orchinik and G. E. Walsberg for the use of equipment and laboratory space. J. H. Fewell, N. F. Hadley, M. C. Moore, G. E. Walsberg and two anonymous reviewers provided helpful comments on the manuscript.
References
Bailey, L. (1954). The respiratory currents in the tracheal system of
the adult honey-bee. J. Exp. Biol. 31, 589–593.
Baird, J. M. (1986). A field study of thermoregulation in the
carpenter bee, Xylocopa virginica virginica (Hymenoptera: Anthophoridae). Physiol. Zool. 59, 157–167.
Beenakkers, A. M. T., Van der Horst, D. J. and Van Marrewwijk, W. J. A. (1984). Insect flight metabolism. Insect Biochem. 14,
243–260.
Berger, M. and Hart, J. S. (1972). Die Atmung beim Kolibri Amazilia fimbriata wahrend des Schwirrfluges bei verschiedenen
Umgebungstemperaturen. J. Comp. Physiol. 81, 363–380.
Bertsch, A. (1984). Foraging in male bumblebees (Bombus lucorum
L.): Maximizing energy or minimizing water load? Oecologia 62, 325–336.
Bolz, R. E. and Tuve, G. L. (1973). Handbook of Tables for Applied Engineering Science. Second edition. Cleveland, OH: CRC Press. Campbell, G. S. (1977). An Introduction to Environmental
Biophysics. New York: Springer-Verlag.
Chai, P., Chang, A. C. and Dudley, R. (1998). Flight thermogenesis
and energy conservation in hovering hummingbirds. J. Exp. Biol.
201, 963–968.
Chai, P., Chen, J. S. C. and Dudley, R. (1997). Transient hovering
performance of hummingbirds under conditions of maximal loading. J. Exp. Biol. 200, 921–929.
Coelho, J. R. (1991a). Heat transfer and body temperature in
honeybee (Hymenoptera: Apidae) drones and workers. Env. Ent.
20, 1627–1635.
Coelho, J. R. (1991b). The effect of thorax temperature on force
production during tethered flight in honeybee (Apis mellifera) drones, workers and queens. Physiol. Zool. 64, 823–835.
Cooper, P. D., Schaffer, W. M. and Buchmann, S. L. (1985).
Temperature regulation of honeybees (Apis mellifera) foraging in the Sonoran Desert. J. Exp. Biol. 114, 1–15.
Ellington, C. P. (1984). The aerodynamics of hovering insect flight. Phil. Trans. R. Soc. Lond. B 305, 1–181.
consumption of bumblebees in forward flight. Nature 347, 472–473.
Esch, H. (1976). Body temperature and flight performance of
honeybees in a servomechanically controlled wind tunnel. J. Comp.
Physiol. 109, 254–277.
Fewell, J. H., Ydenberg, R. C. and Winston, M. L. (1991).
Individual foraging effort as a function of colony population in the honeybee, Apis mellifera L. Anim. Behav. 42, 153–155.
Gmeinbauer, R. and Crailsheim, K. (1993). Glucose utilization
during flight of honeybee (Apis mellifera) workers, queens and drones. J. Insect Physiol. 39, 959–967.
Hadley, N. F. (1994). Water Relations of Terrestrial Arthropods. San
Diego, CA: Academic Press.
Hadley, N. F., Toolson, E. C. and Quinlan, M. C. (1989). Regional
differences in cuticular permeability in the desert cicada
Diceroprocta apache: Implications for evaporative cooling. J. Exp. Biol. 141, 219–230.
Harrison, J. F., Fewell, J. H., Roberts, S. P. and Hall, H. G.
(1996a). Achievement of thermal stability by varying metabolic heat production in flying honeybees. Science 274, 88–90.
Harrison, J. F., Fewell, J. H., Roberts, S. P. and Hall, H. G.
(1997). Honeybee Thermoregulation (Letter). Science 276, 1016–1017.
Harrison, J. F. and Hall, H. G. (1993). African–European honeybee
hybrids have low nonintermediate metabolic capacities. Nature
363, 258–260.
Harrison, J. F., Nielsen, D. I. and Page, R. E. (1996b). Malate
dehydrogenase phenotype, temperature and colony effects on flight metabolic rate in the honey-bee, Apis mellifera. Funct. Ecol. 10, 81–88.
Heinrich, B. (1979). Thermoregulation of African and European
honeybees during foraging, attack and hive exits and returns. J.
Exp. Biol. 80, 217–229.
Heinrich, B. (1980a). Mechanisms of body temperature regulation in
honeybees, Apis mellifera. I. Regulation of head temperatures. J.
Exp. Biol. 85, 61–72.
Heinrich, B. (1980b). Mechanisms of body temperature regulation in
honeybees, Apis mellifera. II. Regulation of thoracic temperatures at high air temperatures. J. Exp. Biol. 85, 73–87.
Heinrich, B. (1993). The Hot-Blooded Insects. Cambridge, MA:
Harvard University Press.
Heinrich, B. and Esch, H. (1994). Thermoregulation in bees. Am. Sci. 82, 164–170.
Heinrich, B. and Esch, H. (1997). Honeybee Thermoregulation
(Letter). Science 276, 1015.
Lide, D. R. (1991). (ed.) Handbook of Chemistry and Physics. Boca
Raton, FL: CRC Press.
Louw, G. N. and Hadley, N. F. (1985). Water economy of the
honeybee: A stoichiometric accounting. J. Exp. Zool. 235, 147–150.
May, M. L. (1991). Thermal adaptations of dragonflies, revisited. Adv. Odonatology 5, 71–88.
May, M. L. (1995a). Simultaneous control of head and thoracic
temperature by the green darner dragonfly Anax junius (Odonata: Aeshnidae). J. Exp. Biol. 198, 2373–2384.
May, M. L. (1995b). Dependence of flight behavior and heat
production on air temperature in the green darner dragonfly Anax
junius (Odonata: Aeshnidae). J. Exp. Biol. 198, 2385–2392.
Nicolson, S. W. (1990). Osmoregulation in a nectar-feeding insect,
the carpenter bee Xylocopa capitata: water excess and ion conservation. Physiol. Ent. 15, 433–440.
Nicolson, S. W. and Louw, G. N. (1982). Simultaneous measurement
of evaporative water loss, oxygen consumption and thoracic temperature during flight in a carpenter bee. J. Exp. Zool. 222, 287–296.
Pennycuick, C. J. (1968). Power requirements for horizontal flight
in the pigeon Columbia livia. J. Exp. Biol. 49, 527–555.
Roberts, S. P. and Harrison, J. F. (1998). Mechanisms of
thermoregulation in flying bees. Am. Zool. 38, 492–502.
Roberts, S. P., Harrison, J. F. and Hadley, N. F. (1998).
Mechanisms of thermal balance in flying Centris pallida (Hymenoptera: Anthophoridae). J. Exp. Biol. 201, 2321–2331.
Rothe, U. and Nachtigall, W. (1989). Flight of the honeybee. IV.
Respiratory quotients and metabolic rates during sitting, walking and flying. J. Comp. Physiol. B 158, 739–749.
Schmaranzer, S. and Stabentheiner, A. (1988). Variability of
thermal behavior of honeybees on a feeding place. J. Comp.
Physiol. B 158, 135–141.
Seeley, T. D. (1985). Honeybee Ecology. Princeton, NJ: Princeton
University Press.
Snodgrass, R. E. (1956). Anatomy of the Honeybee. Ithica, NY:
Comstock Publishing Associates, Cornell University Press.
Spangler, H. G. (1992). The influence of temperature on the wingbeat
frequencies of free-flying honeybees, Apis mellifera L. (Hymenoptera: Apidae). Bee Sci. 2, 181–186.
Spangler, H. G. and Buchmann, S. L. (1991). Effects of temperature
on wingbeat frequency in the solitary bee Centris caesalpiniae (Anthophoridae: Hymenoptera). J. Kansas Ent. Soc. 64, 107–109.
Stabentheiner, A. and Schmaranzer, S. (1987). Thermographic
determination of body temperatures in honeybees and hornets: calibration and application. Thermology 2, 563–572.
Stavenga, D. G., Schwering, P. B. W. and Tinbergen, J. (1993). A
three-compartment model describing temperature changes in tethered flying blowflies. J. Exp. Biol. 185, 325–333.
Stevenson, R. D. and Woods, W. A. (1997). Honeybee Thermoregulation (Letter). Science 276, 1015–1016.
Suarez, R. K., Lighton, J. R. B., Joos, B., Roberts, S. P. and Harrison, J. F. (1996). Energy metabolism, enzymatic flux
capacities and metabolic flux rates in flying honeybees. Proc. Natl.
Acad. Sci. USA 93, 12616–12620.
Underwood, B. A. (1991). Thermoregulation and energetic
decision-making in the honeybees Apis cerana, Apis dorstata and Apis
laboriosa. J. Exp. Biol. 157, 19–34.
Unwin, D. M. and Corbet, S. A. (1984). Wingbeat frequency,
temperature and body size in flies and bees. Physiol. Ent. 9, 115–121.
Willmer, P. G. (1986). Foraging patterns and water balance:
problems of optimization for a xerophilic bee, Chalicodoma sicula.
J. Anim. Ecol. 55, 941–962.
Willmer, P. G. (1988). The role of insect water balance in pollination
ecology: Xylocopa and Calotropis. Oecologia 76, 430–438.
Withers, P. C. (1992). Comparative Animal Physiology. Fort Worth,
TX: Saunders College Publishing.
Wolf, T. J., Ellington, C. P., Davis, S. and Feltham, M. J. (1996).
Validation of doubly labelled water technique for bumblebees