1354
Localized Proton MR Spectroscopy of the Allocortex and
Isocortex in Healthy Children
Choong-Gon Choi, Tae-Sung Ko, Ho Kyu Lee, Jung Hee Lee, and Dae Chul Suh
BACKGROUND AND PURPOSE: The human allocortex is different from the isocortex in
neuroglial cytoarchitecture. The purpose of this study was to compare metabolic data of the allocortex with those of the isocortex by using localized proton MR spectroscopy.
METHODS: Short-TE stimulated-echo acquisition mode proton MR spectroscopy (TR/TE 5 3000/30) was applied to the allocortex of the temporal lobe and isocortex of the parietal or frontal lobe in 30 healthy children (19 boys and 11 girls, 3–14 years old). Peak intensities of
N-acetylaspartate (NAA), choline-containing compounds (Cho), and myo-inositol (mI) relative
to creatine and phosphocreatine (Cr) were calculated. Metabolic data from the investigated regions were compared.
RESULTS: NAA/Cr was significantly lower in the allocortex than in the isocortex of the
parietal or frontal lobe: 1.05 6 0.12 (n 5 33) vs. 1.36 6 0.10 (n 5 28) or 1.32 6 0.10 (n 5 12), respectively. Cho/Cr and mI/Cr were significantly higher in the allocortex than in the isocortex: 0.84 6 0.11 vs. 0.56 6 0.06 or 0.756 0.10; 0.78 6 0.15 vs. 0.54 6 0.08 or 0.66 6 0.09, respectively. In the isocortex, NAA/Cr was not different but Cho/Cr and mI/Cr were significantly higher in the frontal cortex than in the parietal cortex.
CONCLUSION: Clear metabolic differences were observed between the allocortex and
isocortex.
The human cerebral cortex is composed of multiple neuronal cell layers mixed with glial cell compo-nents. For over a century, it has been well recog-nized that cortical neurons are arranged in certain laminar patterns and that the cerebral cortex dis-plays regional differences in these patterns. The ce-rebral cortex can be divided into the allocortex and the isocortex according to histologic characteristics. The allocortex is so named because it displays a wide variation of histologic patterns in different re-gions (1). In contrast, the isocortex has a more uni-form histologic pattern in different regions. The al-locortex is characterized by three neuronal layers— molecular, pyramidal or granular, and polymor-phic—and includes the cornu ammonis, dentate gy-rus, and parahippocampal gyrus. Most of the par-ahippocampal gyrus is a transitional zone between
Received August 11, 1999; accepted after revision February 15, 2000.
From the Departments of Radiology (C-G.C., H.K.L., D.C.S.) and Pediatric Neurology (T-S.K.), Asan Medical Cen-ter, University of Ulsan College of Medicine; and the Depart-ment of Radiological Science, Asan Institute for Life Sciences (J.H.L.), Seoul, Korea.
Address reprint requests to Choong-Gon Choi, MD, De-partment of Radiology, Asan Medical Center, University of Ulsan, 388-1 PoongNap-Dong, SongPa-Gu, Seoul 138-736, Republic of Korea.
qAmerican Society of Neuroradiology
the allocortex and isocortex. The isocortex, which comprises most of the cerebral cortex, is also known as the neocortex and is characterized pri-marily by six neuronal layers (1).
The normal human allocortex, or hippocampal area, has been studied extensively with the use of proton MR spectroscopy, especially in studies of temporal lobe epilepsy, but just to serve as control data (2–5). The characteristics of the normal allo-cortex, despite its importance, have rarely been studied (6–8) and have not been compared directly with the isocortex. This study was designed to compare metabolic data of the allocortex with those of the isocortex.
Methods
Subjects
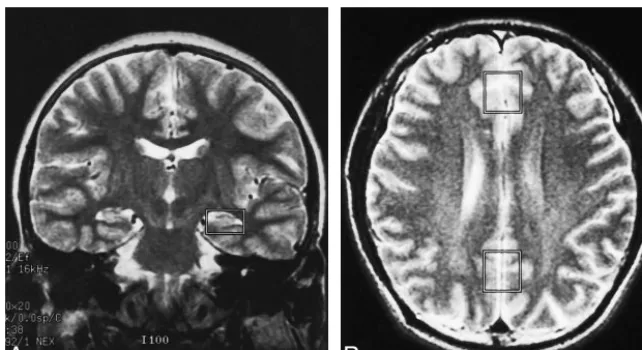
FIG1. A and B, Coronal (A) and axial (B)
T2-weighted MR images show typical lo-cations selected for proton MR spectros-copy of the allocortex (A), parietal cortex, and frontal cortex (B).
Proton MR Spectroscopy
Proton MR spectroscopy was performed on a 1.5-T system using a standard imaging head coil. Patients were positioned using soft pads such that the neck was slightly hyperextended. Thereafter, orthogonal axial and sagittal T1-weighted images and axial and coronal T2-weighted images were obtained ac-cording to the following MR imaging protocol: for T1-weight-ed images, spin-echo sequences were obtainT1-weight-ed with TR/TE5 500/11, field of view5200–240 mm, slice thickness55 mm with no gap, and matrix5256 3192; for T2-weighted im-ages, fast spin-echo sequences were obtained with TR/TE5 3500/102, echo train length 5 8, field of view 5 200 mm, slice thickness55 with no gap, and matrix52563192.
Automated short-TE proton MR spectra were recorded in the allocortex and isocortex of the frontal or parietal lobe with the use of a single-voxel stimulated-echo acquisition mode sequence (TR/TE/excitations5 3000/30/96, mixing time 5 13.7 milli-seconds, spectral width52500 Hz, number of points52048). The voxel size for the allocortex was fitted into the rectangular box shape (14318320 mm, 5 mL), taking both the anatomy of the hippocampus and parahippocampal gyrus and the signal-to-noise ratio into consideration. Special attention was paid to selecting the location of the voxel on coronal T2-weighted lo-calizer images to ensure coverage of the hippocampus and par-ahippocampal gyrus as much as possible within the volume of interest (Fig 1A). The spectra from the isocortex were obtained with our routine voxel size (18320320 mm, 7.2 mL) (Fig 1B).
Acquired spectroscopic raw data were transferred to a work-station (SPARC 10, Sun Computer, Mountain View, CA) and processed using postprocessing software (SA/GE, Milwaukee, WI). The processing consisted of water-referenced correction of the eddy current effect (9), lorentzian to gaussian transformation, gaussian line broadening of 0.5 Hz, zero-filling of 8K, Fourier transformation, and zero-order phasing of the transformed spec-trum. Major peaks at 2.01, 3.03, 3.22, and 3.56 ppm were as-signed to N-acetylaspartate (NAA), creatine and phosphocreatine (Cr), choline-containing compounds (Cho), and myo-inositol (mI), respectively (10). After the measurement of peak areas by lorentzian-gaussian fitting, metabolic ratios (NAA/Cr, Cho/Cr, and mI/Cr) were calculated using Cr as an internal reference, because the reported concentrations of Cr were similar in the various regions of the normal cerebral cortex, including the al-locortex (11–13).
In all, 81 spectra were acquired in the 30 subjects, consisting of 40 spectra from bilateral studies of the allocortex in 20 subjects, 29 spectra from the parietal cortex in 29 subjects, and 12 spectra from the frontal cortex in 12 subjects, resulting in 2.7 spectra per subject, on average. All MR imaging and MR spectroscopy studies were usually finished within 1 hour. Eight spectra that contained features of distorted baseline, prominent
motion artifacts, or insufficient water suppression were regard-ed as poor quality. Most of the poor-quality spectra (seven of eight) were obtained from the allocortex, which was expected owing to the large susceptibility differences in this anatomic location. One poor-quality spectrum obtained from the parietal cortex was caused by patient motion during the examination. Seventy-three spectra were included in the final data set, con-sisting of 33 spectra from the allocortex, 28 from the parietal cortex, and 12 from the frontal cortex.
Statistics
Spectroscopic data were reported as mean61 SD. A one-way ANOVA test was used to examine the difference in mean values among three groups. A two-sided unpaired t-test assum-ing equal variances was used to examine the difference in mean values between two groups (SPSS for Windows, release 7.5). Also, age-dependent changes of metabolic ratios were tested by correlation and linear regression analysis. P values less than .05 were considered significant.
Results
The allocortex showed no significant hemispher-ic asymmetry in metabolhemispher-ic ratios in comparisons of the mean values from the right and left side in 17 subjects (for NAA/Cr: 1.0560.11 vs. 1.0460.14,
P5.41; for Cho/Cr: 0.8560.10 vs. 0.8360.13,
P 5.24; for mI/Cr: 0.75 60.12 vs. 0.80 6 0.18,
[image:2.612.60.381.58.233.2]Spectroscopic data from the allocortex and isocortex
Allocortex (n533)
Isocortex Parietal (n528)
Frontal
(n512) P
NAA/Cr 1.0560.12 1.3660.10 1.3260.10 ,.001†
P ,.001 ,.001
.352*
Cho/Cr 0.8460.11 0.5660.06 0.7560.10 ,.001†
P ,.001 .017
,.001*
mI/Cr 0.7860.15 0.5460.08 0.6660.09 ,.001†
P ,.001 .020
,.001*
Note.—Mean values61 SD are given. P values are for a two-sided unpaired t-test comparison between the allocortex and isocortex. *Values are for a two-sided unpaired t-test comparison within the isocortex.
†Values are for one-way ANOVA test.
FIG 2. A–C, Typical proton MR spectra obtained from the allocortex (A), parietal cortex (B), and frontal cortex (C). Acquisition and
processing parameters used for all spectra are the same as described in the text, except for voxel sizes, which are 5.0 mL for the allocortex and 7.2 mL for the isocortex. All spectra are scaled individually and cannot be used for direct comparison. NAA, 2.01 ppm; Cr, 3.03 ppm; Cho, 3.22 ppm; mI, 3.56 ppm.
Discussion
Because the T1 and T2 relaxation times of major brain metabolites do not show significant regional differences in the cerebral cortex of healthy sub-jects (8, 14) and because NAA is generally ac-cepted as a neuronal marker (15), the observed lower NAA/Cr in the allocortex may be the result of relatively low NAA concentration in this region. Previous quantitative proton MR spectroscopy studies have also reported relatively low NAA con-centrations in the allocortex (2, 8). Compared with the six-layered isocortex, the neuronal component of the allocortex is composed primarily of scattered large pyramidal neurons in the middle layer of the cornu ammonis, small granular neurons in the den-tate gyrus, and the neurons within the parahippo-campal gyrus, which is a transitional zone between the three-layered allocortex and the six-layered iso-cortex. A cytoarchitectural study reported lower neuronal density in the allocortex than in the iso-cortex (16), supporting spectroscopic results.
The relatively high Cho/Cr and mI/Cr ratios in the allocortex may be caused by higher concentrations of Cho and mI than in the isocortex, in agreement with previous quantitative proton MR spectroscopy studies (8, 11). The major Cho metabolites detected by pro-ton MR spectroscopy—phosphorylcholine, glycero-phosphorylcholine, and Cho plasmalogen—are in-volved in the metabolism of membrane Cho phospholipid. Once the active myelination process is completed within 2 years after birth, regional differ-ences in Cho concentrations in the normal brain may depend mainly on the cell density and cell types of the anatomic regions. A proton MR spectroscopy study of cell type-specific cultures revealed Cho con-centration to be two or three times higher in glial cells (astrocyte or oligodendrocyte) than in neurons (17). Therefore, we speculate that the higher Cho concentration in the allocortex may be due to rela-tively high glial density as compared with the iso-cortex. The allocortex may have relatively larger amounts of glial components, especially in the thick molecular and polymorphic layer of the dentate gyrus and cornu ammonis, which have very low neuronal cell densities.
mI seems to be involved in the osmoregulatory system in astrocytes (18). A multinuclear MR spec-troscopy study of cell type-specific cultures sug-gested that mI is located mainly in astrocytes (19). We therefore speculate that mI concentration may depend on the astrocytic density of the anatomic region in healthy subjects. The relatively high mI/ Cr ratio in the allocortex may be the result of its higher astrocytic density than in the isocortex. Our speculation is supported by a study showing the greatest intensity of cortical astrocyte marker (glu-tamine synthetase) in the allocortex as compared with other regions of the brain in rats (20). How-ever, cytoarchitectural data from the human brain may be necessary to verify this theory.
FIG3. Spectroscopic data plotted against age of the children. A, NAA/Cr vs. age.
B, Cho/Cr vs. age. C, mI/Cr vs. age.
due to similar neuronal densities in both regions. von Economo (16) classified the isocortex into five basic types—agranular, frontal, parietal, polar, and atypical granular—on the basis of the cytoarchitec-tural patterns of the granular and pyramidal neu-rons. The parietal and frontal isocortex investigated in this study belongs to the same frontal type; therefore, it may have a similar neuronal cytoar-chitecture or density, which may account for the observed similar NAA/Cr ratios in both regions. On the other hand, the higher Cho/Cr and mI/Cr seem to be caused by the higher glial density in the frontal cortex. A quantitative proton MR spectros-copy study (11) also detected a higher Cho con-centration in the frontal cortex than in the parietal or occipital cortex. Previous cytoarchitectural stud-ies have usually focused on the neuronal compo-sition of the cerebral cortex and have paid little attention to the glial counterpart (1, 16). However, more recently, it has become well recognized that the glial counterpart plays an essential role in the proper functioning of the cortex (21, 22). Neuro-glial composition may be different in various re-gions to adapt to the functions of the cerebral cor-tices (20, 23, 24).
Because the subjects in our study were all chil-dren, age-dependent changes in metabolites should be taken into consideration. A previous quantitative MR spectroscopy study found that Cr and mI con-centrations in children’s brains become similar to those of adults within 2 years after birth, and that NAA and Cho concentrations continue to change slowly until age 7 years (25). In this study of 3- to
14-year-olds, we detected no age-dependent chang-es in the various metabolic ratios. It seems that children’s brains maintain a stable cellular com-position and metabolism once active myelination is completed.
Conclusion
Clear metabolic differences were found between the allocortex and isocortex in the brains of healthy children. As compared with the isocortex, the al-locortex is characterized by a relatively low NAA/ Cr ratio and high Cho/Cr and mI/Cr ratios. We speculate that these spectroscopic differences may correlate with the regional differences in cortical neuroglial composition; however, further histolog-ic–spectroscopic correlation is needed to support our speculation.
Acknowledgments
We gratefully acknowledge the technical assistance of Sang-Tae Kim and Sun-Woo Lee in patient preparation and data acquisition. We also thank Byung-Hee Min for proofreading the manuscript.
References
1. Clemente CD. Developmental and gross anatomy of the central
nervous system. In: Clemente CD, ed.Gray’s Anatomy, 30th
American ed. Philadelphia: Lea & Febiger; 1985;1075–1082 2. Breiter SN, Arroyo S, Mathews VP, Lesser RP, Bryan RN, Barker
PB. Proton MR spectroscopy in patients with seizure
3. Ng TC, Comair YG, Xue M, et al. Temporal lobe epilepsy:
pre-surgical localization with proton chemical shift imaging. Ra-diology 1994;193:465–472
4. Lu D, Margouleff C, Rubin E, et al. Temporal lobe epilepsy:
correlation of proton magnetic resonance spectroscopy and
18F-fluorodeoxyglucose positron emission tomography. Magn Reson Med 1997;37:18–23
5. Woermann FG, McLean MA, Bartlett PA, Parker GJ, Duncan JS.
Short-echo time single-voxel 1H magnetic resonance spectros-copy in magnetic resonance imaging-negative temporal lobe epilepsy: different biochemical profile compared with hippo-campal sclerosis. Ann Neurol 1999;45:369–376
6. Strauss WL, Tsuruda JS, Richards TL. Partial volume effects in
volume-localized phased-array proton spectroscopy of the temporal lobe. J Magn Reson Imaging 1995;4:433–436
7. Bernard D, Walker PM, Baudouin-Poisson N, et al. Asymmetric
metabolic profile in mesial temporal lobes: localized H-1 MR spectroscopy in healthy right-handed and non-right-handed subjects. Radiology 1996;199:381–389
8. Choi CG, Frahm J. Localized proton MRS of the human
hip-pocampus: metabolite concentrations and relaxation times. Magn Reson Med 1999;41:204–207
9. Klose U. In vivo proton spectroscopy in presence of eddy
cur-rents. Magn Reson Med 1990;14:26–30
10. Michaelis T, Merboldt KD, Haenicke W, Gyngell ML, Bruhn H, Frahm J. On the identification of cerebral metabolites in
local-ized1H NMR spectra of human brain in vivo. NMR Biomed
1991;4:90–98
11. Pouwels PJ, Frahm J. Regional metabolite concentrations in
hu-man brain as determined by quantitative localized proton MRS. Magn Reson Med 1998;39:53–60
12. Peeling J, Sutherland G.1H magnetic resonance spectroscopy
of extracts of human epileptic neocortex and hippocampus. Neurology 1993;43:589–594
13. Thatcher NM, Prior MJW, Morris PG, Bachelard HS. Magnetic
resonance spectroscopy studies on changes in cerebral calcium
and zinc and energy state caused by excitotoxic amino acids. J Neurochem 1999;72:2471–2478
14. Kreis R. Quantitative localized 1H MR spectroscopy for
clin-ical use. J Prog Nucl Magn Reson Spectroscopy 1997;31:155–195
15. Birken DL, Olendorf WH. N-acetyl-L-aspartic acid: a literature
review of a compound prominent in 1H-NMR spectroscopic
studies of brain. Neurosci Biobehav Rev 1989;13:23–31
16. von Economo CV, Koskinas GN. U¨ bersichtstabellen der
wich-tigsten areae. In: Die Cytoarchitektonik der Hirnrinde des er-wachsenen Menschen. Berlin: Spinger; 1925;794–801
17. Urenjak J, Williams SR, Gadian DG, Noble M. Proton nuclear
magnetic resonance spectroscopy unambiguously identifies dif-ferent neural cell types. J Neurosci 1993;13:981–989
18. Ross BD. Blu¨ml S. New aspects of brain physiology. NMR
Bio-med 1996;9:279–296
19. Brand A, Richter-Landsberg C, Leibfritz D. Multinuclear NMR
studies on the energy metabolism of glial and neuronal cells. Dev Neurosci 1993;15:289–298
20. Norenberg MD. Distribution of glutamine synthetase in the rat
central nervous system. J Histochem Cytochem 1979;27:756–762
21. Derouiche A, Frotscher M. Astroglial processes around identified
glutamatergic synapses contain glutamine synthetase: evidence for transmitter degradation. Brain Res 1991;552:346–350
22. Schousboe A, Westergaard N, Waagepetersen HS, Larsson OM, Bakken IJ, Sonnewald U. Trafficking between glia and neurons
of TCA cycle intermediates and related metabolites. Glia 1997;
21:99–105
23. Patel AJ, Weir MD, Hunt A, Tahourdin CS, Thomas DG.
Distri-bution of glutamine synthetase and glial fibrillary acidic pro-tein and correlation of glutamine synthetase with glutamate decarboxylase in different regions of the rat central nervous system. Brain Res 1985;331:1–9
24. Ernsberger P, Iacovitti L, Reis DJ. Astrocytes cultured from
spe-cific brain regions differ in their expression of adrenergic binding sites. Brain Res 1990;517:202–208
25. Kreis R, Ernst T, Ross BD. Development of the human brain:
in vivo quantification of metabolite and water content with proton magnetic resonance spectroscopy. Magn Reson Med