inted in Great Britain © The Company of Biologists Limited 1984
ACID-BASE REGULATION AND ION TRANSFERS IN
THE CARP {CYPRINUS CARPIO) DURING AND AFTER
EXPOSURE TO ENVIRONMENTAL HYPERCAPNIA
BY J. B. CLAIBORNE* AND NORBERT HEISLER
Abteilung Physiologie, Max-Planck-Institut fur experimentelle Medizin, D-3400 Gottingen, F.R.G.
Accepted 1June 1983
SUMMARY
Acid-base balance and ion transfers were studied in the carp, Cyprinus
carpio L., during and after 48 h of exposure to environmental hypercapnia
(PcO2~7-5Torr). Plasma pH, Pco2, [HCO3~], and net transfers of HCC>3~, N H / , Cl~ and Na+ between the fish and the environmental water were measured periodically throughout the experiment.
Over the first 8 h of hypercapnia, plasma Pco2 increased by 7-6 Torr with a concurrent decrease in plasma pH of 0'28 units. Plasma [HCO3""] was slowly elevated from about 14 to 22 mM after 48 h, at which point 50% of the pH depression expected at constant bicarbonate concentration had been compensated. The net amount of H+ transferred to the water was 3-3 mmol kg"1 fish, representing a 115 % increase in the rate of cumulative H+ efflux, and inducing an elevation of both intracellular and extracellular [HCC>3~]. Cl~ transfer was reversed from a net uptake to a net efflux, while net Na+ influx was increased slightly.
Following hypercapnia, plasma pH returned to control values within 1 h, while the plasma [HCCb"], which was elevated during hypercapnia, fell continuously to reattain pre-hypercapnic control values after 20 h. The [HCO3~] decrease was due to the net gain of H+ ions from the water during this period. Cl~ transfer returned to a net uptake, while the original Na+ influx was reversed to a net loss.
Acid-base regulatory responses in the carp are qualitatively similar to those observed in other fish, though the time required for compensatory pH adjustment is longer. It is concluded that alterations in the rates of CP/HCCb" and Na / H+ exchanges during hypercapnia and N a+/ H+ exchange following hypercapnia, play a significant role in the compensation of respiratory acid-base disturbances in these animals.
INTRODUCTION
The nature of blood acid-base regulation in fish during hypercapnia has been studied in several marine and freshwater species (e.g. Lloyd & White, 1967; Heisler, Weitz & Weitz, 1976; Eddy, Lomholt, Weber & Johansen, 1977). The general pattern
26 J. B. CLAIBORNE AND N. HEISLER
of response to an elevation in plasma Pco2 (and the concomitant depression of plasma pH) observed in these animals is a compensatory increase of the plasma HC03~ concentration. The augmentation of [HCC>3~] induces an increase in arterial pH to values near or identical to control levels (see review by Heisler, 1982a). The time course of the HCC>3~ build-up may be of the order of several hours to several days, depending on the species examined (e.g. Janssen& Randall, 1975; Heisler et al. 1976). In both teleosts and elasmobranchs, extracellular acid-base balance may involve a combination of HCC>3~, H+ and NH4"1" transfers between the animal and the environ-ment, predominantly occurring at the gills (Heisler et al. 1976; Cameron, 1980; Evans, 1982; Holeton, Neumann & Heisler, 1983; Heisler, 19826). HCO3" (or H+) movements between extracellular and intracellular compartments also play a role in the initial stages of pH compensation following the onset of hypercapnia (Heisler et
al. 1976; Cameron, 1980).
The underlying mechanisms behind the branchial ion transfers of HCCh", H+ and NH4+ have not been studied in such detail. It has been proposed that the transbran-chial ion exchange processes - i.e. Na+/H+, Na+/NH4+, and C1~/HCC>3~ exchange — that are thought to occur in teleosts and elasmobranchs (Maetz & Garcia-Romeu,
1964; Maetz, 1973; Evans, 1977; Claiborne, Evans & Goldstein, 1982) are involved with acid-base regulation as well as ion regulation in these fish (DeRenzis & Maetz, 1973; Cameron, 1976; Evans, 1982; Heisler, 1982a). Utilizing the freshwater arctic grayling, Thymallus arcticus, Cameron (1976) showed that the uptake of Na+ during hypercapnia was enhanced at the same time that Cl~ influx was inhibited. This result might be expected if the efflux of H+ (and/or NH4+) and HCC>3~ were linked to the uptake of Na+ and Cl~, respectively. In contrast, Perry, Haswell, Randall & Farrell (1981) recently found that hypercapnia had no effect on the rates of branchial NaCl influx in the trout, Salmo gairdneri. They proposed that transbranchial Na+/H+ (NH4+) and C1~/HCO3~ exchanges were not involved with blood acid-base regula-tion during or following hypercapnia.
The purpose of the present experiment was two-fold: (1) to examine the ex-tracellular acid-base response of the freshwater carp during and after environmental hypercapnia, and (2) to determine the net rates of HCCb", H+, NH4"1", and NaCl movements between the animal and the surrounding media, and the contribution of these transfer processes towards the regulation of the overall acid-base status of the fish.
MATERIALS AND METHODS Maintenance and preparation of the animals
Carp (Cyprinus carpio; weight 1-783 ± 0-092 kg, x±s.E., N=S) were obtained from a local fish hatchery and maintained for at least 1 month in large aquaria (lOOlfish"1) at 15±0-5°C supplied with dechlorinated and well aerated local tap water at a rate of > 1001 fish"1 day"1. The fish were subjected to a standardized 12 h light/12 h dark cycle and regularly fed with commercial carp chow.
^ : 20 000) had been added. Implantation of a dorsal aortic cannula was accomplished by the methods described by Ultsch, Ott & Heisler (1981) as modified from those of Soivio, Westman & Nyholm (1972) and Soivio, Nyholm & Westman (1975). Briefly, a short length of PE 60 tubing with several notches cut near one end to allow enhanced blood flow once implanted, was threaded onto a piece of straight wire until the sharpened end of the wire just extended past the notched end of the tubing. This assembly was then inserted through the roof of the mouth of the anaesthetized fish into the dorsal aorta, the wire removed, and the cannula advanced into the artery by about 7 cm. A hollow grommet was implanted in the thin tissue on the side of the mouth, and the free end of the cannula was fed through the grommet to the outside. The tubing was held in place by one shallow suture in the roof of the mouth and two sutures tied around the cannula on either side of the grommet and hardened with a drop of cyanoacrylate glue. Using a small adapter, an additional length of PE tubing filled with Ringer solution (Cortland Ringer solution, glucose and HCC>3~ free; lOOi.u.mn1 heparin) was connected to the original cannula. The entire length of tubing was flushed briefly with Ringer solution and the open end was then plugged. The fish was placed in the experimental chamber filled with fresh water, and after regular opercular movements had resumed (usually within 20 s) the top of the cham-ber was replaced and the flow of fresh water maintained. This method of implantation allowed unrestrained movement of the animals, and held the cannula in position for the duration of the experimental procedures (and well over 3 weeks in several fish returned to a holding tank).
1
Experimental set-up
A closed water recirculation system (Heisleret al. 1976; Heisler, 1978) with a total volume of 191 was utilized in these experiments (Fig. 1). The water in the system was pumped through a large aeration column (61) through a Plexiglas box (121) contain-ing the fish, and then returned to the column. Water was circulated at approximately 51min~' and thermostatted to 15 ±0-5°C. Input gas for the aeration column was controlled through two gas flow meters with differential pressure regulators, permit-ting precise mixing of air and CO2 bubbled through the water. [NH4"1"] of the water was monitored throughout the experiments with an ammonia electrode (HNU Sys-tems Inc., Newton, Massachusetts) which was mounted in a Plexiglas, thermostatted chamber (30 ± 0-05 °C), with a volume of 2 ml. The fluid within the chamber was constantly stirred with a magnetic bar and sealed from the atmosphere with an 'O'-ring. Ports in the chamber near the electrode tip allowed the rapid change of solutions in contact with the membrane. Water from the recirculation system was transported to the ammonia electrode with a roller pump and mixed with a small volume of 10 M-NaOH also pumped into the chamber in order to alkalinize (pH > 12) the sample and convert all ammonium ions to physically dissolved ammonia. The electrode was connected to a microprocessor/ionalyser (Orion Research; model 901) and corres-ponding digital printer (model 951). After an initial slope calibration of the electrode assembly using 0-1 and l-0mM-NH4Cl standards, the base-line calibration of the electrode was readjusted (with 0-lmM-NH4Cl) prior to every water ammonia
J. B. CLAIBORNE AND N. HEISLER
Micro - Ionmeter
Digital
printer
[image:4.451.43.408.37.375.2]1 % CO2 in N2
Fig. 1. Experimental apparatus. The closed recirculation system consisted of an animal box, gas equilibration column and recirculation pump. Water HCO3" and NH4+ concentrations were measured
usinga'A-bicarbonate measurement system' (lower left) and an ammonia sensitive electrode assembly (upper left), respectively. Water samples were periodically saved for ion analysis. Blood samples were collected through a dorsal aortic cannula. See text for details. PT, pressure transducer.
pump, ionalyser, printer and two small-volume, 12 V d.c. valves connecting delivery lines from the experimental water and the NH4CI standard. This system allowed automatic analysis of water samples for up to 7 days of preprogrammed collection times with a resolution of 0-01 mM-NH4+.
"5il changes in pH were then due to changes in bicarbonate concentration of the water. Bicarbonate concentrations were calculated using the Henderson-Hasselbalch equa-tion (Heisler, 1978). The electrodes were initially calibrated with two phosphate buffers (pH ~ 6-8, pH ~ 7-4) and prior to (and occasionally after) each experiment, the baseline calibration was rechecked by measuring in triplicate the total CO2 content of the water (TC02) conductometrically (Capni-Con II; Cameron Instruments Inc., Port Aransas, Texas). In practice, electrode drift was very low throughout the experi-ments, and when the slope calibration was rechecked with phosphate buffers, a varia-tion of less than 0-010 pH units was usual even after several months.
In most experiments, a water-filled tube (PE 60) was inserted through the top of the fish chamber and submerged below the water surface. The other end of the tube lead to a pressure transducer (Statham Instruments Inc., P23BB) connected to an amplifier and chart recorder. This allowed fish swimming activity to be continuously monitored, and made possible the important precaution of not beginning experiments until the animals had regained their normal quiescence (sometimes requiring several days post-operation).
Protocol
Experiments were divided into three successive parts: (1) a control period usually 12 h or more in length, (2) a 48-h hypercapnic period, and (3) a post-hypercapnic period, again 48 h in length. During the hypercapnic period, the recirculation system was bubbled with a mixture of approximately 1 % CO2 in air (water Pcc»2 ~ 7-5 Torr, Po2~ 120Torr), while during control and post-hypercapnic periods, the water was equilibrated with air (PcO2~ 1 "3 Torr, Po2> 120Torr). In most experiments, the recirculation system was flushed between each period with fresh water (gassed with the appropriate COz/air combination) in order to prevent the build-up of excreted ammonia. During all periods, water [HCO3~] and [NH4"1"] were monitored and water samples were saved for ion analysis. [Na+] was determined by flame photometry (Instrumentation Laboratory Model 343), and [Cl~] was measured with a system consisting of a solid state Cl~-sensitive electrode and reference connected to a microprocessor/ionalyser, printer and timer/microprocessor, which was automatic-ally calibrated with NaCl standard after every second measurement. Immediately before the beginning of the hypercapnic period, three successive control blood sam-ples were withdrawn at 15-min intervals. During hypercapnia and post-hypercapnia, blood samples were taken at 0, 0-5, 1, 2, 4, 8, 20, 28 and 48 h after the respective change in water Pc02 • Each sample (total volume at least 0-4 ml) was analysed for plasma Pco2 > P02, pH and Tco2 • Pc02. P02 ar>d pH were measured with the appropriate microelectrodes (Radiometer, Copenhagen) according to the methods described by Heisler (1978). A small portion of the blood sample was centrifuged briefly in haematocrit tubes, the haematocrit recorded, and samples of plasma were analysed in duplicate for Tco2 using a Capni-Con II (Cameron Instruments Inc.) which was calibrated with K2CO3 standards.
Calculations
HCC>3~ concentration was calculated by subtracting dissolved CO2 (otco2x from Tc02 using values calculated from those for human plasma reported by
30 J. B. CLAIBORNE AND N . H E I S L E R
Severinghaus (1965). AHCO3~w , ANH4+W , AC1"W , and ANa+w (in mmol kg"1 fish)
were computed for all time periods by multiplying the measured concentration of the specified ion (mmolT1) by the total volume of water within the recirculation system (starting volume—volume of water samples removed) and correcting for the weight of the animal. AH+(r->w is the paired difference between AHCO3~W and
ANH4+W for each sample. Control cumulative ion transfer rates (in mmolh"1
kg"1; Table 1) were calculated by dividing the appropriate net ion concentration changes by the length of the control period (usually 12 h). 'Net A' values are the difference between control and experimental means for each time period. Statistical analysis was performed utilizing Student's t test for paired or unpaired data where appropriate. Calculations were carried out on a minicomputer (Digital, PDP 11/03-L) using specially designed software (Claiborne & Heisler, 1983).
RESULTS
Control values for acid-base and electrolyte parameters for the carp in normocapnic water are presented in Table 1. Plasma pH, Pco2 > [HCO3~] and [Cl~], as well as net transfers of HCCb~ and ammonia, were very similar to those reported earlier for this species (Ultsch et al. 1981). The mean control P02 measured in the present experi-ments was lower than that presented by Ultsch and coworkers but was not statistically different due to the large variation between individual animals in the earlier study. The mean P02 reported here is concordant with values obtained from free-swimming, undisturbed carp (Po2 = 37-5 ± 6-3 Torr, x ± S.E., N = 6; J. B. Claiborne & N.
Heis-ler, unpublished results; Po2~25Torr, N. Heisler & P. Neumann, unpublished results).
[image:6.451.39.414.475.609.2]The changes in blood acid-base status following exposure to environmental hyper-capnia are shown in Fig. 2. Plasma PcO2 increased significantly from approximately 4-8 to 8-8 Torr (P<0-01, TV =7) over the first 30min and finally rose to 12-6 Torr after 48 h. After 8 h of hypercapnia, plasma pH had decreased from about 7-87 to 7-59
Table 1. Control values for acid-base and electrolyte parameters in Cyprinus carpio
Parameter
Dorsal aortic plasma
Pco, (Torr) 4-75 ± 0-26 (7) Pch(Torr) 44-4 ±5-9 (7) pH 7-87 ±0-05 (7) [HCO3-] (mM) 13-8 ± 1 0 (7) Cumulative ion transfer rates (mmol h"1 kg"1)
A H C C V . 0-100 ±0-039 (8) ANH,+
W 0-17 ±0-03 (8)
AH+_w 0-07 ±0-02 (8)
AC1% -0-027 ±0-021 (5) A N a+. -0-018 ±0-028 (5)
x ± S.E.., number of experiments in parentheses.
31
I 10
" y * * :
j i I I I
«v-?^^^
I i I
6 o
25
15
10
8-0r
X 7-8 o.
7-6
10 20 30
Time (h)
[image:7.451.74.387.60.496.2]50
Fig. 2. Plasma Pcoj , [HCO3 ] and pH in dorsal aortic blood following the onset of environmental hypcrcapnia (x ± s.E.,A' = 7). Shaded areas representx ± s.E. of the pre-hypercapnic control values.
(P< 0-001, N= 7), and then recovered to 7-68 at the end of the 48 h. This value was
still significantly below that of the control measurement. Plasma HCO3~ concentra-tion had increased from 13-8 to 21-6mM (P< 0-001, N = 7) by the end of the hyper-capnic exposure.
32 J. B. CLAIBORNE AND N. HEISLER
remainder of the experimental period. Plasma [HC03~] declined slowly and, iri parallel with Pco2. was significantly elevated from pre-hypercapnic levels until after 20 h of normocapnic exposure.
Hypercapnia induced a reduction in the rate of HCQj" excretion and an increase in ammonia transfer (Fig. 4). The control HCQ3~ excretion of 0-10 mmol h"1 kg"1 was significantly reduced by some 60% to 0-04 mmol h"1 kg"1 between hours 16 to 28 of hypercapnia. NH4+ efflux was significantly increased from 0-17 to 0-32mmol h~' kg"1 during the first 16 h of this period. These changes produced a 115 % increase in
1 5r
I »
--!re^'^^
_ L I i i i i I
30
-6
O.
O 10 L
80
7-8
7-6
10 20 30
Time (h)
40 50
33
JP
•3
< 0
Control
JP
~o
X <
Control
10
JP
•3
>
+
10 20 30
Time(h)
[image:9.451.94.376.52.469.2]50
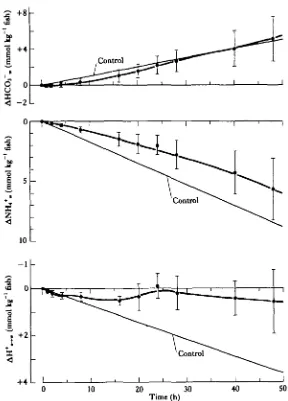
Fig. 4. Changes in water HCO3" and NH,+ concentrations during hypercapnia. The control line was determined over a 12-h period prior to the start of hypercapnig. In this and the following figures, the control line has been extended as a reference over the subsequent experimental periods. Cumulative H+ efflux ( A H+m) is calculated as the difference between the release of NH»+ and HCO3~ (x ± 3.E.,
N = 8 for control lines, N•= 6 for experimental points).
cumulative AH+ transfer measured at hour 20. AH+ efflux for the entire hypercapnic period averaged 0-15 ± 0-02mmolh"1 kg"1 (/V=6); well above the control rate of 0-07 ± 0-02 (TV = 8) (Table 1, Fig. 4).
When the environmental water was returned to normal (low CO2) aeration after hypercapnia, net HCO3~ loss increased to control rates within 2 h (Fig. 5). Ammonia efflux was immediately reduced from that measured during hypercapnia and averaged 0-09 ±0-03 mmolh"1 kg"1 (TV = 5) at the midpoint of the post-hypercapnic period
34
J. B. CLAIBORNE AND N. HEISLER£• +8
1 +4
$ 0
3 - 2
.Control
+ 4 L
[image:10.451.84.372.85.486.2]Time (h)
Fig. S. Changes in water HCO3 , NH^* and 4H+,-,« after return from environmental hypercapnia
to normocapnia (x ± s.E., N = 8 for control lines, N = 5 for experimental points). For further ex-planations see legend to Fig. 4.
rate is significantly (P< 0-02, N = 5) less than the control rate (Table 1).
Acid-base regulation and ion transfers in carp
35
T - 1
Sf
- 2
- 3 U L
10 20 30
Time (h)
[image:11.451.83.378.42.382.2]40 SO
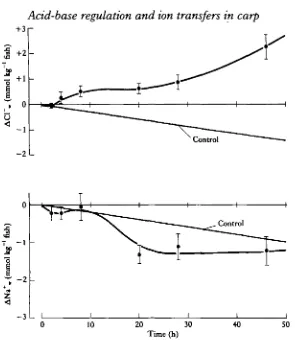
Fig. 6. Changes in water Cl~ and Na+ concentrations during the hypercapnic period (x± S.E., A' = 5
for control lines, N= 7 for experimental points).
D I S C U S S I O N
As reported in the Results, the low control plasma P02 measured in the experiment-al animexperiment-als prior to hypercapnia was very similar to the average vexperiment-alue observed in free-swimming fish acclimated to a large flow-through system for several months. Likewise, the low rates of ammonia and HCO3~ excretion observed in control animals (Table 1) represent a slight net H+ excretion which agrees with the results from other species (Heisler, 1982a). We believe that care in handling, preparation and the time allowed for the acclimation of the experimental animals is of the utmost importance. It is unfortunate that some studies have overlooked the necessity of allowing the fish to reach a true 'control', steady-state status; a level which must be attained before experimental results become meaningful.
Alteration in ambient Pco2 rapidly affected the acid-base status of the carp. At the onset of hypercapnia, plasma Pco2 was quickly elevated while plasma pH was depressed. Over the next 48 h, plasma [HCC>3~] slowly increased and partially com-pensated for the decline in pH. This type of response has been reported in several freshwater and seawater species, though some quantitative differences exist. The
36
J. B. CLAIBORNE AND N. HEISLER+ l r
<
2
-+2
+ 1
- 1 Control
10 20 30
Time (h)
[image:12.451.76.372.47.386.2]40 SO
Fig. 7. Changes in water Cl" and Na+ concentrations during the post-hypercapnic period, (x ± 3.E., A' = 5 for control lines, N = 7 for experimental points).
within 22 h (Eddy et al. 1977) or may require as long as 3 days (Janssen & Randall, 1975), this discrepancy perhaps being due to the different ion concentrations of the environmental water in these two studies (Heisler, 1982a). The freshwater catfish,
Ictalunis punctatus, requires about 24 h to compensate both the intracellular and
'Heisler, 1980). The short-term tolerance of a reduced extracellular pH in these animals (rather than an immediate and total compensatory response, presumably at the cost of additional metabolic energy consumption) might be interpreted as an adaptive advantage to a species which may encounter intermittent exposure to hyper-capnia in its natural environment.
Another explanation for the apparent lack of total compensation during the hyper-capnic period may be that the carp have approached a maximal threshold of plasma HCC>3~ which can be retained. In the aquatic salamander, Siren lacertina, plasma [HCC>3~] did not rise above about 25 mM during hypercapnia even though plasma pH was depressed by more than 0-3 pH units (Heisler, Forcht, Ultsch & Anderson,
1982). Increasing external [HCO3""] or infusion of HCC>3~ did not alter the final steady-state plasma [HCC>3~]. It was postulated that Siren was not able to adjust the maximal threshold of plasma [HCO3~] retention to a higher level. Recent evidence from our laboratory suggests that carp plasma [HCC>3~] also cannot be maintained above ~25 mM - even during a hypercapnic stress greater than the present study (5 % CO2) or following infusion of NaHCO3~ (Smmolkg"1) (J. B. Claiborne&N. Heisler,
unpublished results). Whether a maximal HCO3~ 'set-point' governs pH compensat-ory responses in the carp remains to be seen, but it is surely a point of interest to be pursued in future investigations.
When carp were returned to low CO2 aeration, plasma pH rose to normal levels within the first 30 min. This pH increase was caused by the initially rapid fall of plasma Pco2 within the same time period. As the Pco2 continued to decline slowly, plasma [HCO3~] was reciprocally reduced, allowing the extracellular pH to remain relatively constant for the remaining 47 h (Fig. 3). These animals did not exhibit the over-shoot of plasma pH (due to the rapid decrease in plasma Pc02 without a concurrent modula-tion of plasma [HCC>3~]) observed in Salmo gairdneri (Eddy et al. 1977) or the elasmobranch, Scyliorhinus stellaris (Heisler et al. 1976). This may be due to the moderate extent of plasma [HCO3~] adjustment attained by the carp (an increase of approximately 8 mM vs about 19 mM in the trout) during the 48-h hypercapnic period.
The acid-base response of Cyprinus during and after environmental hypercapnia is presented in a pH - [HCCh"] diagram in Fig. 8. From control values (point A), a minimal plasma pH value was recorded at hour 4 of hypercapnia (point B) due to a rapid increase in plasma Pco2 • During the remainder of this period, the plasma Pco2 essentially followed the 12TorrPco2 isopleth while an increase in [HCO3~] induced an elevation in plasma pH (points B—C). One hour after normal ambient CO2 levels were reinstated, pH had returned to control values due to a sharp drop in plasma Pco2 (point D). At the end of this period, all parameters were normal once again (point E). Qualitatively, this pattern of response is similar to that described for the trout (Janssen & Randall, 1975) or for the freshwater gar (Lepisostetis oculatus, Smatresk & Cameron, 1982), but, again the degree of compensation by accumulation of HCO3~ during hypercapnia is reduced in the carp.
The measurement of HCC>3~ and ammonia transfers (Figs 4, 5) permits a deeper understanding of the regulatory processes involved in the extracellular acid-base adjustments during ambient CO2 changes. The total H+ excretion (AH+e-»w) is
38
J. B. CLAIBORNE AND N. HEISLER30 r
-25
u 20
IS
Pco, (Torr)
10 L_
Fig. 8. pH - [HCO3 ] diagram depicting plasma acid-base changes during and after environmental hypercapnia. PcO2 isopleths were calculated using the Henderson-Hasselbalch equation with a and pK' values extrapolated from the data of Severinghaus (1965). Point A represents control values prior to hypercapnia. Points B and C show changes during hypercapnia, while D and E indicate post-hypercapnia measurements (x ± S.E., N= 7 for points A, B and C, A' = 6 for D and E). See text for details.
methods, the efflux of HCO3~ is not discernible from the uptake of H+ or the loss of OH~. Likewise, the differential determination of the amounts of NH3 and NH4"1" released to the ambient water is not possible since 99 % of all NH3 excreted by the fish wiH quickly be converted into the ionized form, NH4"1" (because the pK' for the NH3/NH4"1" equilibrium is about 9-6, Cameron & Heisler, 1983). When calculating net H+ transfer it is not necessary to know whether ammonia has been excreted as NH3 gas or NH4"1"; effectively all NH3 transferred will be immediately ionized, and therefore produce equimolar amounts of HCC>3~ which must be subtracted from the measured HCC>3~ efflux, while all ammonia excreted as NH4+ represents the loss of a proton and must be deducted from the net base excretion as well. It should also be noted that the cumulative and net transfers reported here represent 'whole body' fluxes of these ions. We found it very difficult to separate branchial and renal ion transfers (by the collection of urine through a urinary catheter) for the extent of the recovery, control, hypercapnic and post-hypercapnic periods without inducing stress in the experimental animals. Numerous reports have shown that transfers of acid-base and strong ions occur predominantly at the gills (see reviews by Evans, 19806; Heis-ler, 1980; also, Cameron, 1980; Evans, 1982). It is probable that the observed ion transfers in the present study are also mainly due to transbranchial fluxes.
the hypercapnic period; the net AH+ transferred from the animal into the water during this period was approximately 3-3 mmol kg"1 fish. If the extracellular space of
Cyprinus is of the order of 20% (e.g. Cameron, 1980; Heisler, 19826), then the
increased rate of H+ loss (or HCCb" gain) during hypercapnia can easily account for the increase in plasma [HCO3"]. In fact, the observed increase in HCCb" represents only about 50% of the net H+ transferred, indicating that additional HCO3" must have been sequestered intracellularly. This is not surprising since the initial pH depression and subsequent pH compensation of the intracellular compartment mir-rors the response of the extracellular space during hypercapnia (Heisler et al. 1976; Cameron, 1980). The net H+ excreted during this period was ~78 % as much as that reported for Conger conger (approximately 4-2 mmol kg"1 fish) (Toews et al. 1983). The fact that the marine teleost voided this quantity of H+ within 10h, as opposed to 46 h in the carp, may be an indication of the relative difference in compensation rates between freshwater and marine fish. The marine toadfish, Opsanus beta, has a net H+ excretion rate of about 0-5 mmol h"1 kg"1 measured after 3-5 h of hypercapnia (5 % CO2; calculated from Evans, 1982), a value which is more than six times greater than that of the carp. Likewise, the ureotelic elasmobranch Scyliorhinus stellaris also transfers H+ to the ambient water approximately six times faster than the carp during the first few hours of hypercapnic stress (Heisler et al. 1976). Marine teleost fish are known to exchange ions across the gills at a much higher turn-over rate than fresh-water species (see review by Evans, 19806). Since it has been shown that at least one seawater teleost excretes Cl~ branchially, in exchange for external HCC>3~ (Kormanik & Evans, 1979), and takes up external Na+ in exchange for serosal H+ (Evans, 1982), the cellular mechanisms required to compensate for hypercapnic acidosis may be immediately available to these fish. Though the rate of net H+ transfer is much slower, the present data indicate that the freshwater carp might also utilize a HCC>3~ uptake, as well as a net H+ loss, to regulate internal pH during hypercapnia. The discrepancy between the rates of net H+ transfer in the carp and the marine species reported above may well be due to the much greater availability of counter-exchange ions in the ambient seawater. Indeed, initial investigations from our laboratory indicate that when carp are adapted to an elevated ambient [NaHCCb] of 3 mM, the net rate of H+ transfer during hypercapnia is twice as great as that reported in the present study (J. B. Claiborne & N. Heisler, unpublished results).
40 J. B. CLAIBORNE AND N. HEISLER
fluxes, the rate of HCC>3~ transfer by the shark during post-hypercapnia was mucl faster than that exhibited by the carp in the present study - again, perhaps because of differences between seawater and freshwater ambient ion concentrations which are available for exchange.
The mechanisms governing the movements of H+, OH~, HCC>3~ and NH4"1" during acid-base adjustment in fish are more difficult to ascribe. Over the last few decades, several studies have implied that there is a linkage between acid-base and strong ion (mainly Na+ and Cl~) transfers. The efflux of HCC>3~ (or OH~) has been proposed to occur in exchange for external Cl" (Krogh, 1939; Maetz & Garcia-Romeu, 1964; Cameron, 1978), and the excretion of H+ and/or NH4"1" is thought to be linked to the uptake of ambient Na+ (Maetz, 1973; Evans, 1980a). These counter-transport mechanisms can be inhibited or even reversed when exposed to the proper gradients for the ions involved (Maetz & Garcia-Romeu, 1964; Evans, 1977). Cameron (1976)
+4
•+3
0
?+2t
Hypercapnia Post-hypercapnia
. + 1
• ¥ °
is-.
t §
2 3-2
.1
+2< g
t i
2 &
Z - 3
IS 30 45 0
Time (h)
[image:16.451.75.381.251.606.2]IS 30 45
showed that in the hypercapnic arctic grayling the ratio of net Na+ to Cl~ uptake was elevated above control levels. In the light of these results, the author proposed a key role for N a+/ H+ transfers during hypercapnic acidosis. In contrast, Perry et al. (1981) have recently hypothesized that hypercapnic pH compensation occurs in S.
gairdneri without the contribution of transbranchial or renal Na+/H+ (NH4+) or C1~/HCC>3~ exchanges. They also proposed that these exchanges, during hyper-capnia, were not limited by the low ambient NaCl levels in their experimental water. In the present experiments, net Cl~ uptake was reversed to a net excretion during hypercapnia. Net Na+ influx increased significantly for a portion of this period (Fig. 6). In fish returned to normocapnia, Cl~ excretion returned to a rate of net uptake similar to the control, while net Na+ influx became a net loss (Fig. 7). Clearly, transfers of both ions have been modified during the two experimental periods. When the 'net A' changes for C\~, HCC>3~, Na+ and N H / , (the difference between the experimental average for each collection period and the mean control amounts trans-ferred for that period) are compared (Fig. 9), a relationship between these transfers becomes apparent. Though we feel hesitant to make a quantitative comparison of flux rates, it would appear that HC03~ transfers are mirrored in a reciprocal fashion by Cl~ movements. Likewise, modifications in the direction of net ANa+ flux is cor-related with variation in ammonia excretion at least during the post-hypercapnic period. The difficulty in determining the ratio of NH3 to NH4+ transferred (as discussed above) makes a quantitative analysis more difficult. Cameron & Heisler (1983) have proposed that ammonia excretion from Salmo gairdneri under normal conditions can be attributed solely to the loss of ammonia by nonionic diffusion. Only when external ammonia gradients favour the inward diffusive movement of NH3 does Na+/NH4+ exchange become necessary. One can only speculate as to what form of ammonia is excreted by the carp during and after hypercapnia. If, as in the trout, a considerable percentage of the total ammonia efflux from the fish is due to non-ionic diffusion of NH3 to the water and its ionization to NH4"1", the concentration of ambient HC03~ will increase equimolarly. This effect might explain the apparent imbalance of Cl~ excretion and HC03~ uptake during hypercapnia (Fig. 9). Furthermore, H+ transferred out of the animal in exchange for Na+ could be hidden behind the loss and ionization of NH3 (Holeton et al. 1983). This may be the case between hours 8 and 20 of hypercapnia when the uptake of Na+ is increased six-fold without a correspond-ing elevation in ammonia efflux (Fig. 9).
42 J. B. CLAIBORNE AND N. HEISLER
would not seem energetically appropriate. Following hypercapnia, H+/Na+ ex-change is a more viable alternative.
The present data indicate that CP/HCCb" exchange occurs predominantly during hypercapnia, while Na+/H+ exchange takes place after hypercapnia; both mechan-isms allowing the animal to gain HCC>3~ or H+, but also transferring Cl~ and Na+ in the opposite direction from that usually proposed for freshwater teleosts (Heisler,
1980; Evans, 19806). It is important to note that because of the relative concentrations of these ions, only moderate changes in extracellular [Cl~] or [Na+] were required to elicit large acid-base effects. For example, during hypercapnia the Cl~ lost to the water represents ~ 15 % of the total extracellular Cl~ pool (a net loss of 3-5 mmol kg"1 fish over 46 h as compared to a control plasma [Cl~] of ~114mM; Ultschef aV. 1981), while net HCC>3~ taken up from the media increased by about 115 % (3-3 mmol kg"1 fish) and plasma [HCO3~] was elevated by ~ 5 5 % . In order to maintain osmotic balance, it is likely that Cl~ and Na+ lost during the experimental periods would be regained after the acid-base stress had passed.
CONCLUSION
Acid-base regulation during and after respiratory acidosis in the carp is similar to that of other species, although the time course of plasma [HCO3~] adjustment is longer. Serosal pH is compensated by 50% during a 48-h hypercapnic exposure. Regulation of plasma pH is linked to the modulation of HCC>3~ and H+ transfers between the fish and the environment. Hypercapnia induces an increase in intracellular and extracellular [HCC>3~] due to an enhancement of C1~/HCO3~ and N a+/ H+ exchange. Following hypercapnia, plasma [HCCb"] is decreased by the uptake of H+ from the water via Na+/H+ transport. These transfers compensate internal pH when acid-base balance has been perturbed.
The authors gratefully acknowledge the skilful technical assistance of Mr G. Forcht and Mrs S. Glage. This research was supported by the Deutsche Forschungsgemein-schaft.
R E F E R E N C E S
CAMERON, J. N. (1976). Branchial ion uptake in arctic grayling: resting values and effects of acid-base distur-bances. 7. exp. Biol. 64, 711-725.
CAMERON, J. N. (1978). Regulation of blood pH in teleost fish. Respir. Phyiiol. 33, 129-144.
CAMERON, J. N. (1980).- Body fluid pools, kidney function, and acid-base regulation in the freshwater catfish
Ictaluruspunctatus. J. exp. Biol. 86, 171-185.
CAMERON, J. N. & HEISLER, N. (1983). Studies of ammonia in the rainbow trout: physio-chemical parameters, acid-base behaviour and respiratory clearance. J. exp. Biol. 105, 107—125.
CLAIBORNE, J. B., EVANS, D. H. & GOLDSTEIN, L. (1982). Fish branchial N a+/ N H
4+ exchange is via
basolateral Na+-K+-activated ATPase. J. exp. Biol. 96, 431-434.
CLAIBORNE, J. B. & HEISLER, N. (1983). A minicomputer program for rapid graphical and statistical analysis of laboratory data. Int.J. Bio-Med. Comput. (in press).
DERENZIS, G. & MAETZ, J. (1973). Studies on the mechanisms of the chloride absorption by the goldfish gill: relation with acid-base regulation. J . exp. Biol. 59, 339-358.
EDDY, F. B., LOMHOLT, J. P., WEBER, R. E. & JOHANSEN, K. (1977). Blood respiratory properties of rainbow trout (Salmo gaxrdneri) kept in water of high CO2 tension. J. exp. Biol. 67, 37—47. A EVANS, D. H. (1977). Further evidence for Na/NH4 exchange in marine teleost fish. J . exp. Biol. 70, 213-22(j|
EVANS, D. H. (19806). Osmotic and ionic regulation by freshwater and marine fishes. In Environmental
Physiology of Fishes, (ed. M. A. Ali), pp. 93-122. New York: Plenum.
EVANS, D. H. (1982). Mechanisms of acid extrusion by two marine fishes: the teleost, Opsanus beta, and the elasmobranch, Squalus acanthius.J. exp. Biol. 97, 289-299.
HEISLER, N. (1978). Bicarbonate exchange between body compartments after changes of temperature in the larger spotted dogfish (Scyliorhinus stellaris). Respir. Physiol. 33, 145-160.
HEISLER, N. (1980). Regulation of the acid-base status in fish. In Environmental Physiology of Fishes, (ed. M. A. Ali), pp. 123-162. New York: Plenum.
HEISLER, N. (1982a). Transepithelial ion transfer processes as mechanisms for fish acid-base regulation in hypercapnia and lactacidosis. Can.J. Physiol. 60, 1108-1122.
HEISLER, N. (19826). Intracellular and extracellular acid-base regulation in the tropical fresh-water teleost fish
Synbranchut marmoratus in response to the transition from water breathing to air breathing. J. exp. Biol. 99,
9-28.
HEISLER, N., WEITZ, H. & WEITZ, A. M. (1976). Hypercapnia and resultant bicarbonate transfer processes in an elasmobranch fish (Scyliorhinus stellans). Bull. Europ. Physiopathol. Respir. Yl, 77—85.
HEISLER, N., FORCHT, G., ULTSCH, G. R. & ANDERSON, J. F. (1982). Acid-base regulation in response to environmental hypercapnia in two aquatic salamanders, Siren lacertina and Amphiuma means. Respir.
Physiol. 49, 141-158.
HOLETON, G. F., NEUMANN, P. & HEISLER, N. (1983). Branchial ion exchange and acid-base regulation after strenuous exercise in rainbow trout (Salmo gairdneri). Respir. Physiol. 51, 303-318.
JANSSEN, R. G. & RANDALL, D. J. (1975). The effect of changes in pH and Pco2 in blood and water on breathing in rainbow trout, Salmogairdneri. Respir. Physiol. 25, 235-245.
KORMANIK, G. A. & EVANS, D. H. (1979). HCQT stimulated Cl~ efflux in the Gulf toadfish acclimated to seawater.y. exp. Zool. 208, 13-16.
KROCH, A. (1939). Osmotic Regulation in Aquatic Animals. Cambridge: Cambridge University Press. LLOYD, R. & WHITE, W. R. (1967). Effect of high concentrations of carbon dioxide on the ionic composition
of rainbow trout blood. Nature, Land. 216, 1341-1342. MAETZ, J. (1973). N a+/ N H
4+, N a+/ H+ exchanges and NH3 movement across the gill of Carassius auratus.
J. exp. Biol. 58, 255-275.
MAETZ, J. & GARCIA-ROMEU, F. (1964). The mechanism of sodium and chloride uptake by the gills of a fresh-water fish Carassius auratus. II. Evidence for N H ,+/ N a+ and HCOj~/Cl~ exchange. J. gen. Physiol. 47,
1209-1226.
PERRY, S. F., HASWELL, M. S., RANDALL, D. J. & FAKRZLL, A. P. (1981). Branchial ionic uptake and acid-base regulation in the rainbow trout, Salmo gairdneri. J. exp. Biol. 92, 289-303.
SEVERINGHAUS, J. (1965). Blood gas concentrations. In Handbook of Physiology, Section 3, Respiration, pp. 1475-1487. Washington, D.C.: American Physiological Society.
SMATRESK, N. J. & CAMERON, J. N. (1982). Respiration and acid-base physiology of the spotted gar, a bimodal breather. II. Responses to temperature change and hypercapnia. J. exp. Biol. 96, 281—294.
SOIVIO A., NYHOLM, K. & WESTMAN, K. (1975). A technique for repeated sampling of the blood of individual resting fish.J. exp. Biol. 63, 207-217.
SOIVIO, A., WESTMAN, K. & NYHOLM, K. (1972). Improved method of dorsal aorta catheterization: haematological effects followed for three weeks in rainbow trout (Salmo gairdneri). Finnish Fish. Res. 1, 11-21.
TOEWS, D. P., HOLETON, G. F. &HEISLER, N. (1983). Regulation of the acid-base status during environmental hypercapnia in the marine teleost fish Conger conger. J. exp. Biol. 107, 9—20.


![Fig. 2. Plasma Pcoj , [HCO3 ] and pH in dorsal aortic blood following the onset of environmentalhypcrcapnia (x ± s.E.,A' = 7)](https://thumb-us.123doks.com/thumbv2/123dok_us/1182058.641075/7.451.74.387.60.496/plasma-pcoj-dorsal-aortic-blood-following-onset-environmentalhypcrcapnia.webp)