Oxygen regulates the activity of ion-transport pathways in the membrane of several cell types. On the basis of the available data, it appears that, in excitable cells such as myocytes (see Dart and Standen, 1995; Franco-Obregón and López-Barneo, 1996; Ju et al. 1996; Kourie, 1997) and carotid body chemoreceptor cells (López-Barneo et al. 1988), oxygen affects mainly ion channel function, whereas in erythrocytes, oxygen affects either Na+/H+exchange (Motais et al. 1987; Salama and Nikinmaa, 1988; Roig et al. 1997) or K+/Cl− cotransport (Jensen, 1990; Borgese et al. 1991; Nielsen et al. 1992).
Lamprey (Lampetra fluviatilis) erythrocytes differ markedly in their ion-transport properties from other erythrocytes. Lamprey red cells maintain, in the absence of significant anion-exchange activity (Ohnishi and Asai, 1985; Nikinmaa and Railo, 1987), a high intracellular pH by means of Na+/H+ exchange (Nikinmaa, 1986; Nikinmaa et al. 1986; Tufts, 1992). In contrast to the erythrocytes of other fish, in which K+/Cl− cotransport appears to be the major dissipative pathway for K+ (e.g. Cossins and Gibson, 1997), the majority of the ouabain-insensitive K+ transport across the cell membrane in isotonic conditions occurs via an inwardly rectifying K+channel (Kirk, 1991a; Gusev et al. 1992; Virkki and Nikinmaa, 1996). Regulatory volume decrease after hypo-osmotic swelling occurs via conductive pathways for K+and Cl−(Nikinmaa et al. 1993; Virkki and Nikinmaa, 1995; L. V. Virkki and M.
Nikinmaa, unpublished data). Cl−-dependent K+ transport in lamprey erythrocytes has been observed only after treatment with the sulphydryl reagent N-ethylmaleimide (Kirk, 1991b).
The function of lamprey haemoglobin is also different from that in other vertebrates. Lamprey haemoglobins do not form stable tetramers, but are in monomer/oligomer equilibrium within intact erythrocytes (for a review, see Nikinmaa et al. 1995). This fact enabled us to study whether conformational changes of (tetrameric) haemoglobin are required for the effect of oxygen on erythrocytic ion transport. It has been suggested previously that the effect of oxygen on Na+/H+ exchange in teleost fish is mediated via an oxy–deoxy conformational change in haemoglobin (e.g. Motais et al. 1987; Salama and Nikinmaa, 1988). Furthermore, the presence of both channels and exchangers on the lamprey erythrocyte membrane enabled us to study whether both types of transport pathway are subjected to regulation by oxygen tension in the same cell type. In addition, we have evaluated the role of oxygen level in the pH and volume regulatory behaviour of lamprey erythrocytes.
Materials and methods
River lampreys (Lampetra fluviatilis (L.), mass 25–100 g) were caught from the Aurajoki and Kymijoki rivers in Finland during their spawning run and maintained in laboratory Printed in Great Britain © The Company of Biologists Limited 1998
JEB1342
We have measured the effects of oxygen tension on the transport of Na+, K+ and Cl− across the erythrocyte membrane of the lamprey Lampetra fluviatilis. The transport of each ion was affected by the oxygen tension of the medium. Hypoxic conditions (PO∑∑2 kPa) caused an increase in the acidification-induced influx of Na+ via Na+/H+ exchange. The influx of K+was only slightly affected by the oxygenation of the medium. In contrast, the basal K+efflux, measured using the radioactive isotope 43K, was markedly reduced by decreasing the oxygen tension of the medium, whereas the K+flux in hypotonic medium was not affected. Only minor effects of hypoxic conditions on the influx of Cl−
were observed in either isotonic or hypotonic conditions (there was a tendency for the isotonic influx to increase) or on the efflux in isotonic conditions. However, deoxygenation caused a marked reduction in the Cl− efflux in hypotonic conditions. The results show that oxygen tension has a marked effect on the pH and volume regulatory transport pathways of lamprey erythrocytes. For K+ and Cl−, the regulation appears to be asymmetric, i.e. influx and efflux are affected differently.
Key words: ion transport, oxygen tension, regulatory volume decrease, lamprey, Lampetra fluviatilis, erythrocyte, K+, Na+, Cl−.
Summary
Introduction
REGULATION OF ION TRANSPORT ACROSS LAMPREY (LAMPETRA FLUVIATILIS)
ERYTHROCYTE MEMBRANE BY OXYGEN TENSION
LEILA V. VIRKKI1,*, ANNIKA SALAMA1 ANDMIKKO NIKINMAA2
1Department of Biosciences, Division of Animal Physiology, PO Box 17, FIN-00014 University of Helsinki, Finland
and 2Department of Biology, FIN-20014 University of Turku, Finland
*Present address: Department of Cellular and Molecular Biology, Yale University School of Medicine, 333 Cedar Street, New Haven, CT 06510, USA (e-mail: leila.virkki@quickmail.yale.edu)
conditions (dechlorinated tap water, 10–15 °C) for a minimum of 2 weeks before experimentation. Blood samples were taken by dorsal puncture from anaesthethized lampreys (MS-222, 1 g l−1, buffered with NaHCO
3) into heparinized syringes. Red
cells and plasma were separated by centrifugation, and the red cells were washed twice with the saline used in the experiments. Blood from 2–5 animals was pooled. The composition of the saline was 110 mmol l−1NaCl, 5 mmol l−1
KCl, 1 mmol l−1 MgCl
2, 0.5 mmol l−1 CaCl2, 20 mmol l−1
Hepes, 1 g l−1 glucose, 1 g l−1 sodium pyruvate (pH 7.5). In
experiments in which different oxygen tensions were used, 10 mmol l−1NaHCO
3 was substituted for 10 mmol l−1 Hepes
and the saline was gassed with a mixture containing 1 % CO2
and the desired oxygen tension. The cells were resuspended in the saline used in the experiment and incubated in a shaking tonometer. Different gas mixtures were obtained using Wösthoff (Bochum, Germany) gas-mixing pumps or a Cameron (Cameron Instrument, Port Aransas, TX, USA) gas-mixing flow meter. Hypotonic solutions were obtained by adding 0.5 vol of water (or 10 mmol l−1NaHCO
3solution in
the case of CO2/HCO3-buffered saline) to the medium. All
experiments were carried out at room temperature (20 °C).
Chemicals
Ouabain and amiloride were from Sigma Chemicals, St Louis, MO, USA. 5,5-Dimethyl[2-14C]oxazolidine-2,4-dione (DMO), 22Na and 36Cl (as NaCl) were purchased from Amersham
International plc, UK. 43K (carrier-free) was produced by the
cyclotron unit of Åbo Akademi University in Turku, Finland.
Effect of oxygenation on red cell volume, net ion transport and pH after intracellular acidification
In the first set of experiments, the effect of oxygenation on the activity of the Na+/H+exchanger of lamprey erythrocytes
after intracellular acidification was studied. Two different gas mixtures were used: 99 % air, 1 % CO2 (normoxia; oxygen
tension 21 kPa) and 10 % air, 89 % N2, 1 % CO2 (hypoxia;
oxygen tension 2 kPa). Intracellular acidification was induced by isotonic addition of sodium propionate to the incubation (sodium propionate was substituted for NaCl in the above saline; for details, see Virkki and Nikinmaa, 1994). The uncharged form of the acid enters the cell and dissociates in the intracellular compartment, imposing an intracellular proton load (see Roos and Boron, 1981). The Na+/H+ exchange
activity was followed by measuring the water and ion content and intra- and extracellular pH of the cells.
The experiments were started by incubating a red cell suspension (2–4 ml, haematocrit 20–25 %) under the desired atmosphere (normoxia or hypoxia) in a shaking tonometer in NaHCO3-containing saline for 30 min. For measurements of
intracellular pH, 10µl of 14C-labelled DMO (0.37 MBq ml−1)
was added to the suspension at the onset of the incubation. A sample was taken before propionate (10, 20 or 40 mmol l−1, final
concentrations) was added iso-osmotically to the incubation, and subsequent samples were taken 1, 5, 15, 30 and 60 min after the addition of propionate. Immediately after sampling, the
extracellular pH was measured using a Radiometer BMS3 Mk2 and PHM 73 apparatus. The red cells and the medium were then separated by centrifugation in two Eppendorf tubes (2 min, 20 000 g). The supernatants were carefully removed and used for extracellular ion (and DMO) determinations. The two pellets of red cells were used for determinations of red cell water and ion contents and the radioactivity of DMO. The red cell water content was determined by weighing, drying (80 °C, 24 h) and reweighing one cell pellet. The other cell pellet and 100µl of supernatant were deproteinized in 300µl of 0.6 mol l−1
perchloric acid. Sodium and potassium contents were measured using a flame photometer (Radiometer FLM3, Copenhagen), and Cl− content was measured using a coulometric chloride titrator (Radiometer CMT 10, Copenhagen).
The intracellular pH (pHi) was determined from the extracellular pH and from the distribution of the radioactively labelled weak acid DMO across the cell membrane, as described by Nikinmaa and Huestis (1984), using the formula:
The samples were analyzed for [14C]DMO using a liquid
scintillation counter (LKB Wallac 1211 Minibeta). The pK value for DMO at 20 °C was taken to be 6.19.
Measurement of unidirectional Na+flux
The effects of intracellular acidification on the unidirectional influx of Na+ into lamprey erythrocytes in normoxic (P
O∑ 21 kPa) and hypoxic (PO∑ 2 kPa) conditions were measured
using radioactive 22Na as a tracer. 22Na influx was measured in the presence and absence of amiloride (1 mmol l−1, final concentration) in control and propionate-treated cells (20 mmol l−1final concentration). All 22Na flux measurements were carried out in the presence of ouabain (10−4mol l−1).
The experiment was started by pre-equilibrating a cell suspension under the desired atmosphere for 30 min. Ouabain (10−4mol l−1final concentration) and amiloride (or DMSO in the controls) was added 10 min before the end of the pre-equilibration period. The flux measurement was started by adding 0.2 vol of gassed saline (control) or 80 mmol l−1sodium propionate solution (to induce acidification; final propionate concentration 20 mmol l−1) containing 22Na (3.7 kBq ml−1; final concentration). Samples were taken at 1 and 10 min (propionate treatment without amiloride) or at 1 and 15 min (all other groups). The sample was immediately centrifuged through 0.4 ml of dibutyl phthalate. The supernatant was carefully sampled, and the remaining supernatant and the oil were removed by aspiration. The radioactivity of the cell pellet and the supernatant were measured using a gamma-counter. Unidirectional Na+ influx was calculated using the same formula as for unidirectional Cl−and K+influx (see below).
Measurement of unidirectional K+and Cl−flux
In the second set of experiments, unidirectional influx and efflux of K+and Cl−from lamprey erythrocytes were measured
(1)
[DMO]i
[DMO]e
pHi = pKDMO+ log (10pHe−pKDMO+1) .
using radioactive 43K or 36Cl as tracers. All 43K flux
measurements were carried out in the presence of ouabain (10−4mol l−1). In the 43K experiments, unidirectional influx and
efflux were measured in isotonic (288 mosmol l−1) and hypotonic
(192 mosmol l−1; calculated from the molar concentration of salts
in the saline) solutions in normoxic (PO∑21 kPa) and hypoxic
(PO∑2 kPa) conditions. The measurements were carried out in
NaHCO3-containing salines gassed with a mixture containing
1 % CO2. In addition, in one set of experiments, unidirectional
K+ efflux in isotonic conditions was measured using oxygen
tensions of 2, 6, 21 or 61 kPa. These oxygen tensions were obtained by mixing 1 % CO2 with 2, 6, 21 or 60 % oxygen,
respectively, made up to a total of 100 % using nitrogen gas. Measurements of 36Cl influx and efflux were carried out
either in saline buffered with 20 mmol l−1 Hepes only or in
saline buffered with 10 mmol l−1 NaHCO
3 and 10 mmol l−1
Hepes and gassed with 1 % CO2. To study the effects of
oxygenation on 36Cl influx and efflux in isotonic and hypotonic
salines, measurements were carried out in normoxic (PO∑
21 kPa) and hypoxic (PO∑ 2 kPa) conditions using salines
gassed with 1 % CO2, as described above. In addition, the
effects of removing extracellular Cl−on 36Cl efflux in isotonic
and hypotonic salines were studied using saline buffered with Hepes only and in saline buffered with glucuronate substituted for Cl−. The composition of this saline was: sodium glucuronate 110 mmol l−1, potassium glucuronate 5 mmol l−1,
MgSO4 1 mmol l−1, CaCO3 0.5 mmol l−1, Hepes 20 mmol l−1,
glucose 15 mmol l−1, pH 7.5.
In the K+and Cl−efflux experiments, washed red cells were
loaded with 18–37 kBq ml−1of 43K or 36Cl for 1–2 h (K+) or 2–3 h
(Cl−) in normoxic conditions in a shaking tonometer. For each treatment, a sample was removed and incubated under the appropriate atmosphere for 30 min. In the K+efflux experiments,
ouabain (final concentration 10−4mol l−1) was added 5 min before
the end of the preincubation period. Subsequently, the cells were rapidly washed twice (to reduce the amount of extracellular label) with isotonic (ouabain-containing for K+ efflux) saline, which
had been equilibrated with the same gas mixture. The cells were suspended at a low haematocrit (5 %). To induce cell swelling, 0.5 vol of gassed 10 mmol l−1NaHCO
3solution (or only water in
the case of Hepes-buffered saline) was added. The control incubation received 0.5 vol of saline. Two samples were taken, one at 2 min and the other at 20–25 min (K+efflux experiment)
or at 2 and 10–15 min (Cl−efflux experiment). It had previously been established that the efflux remained linear for at least 30 and 20 min, respectively. Cells and medium were immediately separated by centrifugation (2 min at 20 000 g). The cell pellet was deproteinized with 0.6 mol l−1HClO
4and counted using a
liquid scintillation counter.
One set of 36Cl efflux experiments was carried out to
investigate whether the duration of incubation in hypoxic conditions affects the magnitude of the Cl−efflux in hypotonic conditions. In this experiment, a red cell suspension (in isotonic saline containing 36Cl) was first incubated using a normoxic gas
tension. After a 30 min equilibration period, a sample was removed for measurement of 36Cl efflux. The sample was
treated as outlined above for measurement of 36Cl efflux. The
sample was washed twice and suspended at a low haematocrit. After the addition of 0.5 vol of 10 mmol l−1NaHCO
3solution
(to cause cell swelling), samples were removed at 2 and 10 min and centrifuged immediately. The measurement was carried out in hypotonic solutions to increase the magnitude of Cl−efflux, and the suspensions were gassed with the same gas mixture as the original cell suspension. The gassing of the original cell suspension was then switched to a hypoxic (PO∑2 kPa) mixture.
After a 5 min incubation period, the colour of the suspension had darkened to indicate deoxygenation of the haemoglobin, and a sample was removed for measurement of 36Cl efflux
(again in hypotonic saline). Subsequent samples were then removed at 15, 33 and 50 min for measurement of 36Cl efflux.
After the last sample had been taken, the gassing was switched to a normoxic mixture and, after incubation for further periods of 5 and 35 min, samples were removed for measurement of
36Cl efflux. The oxygen content of the cell suspensions during
each 36Cl efflux measurement was determined using the method
of Tucker (1967).
Rate constants (k) for unidirectional 36Cl efflux were
calulated using the formula:
k = (logeA1−logeA2)/t (2)
and for unidirectional 43K efflux using the formula:
k = [loge(A1−A∞) −loge(A2−A∞)]/t , (3)
where A1and A2are the amounts of label (per kilogram dry
cell mass) present in the cells at times t1and t2, respectively, A∞ is the amount of label in the cells at equilibrium (per kilogram dry cell mass) and t is the incubation time (t2−t1). A∞
was calculated from the initial amount of 43K present in the
cells, the amount of unlabelled isotope present in the intracellular and extracellular compartments (assuming that, at equilibrium, the radioactive and unlabelled isotope distribute similarily) and the haematocrit in the experiments. For the 36Cl
efflux experiments, the calculation of A∞ was not necessary since, at equilibrium, A∞≈0.
The amount of label was calculated per dry cell mass, since this measure is insensitive to changes in cell volume. Cell water was measured in separate experiments using similar treatments as in the flux measurements.
For the K+and Cl−influx experiments, a cell suspension was
pre-equilibrated under the desired atmosphere for 30 min. For the K+ influx experiments, ouabain (10−4mol l−1 final
concentration) was added 10 min before the end of the pre-equilibration. The flux measurement was started by adding 0.5 vol of gassed saline (control) or 10 mmol l−1 NaHCO
3
solution (to cause cell swelling) containing 43K (4–8 kBq) or 36Cl (11–19 kBq; final concentrations). Samples were taken at
1 and 6 min (K+) or at 2 and 15 min (Cl−) and treated as above.
Rate constants (k) for unidirectional influx were calculated using the formula:
k = (A2 −A1)/Aet , (4)
water) present in the cells at times t1and t2, respectively, Aeis
the amount of label per litre of extracellular solution and t is the incubation time (t2−t1). The values were corrected for the
change in cell volume occurring during regulatory volume decrease. It had previously been shown that the influx remained linear for up to 10 min in the case of K+ influx and
at least 20 min in the case of Cl− influx in isotonic and hypotonic solutions.
Fluxes were calculated from the rate constants. For influx, the rate constant was multiplied by the concentration of unlabelled isotope in the extracellular compartment, and the fluxes were subsequently calculated per dry cell mass. For efflux, the rate constant was multiplied by the amount of unlabelled isotope in the cells (per kilogram dry cell mass).
The effect of oxygenation on volume recovery, pH and ion content after cell swelling
In the third set of experiments, the effect of oxygenation on the volume recovery of lamprey erythrocytes after osmotic swelling was investigated. Cell swelling was induced by decreasing the osmolarity of the medium as in the experiments for measuring unidirectional fluxes, i.e. by addition of 0.5 vol of 10 mmol l−1 NaHCO
3solution (an osmolarity decrease of
approximately 35 %). Cell water, ion content and intra- and extracellular pH were measured. Incubations were carried out in normoxic (PO∑21 kPa) and hypoxic (PO∑2 kPa) conditions
using gassing with 1 % CO2as described above.
The experiments were started by incubating a red cell suspension (2–4 ml, haematocrit 20–25 %) in a shaking tonometer in the appropriate saline and the desired atmosphere for 30 min. For measurements of intracellular pH, 10µl of 14
C-labelled DMO (0.37 MBq ml−1) was added to the medium at
the onset of the incubation. A sample was taken before the osmolarity of the incubation medium was decreased, and subsequent samples were taken at 1, 10, 30, 60 and 120 min. The samples were treated as outlined above for the measurement of Na+/H+exchange activity.
In the Results, the ion contents are given in mmol kg−1dry cell mass and water content as percentage water
per wet mass. Values in the text and figures are given as means ±S.E.M. Statistical analyses of the data were carried out using the least squares difference (LSD) test (within-subject design) of the analysis of variance (ANOVA)/multiple analysis of variance (MANOVA) module of Statistica Software (StatSoft Inc, Tulsa, OK, USA) or using Statistix.
Results
Effect of oxygenation on Na+/H+exchange activity induced by
intracellular acidification
The intracellular pH of lamprey erythrocytes incubated in hypoxic conditions was higher (7.758±0.019, N=15) than that of erythrocytes incubated in normoxic conditions (7.564±0.022, N=15), a difference of 0.19 pH units (Fig. 1).
This oxygenation-linked effect on intracellular pH is the result of the binding of protons to haemoglobin upon deoxygenation
(the Haldane effect). The mechanism has been described in previous studies (Nikinmaa and Mattsoff, 1992; Nikinmaa, 1993).
The addition of propionate (10, 20 or 40 mmol l−1)
significantly decreased the intracellular pH of lamprey erythrocytes at all concentrations of propionate used. The magnitude of the acidification was proportional to the amount of propionate added (Fig. 1; Table 1). The change in pHi values caused by propionate was calculated from the 0 min and 1 min samples in all treatment groups, although the maximal (apparent) acidification was not reached until after the 1 min time point in some groups because of slow equilibration of acid (either propionate or DMO). Significant recovery of intracellular pH was observed only with the 20 and 40 mmol l−1
propionate treatments. The drop in intracellular pH tended to be slightly larger in the hypoxic groups using 20 and
0 20 40 60 7.4
7.6 7.8 8.0
0 20 40 60 7.4
7.6 7.8 8.0
7.4 7.6 7.8 8.0
Intracellular pH
Time (min)
*
*
*
*
*
*
*
*
*
*
AB
C
[image:4.609.334.531.71.440.2]0 20 40 60
Fig. 1. Intracellular pH of lamprey erythrocytes incubated in normoxic (open symbols; PO∑ 21 kPa) and hypoxic (filled symbols;
PO∑ 2 kPa) conditions. At time zero, the cells were acidified by
isomolar addition of 10 mmol l−1(A), 20 mmol l−1(B) or 40 mmol l−1
40 mmol l−1 propionate for acidification, when calculated as
pH units (the difference was statistically significant only for the 40 mmol l−1 propionate treatment). However, when
calculated as an increase in intracellular [H+], the differences
are not statistically significant (although the increase tended to be larger in the normoxic group; Table 1).
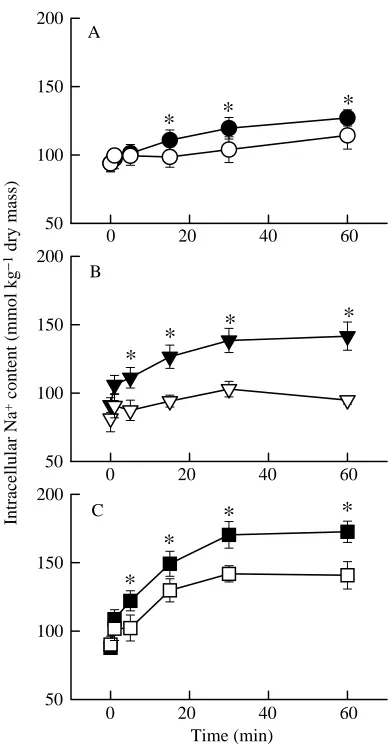
Intracellular acidification caused an increase in unidirectional Na+ influx (see Fig. 4) and a consequent
increase in intracellular Na+content (Fig. 2) and cell swelling
(cell water content) (Fig. 3). It has previously been shown that intracellular acidification activates Na+/H+ exchange in
lamprey erythrocytes (Virkki and Nikinmaa, 1994). Unidirectional Na+ influx was larger in hypoxic cells,
compared with normoxic cells, both in control cells and in cells acidified with 20 mmol l−1 propionate. The increase in Na+
influx was completely inhibited by 1 mmol l−1amiloride in all
treatment groups (Fig. 4). For every propionate concentration used, the increases in intracellular Na+and water content were
significantly larger in the hypoxic groups than in the normoxic groups. Since the intracellular acid load was similar (or slightly larger) in the normoxic group to that in the hypoxic group, the results show that the difference in Na+accumulation and cell
swelling between the normoxic and hypoxic groups is caused by an increase in the acidification-induced activity of Na+/H+
exchange in hypoxic conditions.
Effect of oxygenation on unidirectional K+flux
Unidirectional K+ efflux was significantly decreased in
lamprey red cells incubated in hypoxic conditions, compared with normoxic conditions, but only when incubated in isotonic saline (Fig. 5A). When the erythrocytes were subjected to osmotic swelling by decreasing the osmolarity of the medium, no significant changes in efflux rates were observed between the normoxic and hypoxic groups.
In the case of unidirectional K+ influx (Fig. 5B), hypoxic
treatment caused a small but significant decrease in the flux
rate in red cells incubated in isotonic saline. In cells subjected to cell swelling, no significant changes in K+ influx were
observed between cells incubated in normoxic and hypoxic conditions.
Osmotically induced cell swelling in normoxic conditions did not significantly affect the K+ efflux rate compared with
that of cells incubated in isotonic saline. This result agrees with our earlier findings that unidirectional K+efflux from lamprey
red cells was not increased by cell swelling when the osmolarity of the medium was decreased by approximately 35 % (Virkki and Nikinmaa, 1995). It has, however, been shown that different pathways for K+transport operate in cells
[image:5.609.345.541.70.442.2]of normal volume and in cells subjected to osmotic swelling, a result confirmed by recent patch-clamp data (L. V. Virkki and M. Nikinmaa, unpublished data). Thus, the data obtained in the present study show that only the K+transport pathway
Table 1. Change in intracellular pH and proton concentration
induced by the addition of propionate to the incubation medium in lamprey erythrocytes incubated in normoxic
(PO221 kPa) and hypoxic (PO22 kPa) conditions
[image:5.609.45.300.126.202.2][H+] difference
[Propionate] pH difference Normoxic Hypoxic
(mmol l−1) Normoxic Hypoxic (nmol l−1) (nmol l−1)
10 0.071±0.030 0.034±0.015 4.4±1.8 1.3±0.88
20 0.11±0.021 0.14±0.023 7.8±1.2 6.2±0.93
40 0.18±0.032 0.25±0.018* 14.7±2.7 13.1±1.13
The change is calculated as the difference in pH units and as the change in the concentration of H+in the erythrocytes after a 1 min
incubation.
An asterisk indicates a statistically significant difference (P<0.05) between normoxic and hypoxic conditions at the same propionate concentration.
Values are means ±S.E.M., N=5.
0 20 40 60 50
100 150 200
Intracellular Na
+ content (mmol kg
−
1 dry mass)
50 100 150 200
Time (min) 50
100 150 200
*
*
*
*
*
*
A
B
C
*
*
*
*
*
0 20 40 60
0 20 40 60
Fig. 2. Intracellular Na+content of lamprey erythrocytes incubated in
normoxic (open symbols; PO∑21 kPa) and hypoxic (filled symbols;
PO∑ 2 kPa) conditions. At time zero, the cells were acidified by
isomolar addition of 10 mmol l−1(A), 20 mmol l−1(B) or 40 mmol l−1
operating in cells of normal volume is sensitive to the oxygen tension. Also, the oxygen sensitivity is asymmetrical: K+efflux
is strongly decreased by lowering the oxygen tension, whereas K+influx is hardly affected.
For the different oxygen tensions studied, K+efflux rate was
maximal at atmospheric oxygen tension and was significantly reduced at both hypoxic oxygen tensions used in this experiment (2 and 6 kPa) and at hyperoxic oxygen tension (61 kPa; Fig. 6). There was also a tendency for the efflux rate to increase when the oxygen tension was increased from 2 to 6 kPa, but the difference was not statistically significant. Thus, it appears that the activity of the K+efflux pathway is maximal
at atmospheric oxygen tension and is also reduced in hyperoxia.
Effect of oxygenation on unidirectional Cl−flux
Hypotonically induced cell swelling of lamprey erythrocytes
caused an increase in both unidirectional Cl−efflux and influx rates (Fig. 7A,B). When the oxygen tension of the incubation was decreased, the swelling-induced increase in unidirectional Cl− efflux was virtually abolished (Fig. 7A). In contrast, the rate of swelling-induced Cl− influx was not significantly affected (Fig. 7B). However, the Cl− efflux rate in cells incubated in isotonic saline was not affected by a decrease in the oxygen tension, whereas the influx rate was increased. Thus, the Cl−transport system also shows asymmetry in terms of oxygen sensitivity.
Substitution of extracellular Cl−with glucuronate resulted in a marked increase in the rate of unidirectional Cl−efflux in red cells subjected to osmotic swelling (Fig. 8). In cells of normal volume, however, the Cl− efflux rate did not increase but instead tended to decrease, although the change was not statistically significant. This result agrees with earlier results by Bogdanova et al. (1998), who observed a significant decrease in unidirectional Cl−efflux rates in cells incubated in isotonic saline when extracellular Cl− was removed. These results show that distinct Cl−efflux pathways operate in cells with normal volume and in swollen cells.
The effect of oxygen on Cl− efflux from swollen cells is closely coupled to the oxygen content of the cells (Fig. 9). The decrease in Cl− efflux upon deoxygenation occurred simultaneously with the decrease in oxygen content of the cell
0 20 40 60 68
70 72 74
68 70 72 74
68 70 72 74
Cell water content (%)
Time (min)
*
*
*
*
*
*
*
*
*
AB
C
0 20 40 60
0 20 40 60
0 25 50 75 100 125
Rate of Na
+ influx (mmol kg
−
1 cells h
−
1)
Control Propionate+am
iloride Propionate
Amilor
ide
*
†*
† [image:6.609.74.262.295.658.2]*
Fig. 3. Cell water content of lamprey erythrocytes incubated in normoxic (open symbols; PO∑21 kPa) and hypoxic (filled symbols;
PO∑ 2 kPa) conditions. At time zero, the cells were acidified by
isomolar addition of 10 mmol l−1(A), 20 mmol l−1(B) or 40 mmol l−1
(C) propionate to the medium. An asterisk indicates a statistically significant (P<0.05) difference between cells incubated in normoxic and hypoxic conditions. Values are means ±S.E.M., N=5.
Fig. 4. Unidirectional Na+influx in lamprey erythrocytes incubated
in normoxic (light grey bars; PO∑ 21 kPa) and hypoxic (dark grey
bars; PO∑2 kPa) conditions in untreated cells (Control) and in cells
subjected to intracellular acidification in the presence or absence of amiloride (1 mmol l−1). Acidification was induced by the addition of
20 mmol l−1 propionate (final concentration). A dagger indicates a
[image:6.609.320.554.391.617.2]suspension. Thus, any additional effect of long-term incubation in hypoxic conditions was not evident, nor was any uncoupling between the rate of Cl−efflux and oxygen content at the time resolution of these experiments. Also, the Cl−efflux increased again upon an increase in oxygen content, showing that the effect of deoxygenation is rapidly and completely reversible.
Effect of oxygenation on intracellular pH and the ion and water contents of lamprey red cells subjected to osmotic
swelling
When the osmolarity of the medium was decreased, the cells initially gained water (Fig. 10A). Subsequently, the cells
started losing K+and Cl−(Fig. 10B) and osmotically obligated
water in both normoxic and hypoxic conditions. Consequently, the volume decreased towards the original cell volume. The volume recovery was not, however, complete during the 120 min incubation even in normoxic conditions (the cells had extruded 65.2 % of the water gained upon swelling), and the volume recovery process was markedly inhibited by hypoxia (the cells had extruded only 21.3 % of the water accumulated during cell swelling). In contrast to Lampetra fluviatilis, the red cells of another lamprey species, Petromyzon marinus, were able to recover their cell volume completely after osmotic swelling (Nikinmaa et al. 1993).
The intracellular pH was higher in erythrocytes incubated in hypoxic than in normoxic conditions throughout the regulatory volume decrease experiments, whereas the extracellular pH was only slightly affected (Fig. 11A,B). There was an immediate decrease in intracellular pH in both normoxia and hypoxia as the cells swelled. During the volume recovery in normoxic conditions, there was a parallel increase in intracellular pH with the decrease in cell volume, restoring pHi at the end of the incubation in normoxia, but the initial pHi was not restored in hypoxia. The pHi changes observed in this experiment are probably due to the dissociation of haemoglobin to monomers during the initial cell swelling (combined with the release of protons and an increase in oxygen affinity; Nikinmaa, 1993; Airaksinen and Nikinmaa, 1995; Nikinmaa et al. 1995), followed by subsequent re-association to oligomers (which are less acidic and have a lower oxygen affinity) during the regulatory decrease in cell volume.
0 50 100 150 200 250 0 50 100 150 200 250
Rate of K
+ efflux (mmol kg
−
1 dry mass h
−
1)
Isotonic Hypotonic
*
*
Isotonic Hypotonic
Rate of K
+ influx (mmol kg
−
1 dry mass h
−
1)
A
[image:7.609.349.514.71.289.2]B
Fig. 5. Unidirectional K+ efflux (A) and influx (B) in lamprey
erythrocytes incubated in normoxic (light grey bars; PO∑21 kPa) and
hypoxic (dark grey bars; PO∑ 2 kPa) conditions in isotonic and
hypotonic salines. An asterisk indicates a statistically significant (P<0.05) difference between cells incubated in hypoxic conditions compared with cells incubated in normoxic conditions at the same medium osmolarity. Values are means + S.E.M., N=6–7.
2 6 21 61 0
50 100 150 200 250
Rate of K
+ efflux (mmol kg
−
1 dry mass h
−
1)
Oxygen tension (kPa)
*
*
*
Fig. 6. Unidirectional K+efflux in lamprey erythrocytes incubated at
different oxygen tensions. An asterisk indicates a statistically significant (P<0.05) difference between cells incubated in hypoxic or hyperoxic conditions compared with normoxic (PO∑ 21 kPa)
[image:7.609.90.243.71.484.2]Discussion
In this study, we have shown that several different ion-transport pathways in the cell membrane of lamprey erythrocytes are sensitive to oxygen tension. Low oxygen tension markedly activates the acidification-responsive Na+/H+
exchange, whereas the activities of the swelling-induced Cl− efflux pathway and the K+ efflux pathway in isotonic
conditions are reduced at low oxygen tension.
Regulation of Na+/H+exchange activity
Lamprey red cells maintain the intracellular pH at a value higher than the extracellular pH by means of Na+/H+exchange
(Nikinmaa et al. 1986). A high intracellular pH is crucial for both oxygen and CO2transport in lamprey blood (see Nikinmaa,
1993; Nikinmaa et al. 1995). Decreasing the intracellular pH, either using the NH4Cl prepulse technique (Nikinmaa et al.
1986, 1993) or by adding propionate to the medium (Virkki and
Nikinmaa, 1994; this study), leads to a marked increase in the activity of Na+/H+ exchange, as shown by an increase in
intracellular pH and the accumulation of Na+ and osmotically
obligated water. In the present study, we have demonstrated that the increase in intracellular Na+content was far greater at low
oxygen tension (2 kPa) than at atmospheric oxygen tension (21 kPa). This effect cannot be ascribed to the pH differences between normoxic and hypoxic cells. At a given oxygen tension, a reduction in pHi activates the Na+/H+ exchanger, and the
activity of the exchanger is proportional to the degree of acidification. However, despite the fact that the intracellular pH of normoxic cells was lower than that of hypoxic cells, the Na+/H+exchange activity was also lower in the normoxic cells.
Oxygen regulation of Na+/H+exchange has previously been
described in teleost erythrocytes, where a reduction in oxygen tension increases the activity of β-adrenergically activated Na+/H+exchange (Motais et al. 1987; Salama and Nikinmaa,
1988; Roig. et al. 1997). This response involves an increase in the number of β-adrenergic receptors in the erythrocyte cell membrane (Marttila and Nikinmaa, 1988), an increase in the activity of the Na+/H+exchanger itself (Salama and Nikinmaa,
1990) and possibly an increase in the number of exchangers on the cell surface (Reid et al. 1993). Also, in lamprey erythrocytes, the oxygen regulation of Na+/H+ exchange
activity after intracellular acidification may involve an increase in the activity of the exchanger and/or an increase in the number of exchangers on the cell membrane. In lamprey erythrocytes, no evidence for a physiologically significant β -adrenergic regulation of Na+/H+ exchange has been found in
either normoxic (Tufts, 1991; Virkki and Nikinmaa, 1994) or hypoxic (L. V. Virkki and M. Nikinmaa, unpublished data) conditions.
−20 0 20 40 60 80
*
B 0 20 40 60 80 100Rate of Cl
− efflux (mmol kg
−
1 dry mass h
−
1)
*
Isotonic Hypotonic A
Rate of Cl
− influx (mmol kg
−
1 dry mass h
−
1)
[image:8.609.76.213.298.654.2]Isotonic Hypotonic
Fig. 7. Unidirectional Cl− efflux (A) and influx (B) in lamprey erythrocytes incubated in normoxic (light grey bars; PO∑21 kPa) and
hypoxic (dark grey bars; PO∑ 2 kPa) conditions in isotonic and
hypotonic salines. An asterisk indicates a statistically significant (P<0.05) difference between cells incubated in hypoxic conditions compared with cells incubated in normoxic conditions at the same medium osmolarity. Values are means + S.E.M., N=6.
0 25 50 75 100 125 150
Rate of Cl
− efflux (mmol kg
−
1 dry mass h
−
1)
*
[image:8.609.355.500.468.661.2]Isotonic Hypotonic
Regulation of K+and Cl−transport and volume by oxygen
Lamprey erythrocytes respond to hypo-osmotic cell swelling by extruding K+ and Cl−and osmotically obligated water. K+
and Cl−leave the cell through separate pathways (Virkki and Nikinmaa, 1995). The swelling-activated K+channel has been
identified using patch-clamp techniques (L. V. Virkki and M. Nikinmaa, unpublished data). The swelling-activated Cl− transport pathway is probably a channel. The present study provides evidence that the swelling-activated Cl− transport pathway is functionally distinct from the pathway operating in cells of normal volume, since substitution of extracellular Cl− for glucuronate resulted in a marked increase in unidirectional Cl−efflux in swollen cells, but the unidirectional efflux of Cl− in cells of normal volume is decreased when extracellular Cl− is replaced (Bogdanova et al. 1998), indicating that the pathway operating in cells of normal volume is an exchange system.
In cells with normal volume, the majority of the ouabain-insensitive K+ permeability across the cell membrane results
from the action of Ba2+-sensitive K+channels (Kirk, 1991a,b;
Gusev et al. 1992) that show strong inward rectification (Virkki and Nikinmaa, 1996). In the present study, we observed that K+
efflux, but not K+ influx, is inhibited by low oxygen tension.
Previously, oxygen-sensitive K+ channels have been
demonstrated in a number of different cell types involved in oxygen sensing functions in the body, e.g. in glomus cells of the carotid body (López-Barneo et al. 1988) and in arterial myocytes (Dart and Standen, 1995; Shigemori et al. 1996). In carp (Jensen, 1990) and trout (Borgese et al. 1991) erythrocytes,
oxygenation in isotonic medium has been shown to activate a K+efflux. In contrast to the K+ channel observed in lamprey
erythrocytes, K+efflux in teleosts occurred via a Cl−-dependent
pathway, apparently as K+/Cl−cotransport.
With regard to cell volume regulation, in carp (Jensen, 1995) and trout (Nielsen et al. 1992) red cells, cell swelling in oxygenated medium increased the activity of the Cl−-dependent K+ transport. In deoxygenated cells, cell swelling failed to
induce Cl−-dependent K+ release and, consequently, volume
recovery was inhibited. In lamprey erythrocytes, the regulatory volume decrease was inhibited in hypoxic conditions. In
0 25 50 75 100 125 150
0 1 2 3 4 5
*
*
*
Rate of Cl
− efflux
(mmol kg
−
1 dry mass h
−
1)
Oxygen content (vol%)
5
Time (min)
[image:9.609.56.292.76.210.2]0 15 33 50 5 35
Fig. 9. Unidirectional Cl−efflux (bars; scale on the left-hand axis) and oxygen content (circles; scale on the right-hand axis; n.b. these values include haemoglobin-bound oxygen) of lamprey erythrocytes subjected to cell swelling. The cell suspension (in isotonic saline) was first gassed with normoxic oxygen tension (open bars; PO∑
21 kPa). A sample was removed for measurement of Cl−efflux in hypotonic saline. The gassing of the original cell suspension was switched to hypoxic oxygen tension (grey bars; PO∑ 2 kPa), and
samples were removed for Cl− efflux measurement at the times indicated in the figure. After the last hypoxic measurement, the gassing was again switched to normoxic oxygen tension, and samples were removed for Cl− efflux measurement. An asterisk indicates a statistically significant difference (P<0.05) from the previous measurement for both Cl−eflux and oxygen content. Values are means ±S.E.M., N=4–6.
68 70 72 74 76 78
Cell water content (%)
Time (min)
0 30 60 90 120
Cell ion content (mmol kg
−
1 dry mass)
50 100 150 200 250
K+
Cl− A
B
*
,†*
,†*
,†*
*
*
,†*
,†*
*
,†*
,†*
,†*
† †
† †
† † †
†
†
†
†
[image:9.609.330.540.77.488.2]0 30 60 90 120
Fig. 10. Cell water content (A) and intracellular K+and Cl−content
(B) of lamprey erythrocytes incubated in normoxic (open symbols; PO∑ 21 kPa) and hypoxic (filled symbols; PO∑2 kPa) conditions. At
time zero, the osmolarity of the medium was decreased by the addition of 0.5 vol of 10 mmol l−1 NaHCO
3 solution. An asterisk
contrast to the teleost system, the swelling-activated K+
transport pathway in the lamprey is a channel (L. V. Virkki and M. Nikinmaa, unpublished data). The channel does not appear to be sensitive to the oxygen tension of the medium since, in this study, neither influx nor efflux of K+in hypotonic medium
was affected by the oxygen tension. In contrast to K+ efflux,
swelling-activated Cl− efflux was strongly inhibited by decreasing the oxygen tension of the incubation. Thus, since the regulatory volume decrease is inhibited by hypoxia, the Cl− permeability appears to be the limiting factor in governing net ion transport from swollen cells, at least during the initial phase of volume recovery. Net K+efflux is consequently reduced to
maintain electroneutrality, although the K+permeability does
not change.
The effect of oxygen on ion transport across lamprey erythrocyte membrane appears to be asymmetric. Low oxygen tension inhibited the efflux, but less so the influx, of K+ in
isotonic conditions and the efflux, but not the influx, of Cl−in hypotonic conditions. Thus, it is conceivable that the oxygen-dependent regulation in these cases acts on an intracellular site by blocking the exit of ions from the cells but with less influence on the entry of ions.
Oxygen sensing and transduction
It is not known how oxygen regulates ion transport across the erythrocyte membrane. The present study and earlier studies (e.g. Motais et al. 1987) have clearly shown that changes in cellular metabolite concentrations or protein synthesis do not play a role. In the present experiments, the effect of oxygen on ion transport occurred within minutes and was rapidly and completely reversible. It has been suggested that oxygen sensing and transduction in erythrocytes could involve an oxy–deoxy conformational change in the (tetrameric) haemoglobin, since ion transport responds to manipulations of intracellular pH, methaemoglobin formation and treatment with CO, factors that also affect haemoglobin conformation (Motais et al. 1987; Salama and Nikinmaa, 1988; Borgese et al. 1991; Jensen, 1992; Nikinmaa and Jensen, 1992). However, lamprey haemoglobins do not show true conformational changes upon oxy–deoxy transition; in contrast, the monomer–oligomer equilibrium is affected (see Nikinmaa et al. 1995) and thus true conformational changes in the haemoglobin molecule are not necessary for the effects of oxygen on ion transport. It is, however, also possible that either the oligomeric or the monomeric haemoglobin in lamprey erythrocytes interacts with the transporter, and thus the possibility that the haemoglobin molecule is involved in the regulation of ion transport by oxygen cannot be excluded. It is, however, possible that some other haem-containing multisubunit protein or another oxygen-sensitive structure could be involved. Conformational changes in a haem protein are also implicated in the regulation of cell function by oxygen tension in cells other than erythrocytes (see Acker, 1994; Bunn and Poyton, 1996), e.g. in the regulation of erythropoietin production in a human hepatoma cell line (Goldberg et al. 1988) and of protein synthesis in turtle hepatocytes (Land and Hochachka, 1995).
These studies were supported by the Academy of Finland (Project 27876 and 40830) and Emil Aaltonen foundation. Dr Anna Bogdanova is thanked for valuable discussions.
References
ACKER, H. (1994). Mechanisms and meaning of cellular oxygen
sensing in the organism. Respir. Physiol. 95, 1–10.
AIRAKSINEN, S. AND NIKINMAA, M. (1995). Effect of haemoglobin
concentration on the oxygen affinity of intact lamprey erythrocytes. J. exp. Biol. 198, 2393–2396.
BOGDANOVA, A. Y., SHERSTOBITOV, A. O. ANDGUSEV, G. P. (1998). Chloride transport in red blood cells of lamprey Lampetra fluviatilis: evidence for a novel anion exchange system. J. exp. Biol. 201, 693–700.
BORGESE, F., MOTAIS, R. ANDGARCÍA-ROMEU, F. (1991). Regulation of Cl-dependent K transport by oxy–deoxyhemoglobin transitions in trout red cells. Biochim. biophys. Acta 1066, 252–256. BUNN, H. F. AND POYTON, R. O. (1996). Oxygen sensing and
molecular adaptation to hypoxia. Physiol. Rev. 76, 839–885. COSSINS, A. R. ANDGIBSON, J. S. (1997). Volume-sensitive transport
systems and volume homeostasis in vertebrate red blood cells. J. exp. Biol. 200, 343–352.
DART, C. ANDSTANDEN, N. B. (1995). Activation of ATP-dependent
Intracellular pH
7.3 7.4 7.5 7.6 7.7
Time (min)
0 30 60 90 120
Extracellular pH
7.3 7.4 7.5 7.6 7.7
A
B
†
*
†
[image:10.609.59.271.76.344.2]*
0 30 60 90 120Fig. 11. Intracellular (A) and extracellular (B) pH of lamprey erythrocytes incubated in normoxic (open symbols; PO∑21 kPa) and
hypoxic (closed symbols; PO∑ 2 kPa) conditions. At time zero, the
osmolarity of the medium was decreased by the addition of 0.5 vol of 10 mmol l−1NaHCO3solution. In A, normoxic and hypoxic values
K+channels by hypoxia in smooth muscle cells isolated from the
pig coronary artery. J. Physiol., Lond. 483, 29–39.
FRANCO-OBREGÓN, A. AND LÓPEZ-BARNEO, J. (1996). Low PO∑
inhibits calcium channel activity in arterial smooth muscle cells. Am. J. Physiol. 271, H2290–H2299.
GOLDBERG, M. A., DUNNING, S. P. AND BUNN, H. F. (1988).
Regulation of the erythropoietin gene: evidence that the oxygen sensor is a heme protein. Science 242, 1412–1415.
GUSEV, G. P., SHERSTOBITOV, A. O. AND SKULSKII, I. A. (1992). Potassium transport in lamprey (Lampetra fluviatilis) erythrocytes: evidence for K+channels. Comp. Biochem. Physiol. 101A, 569–572.
JENSEN, F. B. (1990). Nitrite and red cell function in carp: control
factors for nitrite entry, membrane potassium ion permeation, oxygen affinity and methaemoglobin formation. J. exp. Biol. 152, 149–166.
JENSEN, F. B. (1992). Influence of haemoglobin conformation, nitrite
and eicosanoids on K+ transport across the carp red blood cell
membrane. J. exp. Biol. 171, 349–371.
JENSEN, F. B. (1995). Regulatory volume decrease in carp red blood cells: mechanisms and oxygenation-dependency of volume-activated potassium and amino acid transport. J. exp. Biol. 198, 155–165.
JU, Y.-K., SAINT, D. A. ANDGAGE, P. W. (1996). Hypoxia increases persistent sodium current in rat ventricular myocytes. J. Physiol., Lond. 497, 337–347.
KIRK, K. (1991a). K+ transport across the lamprey erythrocyte
membrane: characteristics of a Ba2+ and amiloride-sensitive
pathway. J. exp. Biol. 159, 303–324.
KIRK, K. (1991b). The effect of N-ethylmaleimide on K+and Cl−
transport pathways in the lamprey erythrocyte membrane: activation of K+/Cl−cotransport. J. exp. Biol. 159, 325–334.
KOURIE, J. I. (1997). A redox O2 sensor modulates the SR Ca2+
countercurrent through voltage- and Ca2+-dependent Cl−channels.
Am. J. Physiol. 272, C324–C332.
LAND, S. C. ANDHOCHACHKA, P. W. (1995). A heme-protein-based oxygen-sensing mechanism controls the expression and suppression of multiple proteins in anoxia-tolerant turtle hepatocytes. Proc. natn. Acad. Sci. U.S.A. 92, 7505–7509. LÓPEZ-BARNEO, J., LÓPEZ-LÓPEZ, J. R., URENA, J. ANDGONZÁLEZ, C.
(1988). Chemotransduction in the carotid body: K+ current
modulated by PO∑in the type I chemoreceptor cell. Science 241,
580–582.
MARTTILA, O. N. T. AND NIKINMAA, M. (1988). Binding of
β-adrenergic antagonists 3H-DHA and 3H-CGP 12177 to intact
rainbow trout (Salmo gairdneri) and carp (Cyprinus carpio) red blood cells. Gen. comp. Endocr. 70, 429–435.
MOTAIS, R., GARCIA-ROMEU, F. ANDBORGESE, F. (1987). The control of Na+/H+exchange by molecular oxygen in trout erythrocytes. A
possible role of hemoglobin as a transducer. J. gen. Physiol. 90, 197–207.
NIELSEN, O. B., LYKKEBOE, G. AND COSSINS, A. R. (1992). Oxygenation-activated K-fluxes in trout red blood cells. Am. J. Physiol. 263, C1057–C1064.
NIKINMAA, M. (1986). Red cell pH of lamprey (Lampetra fluviatilis)
is actively regulated. J. comp. Physiol. B 156, 747–750.
NIKINMAA, M. (1993). Haemoglobin function in intact Lampetra
fluviatilis erythrocytes. Respir. Physiol. 91, 283–293.
NIKINMAA, M., AIRAKSINEN, S. AND VIRKKI, L. V. (1995).
Haemoglobin function in intact lamprey erythrocytes: interactions with membrane function in the regulation of gas transport and acid–base balance. J. exp. Biol. 198, 2423–2430.
NIKINMAA, M. ANDHUESTIS, W. H. (1984). Adrenergic swelling in nucleated erythrocytes: cellular mechanisms in a bird, domestic goose, and two teleosts, striped bass and rainbow trout. J. exp. Biol. 113, 215–224.
NIKINMAA, M. ANDJENSEN, F. B. (1992). Inhibition of the adrenergic sodium/proton exchange activity in rainbow trout red cells by nitrite-induced methaemoglobinaemia. J. comp. Physiol. B 162, 424–429. NIKINMAA, M., KUNNAMO-OJALA, T. AND RAILO, E. (1986).
Mechanisms of pH regulation in lamprey (Lampetra fluviatilis) red blood cells. J. exp. Biol. 122, 355–367.
NIKINMAA, M. ANDMATTSOFF, L. (1992). Effects of oxygen saturation on the CO2 transport properties of Lampetra red cells. Respir.
Physiol. 87, 219–230.
NIKINMAA, M. AND RAILO, E. (1987). Anion movements across
lamprey (Lampetra fluviatilis) red cell membrane. Biochim. biophys. Acta 899, 134–136.
NIKINMAA, M., TUFTS, B. L. ANDBOUTILIER, R. G. (1993). Volume and pH regulation in Agnathan erythrocytes – comparisons between the hagfish, Myxine glutinosa and the lampreys, Petromyzon marinus and Lampetra fluviatilis. J. comp. Physiol. B 163, 608–613.
OHNISHI, S. T. AND ASAI, H. (1985). Lamprey erythrocytes lack
glycoproteins and anion transport. Comp. Biochem. Physiol. 81B, 405–407.
REID, S. D., LEBRAS, Y. ANDPERRY, S. F. (1993). The in vitro effect of hypoxia on the trout erythrocyte beta-adrenergic signal transduction system. J. exp. Biol. 176, 103–116.
ROIG, T., SANCHEZ, J., TORT, L., ALTIMIRAS, J. AND BERMUDEZ, J.
(1997). Adrenergic stimulation of sea bream (Sparus aurata) red blood cells in normoxia and anoxia: effects on metabolism and on the oxygen affinity of haemoglobin. J. exp. Biol. 200, 953–961. ROOS, A. ANDBORON, W. F. (1981). Intracellular pH. Physiol. Rev.
61, 296–434.
SALAMA, A. ANDNIKINMAA, M. (1988). The adrenergic responses of
carp (Cyprinus carpio) red cells: effects of PO∑and pH. J. exp. Biol.
136, 405–416.
SALAMA, A. ANDNIKINMAA, M. (1990). Effect of oxygen tension on catecholamine-induced formation of cyclic AMP and on swelling of carp red blood cells. Am. J. Physiol. 259, C723–C726. SHIGEMORI, K., ISHIZAKI, T., MATSUKAWA, S., SAKAI, A., NAKAI, T.
AND MIYABO, S. (1996). Adenine nucleotides via activation of ATP-sensitive K+ channels modulate hypoxic response in rat
pulmonary artery. Am. J. Physiol. 270, L803–L809.
TUCKER, V. A. (1967). Method for oxygen content and dissociation
curves on microliter blood samples. J. appl. Physiol. 23, 410–414. TUFTS, B. L. (1991). Acid–base regulation and blood gas transport
following exhaustive exercise in an agnathan, the sea lamprey Petromyzon marinus. J. exp. Biol. 159, 371–385.
TUFTS, B. L. (1992). In vitro evidence for sodium-dependent pH regulation in sea lamprey (Petromyzon marinus) red blood cells. Can. J. Zool. 70, 411–416.
VIRKKI, L. V. ANDNIKINMAA, M. (1994). Activation and physiological
role of Na+/H+ exchange in lamprey (Lampetra fluviatilis)
erythrocytes. J. exp. Biol. 191, 89–105.
VIRKKI, L. V. ANDNIKINMAA, M. (1995). Regulatory volume decrease in lamprey erythrocytes: mechanisms of K+and Cl−transport. Am.
J. Physiol. 268, R590–R597.
VIRKKI, L. V. ANDNIKINMAA, M. (1996). Conductive ion transport
across the erythrocyte membrane of lamprey (Lampetra fluviatilis) in isotonic conditions is mainly via an inwardly rectifying K+