Melhem J. A. Sharafuddin, David P. Diemer, Richard S. Levine, Jeffrey L. Thomasson, and Allan L. Williams
PURPOSE: To compare six MR sequences (plain and gadolinium-enhanced fat suppressed
T1-weighted spin echo, T2-T1-weighted standard spin echo, fat-suppressed and non–fat-suppressed T2-weighted fast spin echo, and inversion-recovery T2-weighted fast spin echo) in their ability to detect, delineate, and characterize lesions of the parotid gland. METHODS: Fifty-eight parotid gland lesions imaged on 47 examinations were retrospectively evaluated by three blinded observ-ers. Several outcome-related variables were compared by the above six sequences: imaging time, image quality, anatomic sharpness of parotid space, subjective lesion conspicuity, detected ab-normality volume, number of individual lesions or discrete lobulations, conspicuity of invasion into adjacent boundaries and structures, and overall diagnostic value. RESULTS: Differences in the above outcome variables between sequences did not correlate with MR scanner software upgrade level, coil type, or lesion-dependent characteristics. Fat-suppressed fast spin-echo T2-weighted and inversion-recovery fast spin-echo T2-weighted sequences resulted in significantly higher scores for lesion conspicuity, detected abnormality volume, and overall diagnostic value. T1-weighted images resulted in the next highest scores, whereas gadolinium-enhanced T1-T1-weighted and standard spin-echo T2-weighted sequences performed poorly for most parotid lesions.
CONCLUSION: MR imaging of the parotid gland should include fat-suppressed,
long-repetition-time, fast spin-echo T2-weighted, and T1-weighted sequences. Gadolinium-enhanced images need not be obtained routinely.
Index terms: Salivary glands, magnetic resonance; Magnetic resonance, comparative studies
AJNR Am J Neuroradiol16:1895–1902, October 1995
Magnetic resonance (MR) imaging is a pre-miere imaging modality for the evaluation of parotid gland masses (1–14). The value of fast spin-echo sequences and fat suppression in the imaging of extracranial head and neck lesions has been reported (1, 2, 8, 11, 12, 15). In the parotid gland, because of the normally high fat content, contrast between normal tissue and disease can be low on T2-weighted images, es-pecially with fast spin-echo sequences. We ret-rospectively analyzed our experience with a
wide range of parotid gland lesions and com-pared standard spin-echo and fat-suppressed fast spin-echo sequences, attempting to arrive at useful guidelines for MR imaging of parotid gland masses.
Material and Methods
Patients
All parotid gland lesions imaged at one institution since late 1990 were retrospectively analyzed. Six examinations (in 4 patients) were eliminated from the study because of inappropriate windowing, gross artifact, or compromised image quality on more than one sequence. A total of 58 lesions imaged on 47 examinations were evaluable for the study. There were 31 female and 16 male subjects, with a mean age of 42 years (range, 7 to 70 years). The lesion categories included benign neoplasms (n 5 21), malig-nant neoplasms (n56), multiple or metastatic neoplasms (n59), inflammatory conditions (n511), cystic lesions (n 5 6), lipomatous lesions (n 5 4), and hemangioma (n51).
Presented in part at the American Roentgen Ray Society 95th Annual Meeting, New Orleans, La, 1994.
Received February 17, 1995; accepted after revision May 16. From the Department of Radiology, St Louis (Mo) University Health Sciences Center (M.J.A.S., D.P.D., R.S.L., J.L.T., A.L.W.) and the Depart-ment of Radiology, St John’s Mercy Medical Center, St Louis, Mo (D.P.D., R.S.L., J.L.T.).
Address reprint requests to M. J. A. Sharafuddin, MD, Department of Radiology, St Louis University Health Sciences Center, 3635 Vista Ave at Grand Blvd, St Louis, MO 63110 – 0250.
AJNR 16:1895–1902, Oct 1995 0195-6108/95/1609 –1895
qAmerican Society of Neuroradiology
MR Imaging
Six sequences were used in various combinations: plain T1-weighted spin-echo, fat-suppressed gadolinium-enhanced T1-weighted echo (Gd T1), standard spin-echo weighted (SSE T2), and fast spin-spin-echo T2-weighted images with and without fat suppression (FS FSE T2 and FSE T2, respectively). We also began using inver-sion recovery fast spin-echo T2-weighted images (IR FSE T2) in late 1993.
Two 1.5-T signa units, software levels from 4.8 to 5.2 (General Electric, Milwaukee, Wis) were used. Either a quadrature head coil or a receive-only volume cervical coil was used. Images were obtained in 5-mm-thick sections with 1-mm intersection gap. T1-weighted imaging param-eters were 550-650/10-15/1 (repetition time/echo time/ excitations), with 2563192 matrix. T2-weighted imaging parameters on spin-echo sequences were 2000-2500/20-80/0.75-1, superior and inferior saturation pulses, with 256 3 192 matrix. T2-weighted imaging parameters on fast spin echo sequences were 5000-6000/119 (effec-tive)/2-4; echo train length, 119; single echo, superior, and inferior saturation pulses; image matrix varying from 2563192 to 5123256. Fat suppression in FS FSE T2 and in most gadolinium-enhanced images was achieved by the frequency-selective, chemical-presaturation method. The other fat-suppressed T2-weighted sequence was IR FSE T2, with the parameters 4000-6000/26-85/1; 2563192 matrix; and 140 to 170 inversion time. For all images, window/level settings were carefully adjusted by experienced MR imaging technologists to optimize tissue contrast in the parotid space.
Analysis of MR Imaging Data
The images were analyzed by three investigators who were blinded to the diagnosis but not to the MR imaging sequence. Weighted k statistics showed good interob-server congruency.
Designated Variables
Several outcome-related variables were derived for each lesion and individually scored by each observer for each sequence used in the examination. Time taken to complete a 12-section series was expressed in seconds. Image quality, regardless of the diagnostic value, was sub-jectively scored. The anatomic sharpness, related to the definition of anatomic contents and boundaries of the pa-rotid space, was subjectively scored. The subjective con-spicuity of abnormality, relative to the surrounding tissue, also was scored. Subjective conspicuity has been found elsewhere to closely reflect the measured lesion contrast-to-noise ratio (16, 17). Abnormality volume was ranked according to the subjective size of abnormality detected on one sequence, relative to the remaining sequences. The number of individual lesions or discrete lobulations within one lesion was determined for multifocal, or lobulated,
lesions. For invasive lesions, conspicuity of the invasion into adjacent boundaries and structures also was subjec-tively scored. The overall value of each sequence also was subjectively graded in terms of the value of the sequence in assisting the diagnosis. All subjective scores varied from 1 to 5 (poor to excellent).
Lesion-related variables (sequence-independent) also were derived for each lesion, including category, size, mar-gination, signal homogeneity, and, when applicable, the degree and pattern of enhancement. Equipment-related variables including software upgrade level of the MR scan-ner and coil type also were recorded.
Statistical Analysis
Outcome variables (imaging time, quality, sharpness, conspicuity, invasion, number, and overall value) were compared in the six sequences (T1, Gd T1, SSE T2, FS FSE T2, FSE T2, IR FSE T2) using one-way analysis of variance (ANOVA) and Kruskal-Wallis nonparametric ANOVA. Least significance difference-multiple range test was used for paired comparison of imaging time by se-quence. Mann-Whitney/Wilcoxon’s rank sum test was used for paired comparison of nonparametric variables by sequence. When comparing small groups containing fewer than 10 cases, a significance threshold ofP,.1 was used, otherwiseP,.05 was used.
The sequences also were compared for certain specific lesion categories including cystic, lipomatous, small (#10 mm), and large ($2 cm). Comparison was limited to T1, Gd T1, and FS FSE T2 sequences because of insufficient number of cases imaged with other sequences.
Correlation analysis was performed between three out-come variables (conspicuity, volume, and overall value) and five categorizing variables (upgrade, coil, quality, size, and enhancement).
Results
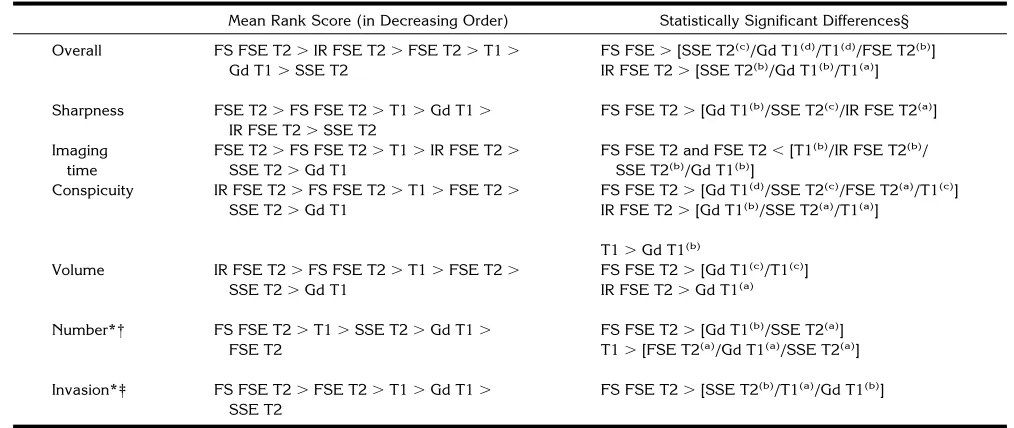
Imaging time, subjective lesion conspicuity, anatomic sharpness in the parotid space, over-all diagnostic value, and number of individual lesions detected were all significantly depen-dent on the MR imaging sequence. These vari-ables were, however, unrelated to software up-grade level, coil type, image quality, or lesion-related characteristics (such as lesion category, size, borders, signal homogeneity, and en-hancement). Paired comparison of outcome-based variables by MR imaging sequences is summarized in Tables 1 and 2.
The highest image quality scores were achieved by FS FSE T2 and IR FSE T2 se-quences although the only statistically signifi-cant difference was between FS FSE T2 and SSE T2 sequences. The anatomic sharpness in the parotid space was significantly better with FS FSE T2 images than with IR FSE T2, SSE T2, and T1 Gd images.
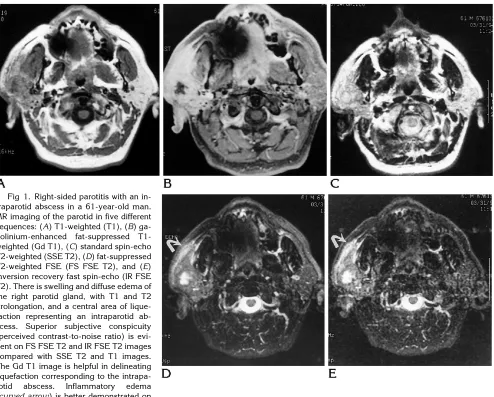
Parotid gland disease was most conspicuous on FS FSE T2 and IR FSE T2 images, with
significantly higher mean rank scores than the other sequences (Fig 1). Although IR FSE T2 mean rank was higher than FS FSE T2, the difference between the two scores was not sta-tistically significant (P 5.73). The next highest conspicuity was achieved by T1, with signifi-cantly higher mean rank score than Gd T1, FSE T2, and SSE T2 images. The volume of abnor-mality also was best depicted on FS FSE T2 and IR FSE T2 images (highest relative size of de-TABLE 1: The diagnostic value of analyzed MR imaging sequences, expressed in mean rank scores, for each of the analyzed outcome variables
Quality Sharpness Conspicuity Volume Number* Invasion† Overall
FS FSE T2 88 90 106 100 25 20 109
(43) (43) (n543) (n543) (n510) (n55) (n543)
IR FSE T2 96 69 114 106 . . . 102
(6) (6) (n56) (n56) (n56)
FSE T2 86 96 79 77 6 14 81
(9) (9) (n59) (n59) (n51) (n51) (n59)
T1 85 88 83 79 17 12 79
(52) (52) (n552) (n552) (n510) (n510) (n552)
Gd T1‡ 80 77 64 73 9 13 66
(43) (43) (n543) (n543) (n59) (n56) (n543)
SSE T2 70 64 67 75 15 9 66
(13) (13) (n513) (n513) (n52) (n54) (n513)
Note.—n indicates cases per sequence. * Multiple or multilobulated lesions only. † Invasive lesions only.
[image:3.612.55.556.125.268.2]‡ Fat suppression used in most cases.
TABLE 2: Ranking and significant differences of MR imaging sequences (expressed in mean rank scores) for each of the analyzed outcome variables
Mean Rank Score (in Decreasing Order) Statistically Significant Differences§ Overall FS FSE T2.IR FSE T2.FSE T2.T1.
Gd T1.SSE T2
FS FSE.[SSE T2(c)/Gd T1(d)/T1(d)/FSE T2(b)]
IR FSE T2.[SSE T2(b)/Gd T1(b)/T1(a)]
Sharpness FSE T2.FS FSE T2.T1.Gd T1. IR FSE T2.SSE T2
FS FSE T2.[Gd T1(b)/SSE T2(c)/IR FSE T2(a)]
Imaging time
FSE T2.FS FSE T2.T1.IR FSE T2. SSE T2.Gd T1
FS FSE T2 and FSE T2,[T1(b)/IR FSE T2(b)/
SSE T2(b)/Gd T1(b)]
Conspicuity IR FSE T2.FS FSE T2.T1.FSE T2. SSE T2.Gd T1
FS FSE T2.[Gd T1(d)/SSE T2(c)/FSE T2(a)/T1(c)]
IR FSE T2.[Gd T1(b)/SSE T2(a)/T1(a)]
T1.Gd T1(b)
Volume IR FSE T2.FS FSE T2.T1.FSE T2.
SSE T2.Gd T1
FS FSE T2.[Gd T1(c)
/T1(c)
] IR FSE T2.Gd T1(a)
Number*† FS FSE T2.T1.SSE T2.Gd T1. FSE T2
FS FSE T2.[Gd T1(b)
/SSE T2(a)
] T1.[FSE T2(a)
/Gd T1(a)
/SSE T2(a)
]
Invasion*‡ FS FSE T2.FSE T2.T1.Gd T1. SSE T2
FS FSE T2.[SSE T2(b)
/T1(a)
/Gd T1(b)
]
* Insufficient cases for analysis of number and invasion with IR FSE. † Multiple or multilobulated lesions only.
‡ Invasive lesions only.
[image:3.612.51.558.491.705.2]tected abnormality), with FS FSE T2 score be-ing significantly higher than T1, Gd T1, and SSE T2 (Fig 2). When the conspicuity in visualizing invasion was compared (for invasive lesions), FS FSE T2 showed invasion significantly better than the remaining sequences. For multiple and lobulated lesions, both FS FSE T2 and T1 se-quences showed significantly more individual lesions or lobulations per parotid gland (Fig 3). IR FSE T2 images could not be analyzed for number of lesions and invasion because of in-sufficient number of cases. The highest overall diagnostic value was achieved by FS FSE T2 and IR FSE T2 sequences with significantly higher mean rank scores with FS FSE T2 than with all other sequences, with the exception of IR FSE T2.
In the category of cysts and cystic lesions, FS FSE T2 and Gd T1 sequences generally re-sulted in the highest conspicuity and overall value scores. For lipomatous lesions, T1 se-quences achieved the highest conspicuity, overall value, and volume scores. For lesions smaller than 1 cm, as well as those greater than 2 cm, FS FSE T2 sequences resulted in the highest mean rank scores for conspicuity, vol-ume and overall diagnostic value.
Both image quality and anatomic sharpness achieved in the parotid space showed a weak correlation with the software upgrade level (r5
[image:4.612.62.556.100.497.2].26 and .28; P ,.1). Conspicuity, abnormality volume, and overall diagnostic value did not significantly correlate with software level or coil Fig 1. Right-sided parotitis with an
type. Lesion conspicuity correlated well with the volume of abnormality (r5.72;P ,.01).
Discussion
The recent introduction of fast spin-echo se-quences has been a significant development in MR imaging (6). Fast spin-echo images offer several advantages over traditional sequences, including substantial decrease is imaging time, improved patient tolerance, and reduced mo-tion and magnetic susceptibility artifacts (6, 9).
Although the T2-weighted contrast on fast spin echo sequences is very similar to that on stan-dard spin-echo sequences, an important differ-ence is the persistdiffer-ence of bright fat signal on fast spin-echo images. This is thought to be the result of decreased J coupling attributable to the multiple 1808 refocusing pulses (18). The other difference is the reduction of magnetic suscep-tibility artifact, which is advantageous for imag-ing soft tissue regions adjacent to bone and dental fillings. However, this can result in ob-scuration of small foci of hemosiderin and cal-Fig 2. Parotid hemangioma in a 9-year-old girl.
[image:5.612.58.557.101.309.2]A, Axial T1-weighted andB,C, axial and coronal fat-suppressed T2-weighted fast spin echo (FS FSE T2) images show an infiltrative lesion with T2 prolongation and involvement of adjacent skin and external ear. Conspicuity and extent of abnormality are much better depicted on the FS FSE T2 images.
Fig 3. Pleomorphic adenoma of the pa-rotid in a 45-year-old woman.
[image:5.612.57.382.539.743.2]cium, which can further compromise the capa-bility to detect salivary calculi and phleboliths on MR imaging (6). Clinical experience with fast spin-echo has shown its value in the central nervous system orbits, head and neck, muscu-loskeletal system, and abdomen and pelvis (1, 9, 11, 16, 17, 19 –22). In the head and neck, T2-weighted fast spin echo images have re-sulted in improved conspicuity and increased number of detected individual lesions even without the use of fat suppression (11, 23). Another report, however, found no significant difference between fat-suppressed T2-weighted fast spin echo and T2-weighted standard spin echo images in head and neck tumors (1).
The abundance of fat in the parotid space necessitates the use of fat suppression with T2-weighted fast spin-echo sequences to preserve contrast between intraparotid lesions and nor-mal gland (10, 15). Suppression of the bright fat signal also results in expansion of the gray scale dynamic range and decreased motion artifact, which translates into improved conspicuity of regions of abnormal T2 prolongation. The value of fat suppression in head and neck lesions has been clinically demonstrated (1, 2, 4, 6 – 8, 10, 12, 15, 24) (Vogl T, Mack MJ, Juergens M, et al, “MR Imaging with High-Dose Gadola-mide Injection of the Head and Neck: Results in a Phase III Trial and Comparison with the Use of Standard-Dose Gd-DTPA,” Radiology1993; 189[P]:107 [abstr]). Fat suppression also has been shown to improve visualization of
gado-linium enhancement on T1-weighted
se-quences (1, 6, 24). The most widely used fat suppression method is frequency-selective or chemical presaturation (6). Short-inversion-time inversion recovery is another popular fat-suppression sequence that has been reported to be advantageous in the imaging of parotid gland legions, although no comparison group or statistical analysis was presented (12). A draw-back of the chemical-presaturation method is its liability to bulk-susceptibility and magnetic-susceptibility artifacts, resulting in asymmetric fat suppression, which may obscure or falsely mimic disease (6, 25). Inversion-recovery fast spin-echo sequences also have been recently described, offering reliable fat suppression sub-stantially faster than with standard short-inver-sion-time inversion recovery sequences (2, 18). In our experience FS FSE T2 sequences re-sulted in significant reduction in imaging time
compared with Gd T1, T1, SSE T2, and IR FSE T2 sequences, despite two to four times more signal averages and higher-resolution matrices. FS FSE T2 sequences also resulted in the high-est anatomic sharpness in the parotid space, partly because of the ability to use a higher-resolution matrix without prolongation of imag-ing time. FS FSE T2 sequences, along with IR FSE T2 sequences, also resulted in the highest lesion conspicuity and overall diagnostic value. Moreover, FS FSE T2 and IR FSE T2 images resulted in the visualization of a relatively larger volume of abnormality compared with other se-quences. However, in the absence of a standard to measure the actual lesion size in our study, this observation does not necessarily indicate that FS FSE T2 provides a more accurate as-sessment of tumor size (unfortunately, abnor-mality size on MR could not be correlated with direct pathologic measurement of abnormality size, given the retrospective nature of the study). FS FSE T2 resulted in an improved con-spicuity of invasion (for invasive lesions) and detected more individual lesions or lobulations (for multiple or multilobulated lesions). Al-though the small number of cases did not per-mit statistical analysis, a general tendency of FS FSE T2 to outperform T1 and Gd T1 sequences was noted for both very small and large lesions. In addition, both FS FSE T2 and Gd T1 ap-peared superior to T1 for cystic lesions. How-ever, for lipomatous lesions, T1 appeared more advantageous than FS FSE T2.
T1-weighted images generally resulted in good outcome scores, although the ranks were frequently lower than for FS FSE T2 and IR FSE T2 images. We believe T1-weighted images al-ways should be a part of the parotid examina-tion and, certainly, should not be replaced by gadolinium-enhanced weighted images. T1-weighted images, although providing good le-sion conspicuity and better anatomic details outside the parotid space, also are diagnosti-cally helpful for tissue characterization in lipid-containing lesions, cysts, hemorrhage, and le-sions rich in melanin (melanotic melanoma).
Despite the reported value of gadolinium-enhanced sequences for MR imaging of head and neck lesions in general (7, 24) (Vogl T et al., “MR Imaging with High-Dose . . .”), we have found it to be of limited value in the imaging of parotid masses. We believe this to be related to simultaneous enhancement of both tumor and normal parotid parenchyma resulting in de-creased lesion conspicuity on the enhanced im-ages. Decreased delineation of fat planes on gadolinium-enhanced T1-weighted images also may result in loss of anatomic details and poor demarcation of the various anatomic compart-ments. Nevertheless, gadolinium-enhanced T1-weighted images have been reported to be help-ful in the diagnosis of Warthin tumor, which frequently does not enhance (5). In our experi-ence with 4 Warthin tumors, 3 showed no en-hancement, and one only enhanced minimally, whereas minimal or no enhancement occurred in only 2 of 24 other well-marginated benign and malignant lesions. Characterization of post-operative fibrosis or necrotic or cystic lesions and visualization of perineural spread in malig-nant parotid lesions are other conditions for which we, as well as others, have noted a po-tential adjunctive value for contrast-enhanced MR images (Fig 1) (6, 7, 13, 14). However, FS FSE T2 images often can provide equivalent information without the added cost and incon-venience to the patient and with significant re-duction in imaging time.
In conclusion, our data suggest that optimal MR imaging of the parotid gland could be achieved by T1-weighted and fat-suppressed FSE T2-weighted sequences. Gadolinium-en-hanced images should not be obtained routinely in a standard parotid MR imaging protocol. When a contrast-enhanced study is needed, fat suppression should be used, and precontrast T1-weighted images always should be
ob-tained. Standard spin-echo T2-weighted se-quences no longer should be used and should be replaced by FS FSE T2, IR FSE T2, or equiv-alent sequences whenever possible.
References
1. Ross MR, Schomer DF, Chappell P, Enzmann DR. MR imaging of head and neck tumors: comparison of T1-weighted contrast-en-hanced fat-suppressed images with conventional T2-weighted and fast spin-echo T2-weighted images.AJR Am J Roentgenol 1994;163:173–178
2. Panush D, Fulbright R, Sze G, Smith RC, Constable RT. Inversion-recovery fast spin-echo MR imaging: efficacy in the evaluation of head and neck lesions.Radiology1993;187:421– 426
3. Yousem DM, Montone KT, Sheppard LM, Rao VM, Weinstein GS, Hayden RE. Head and neck neoplasms: magnetization transfer imaging.Radiology1994;192:703–707
4. Vogl TJ, Mack MG, Juergens M, et al. MR diagnosis of head and neck tumors: comparison of contrast enhancement with triple-dose gadodiamide and standard-triple-dose gadopentate dimeglumine in the same patients.AJR Am J Roentgenol1994;163:425– 432 5. Joe VQ, Westesson PL. Tumors of the parotid gland: MR imaging
characteristics of various histologic types.AJR Am J Roentgenol 1994;163:433– 438
6. Barakos JA. Advances in magnetic resonance imaging of the head and neck.Top Magn Reson Imaging1994;6:155–165 7. Takashima S, Noguchi Y, Okumura T, Aruga H, Kobayashi T.
Dynamic MR imaging in the head and neck.Radiology1993;189: 813– 821
8. Tien RD, Hesselink JR, Szumowski J. Improved detection and delineation of head and neck lesions with fat suppression spin-echo MR imaging.AJNR Am J Neuroradiol1991;12:19 –24 9. Lufkin RB, Hanfee W. MRI of the head and neck. Magn Reson
Imaging1988;6:69 – 88
10. Tien RD, Hesselink JR, Szumowski J. Improved detection and delineation of head and neck lesions with fat-suppression spin-echo MR imaging.AJNR Am J Neuroradiol1991;12:19 –24 11. Zoarski GH, Mackey JK, Anzai Y, et al. Head and neck: initial
clinical experience with fast spin-echo imaging.Radiology1993; 188:323–328
12. Chaudhuri R, Bingham JB, Crossman J, Gleeson MJ. MR imaging of the parotid gland using the STIR sequence and gadolinium-enhanced imaging.Clin Otolaryngol1992;17:211–217
13. Sigal R, Monnet O, Baere Td, et al. Adenoid cystic carcinoma of the head and neck: evaluation with MR imaging and clinical-pathologic correlation in 27 patients.Radiology 1992;184:95– 101
14. Vogl TJ, Dresel SH, Spath M, Grevers G, Schedel HK, Lissner J. Parotid gland: plain and gadolinium-enhanced MR imaging. Radi-ology1990;177:667– 674
15. Tien RD. Fat-suppression MR imaging in neuroradiology: tech-niques and clinical application.AJR Am J Roentgenol1992;158: 369 –379
16. Catasca JV, Mirowitz SA. T2-weighted MR imaging of the abdo-men: fast spin-echo vs conventional spin-echo sequences.AJR Am J Roentgenol1994;162:61– 67
18. Constable RT, Smith RC, Gore JC. Signal-to-noise and contrast in fast spin echo (FSE) and inversion-recovery FSE imaging. J Comput Assist Tomogr1992;16:41– 47
19. Jolesz FA, Higuchi N, Oshio K, et al. Clinical implementation of fast spin-echo imaging.Radiology1991;181:164 –165
20. Jones KM, Mulkern RV, Schwartz RB, et al. Fast spin-echo MR imaging of the brain and spine: current concepts. AJR Am J Roentgenol1992;158:1313–1320
21. Mirowitz SA. Fast scanning and fat-suppression MR imaging of musculoskeletal disorders.AJR Am J Roentgenol1993;161:1147 22. Nghiem HV, Herkens RJ, Francis IR, et al. The pelvis: T2-weighted
fast spin-echo MR imaging.Radiology1992;185:213–217
23. Fulbright R, Panush D, Sze G, Smith RC, Constable RT. MR of the head and neck: comparison of fast spin-echo and conventional spin-echo sequences.AJNR Am J Neuroradiol1994;15:767–773 24. Barakos JA. Orbit, skull base, and pharynx: contrast-enhanced
fat suppression MR imaging.Radiology1991;179:191–198 25. Anzai Y, Lufkin RB, Jabour BA, Hanafee WN. Fat suppression