Using Hypothesis Selection Based Features for Confusion Network MT
System Combination
Sahar Ghannay LIUM, University of Le Mans
Le Mans, France
Lo¨ıc Barrault
LIUM, University of Le Mans Le Mans, France
Abstract
This paper describes the development op-erated into MANY, an open source sys-tem combination software based on con-fusion networks developed at LIUM. The hypotheses from Chinese-English MT sys-tems were combined with a new version of the software. MANY has been updated in order to use word confidence score and to boostn-grams occurring in input hypothe-ses. In this paper we propose either to use an adapted language model or adding some additional features in the decoder to boost certain n-grams probabilities. Ex-perimental results show that the updates yielded significant improvements in terms of BLEU score.
1 Introduction
MANY (Barrault, 2010) is an open source system combination software based on Confusion Net-works (CN). The combination by confusion net-works generates an exponential number of hy-potheses. Most of these hypotheses contain n -grams do not exist in input hypotheses. Some of these newn-grams are ungrammatical, despite the presence of a language model. These novel n -grams are due to errors in hypothesis alignment and the confusion network structure. In section 3 we present two methods used to boostn-grams present in input hypotheses.
Currently, decisions taken by the decoder mainly depend on the language model score, which is deemed insufficient to precisely evaluate the hypotheses. In consequence, it is interesting to estimate a score for better judging their qual-ity. The challenge of our work is to exploit certain parameters defined by (Almut Siljaand and Vogel, 2008) to calculate word confidence score. These features are detailed in section 4. The approach is
evaluated on the internal data of the BOLT project. Some experiments have been performed on the Chinese-English system combination task. The experimental results are presented in section 5. Before that, a quick description of MANY, includ-ing recent developments can be found in section 2.
2 System description
MANY is a system combination software (Bar-rault, 2010) based on the decoding of a lattice made of several Confusion Networks (CN). This is a widespread approach in MT system combina-tion, seee.g. (Antti-Veikko I.Rosti and Schwartz, 2007; Damianos Karakos and Dreyer, 2008; Shen et al., 2008; Antti-Veikko I. Rosti and Schw, 2009). MANY can be decomposed in two main modules. The first one is the alignment module which is a modified version of TERp (Matthew G. Snover and Schwartz, 2009). Its role is to in-crementally align the hypotheses against a back-bone in order to create a confusion network. 1-best hypotheses from allM systems are aligned in or-der to buildM confusion networks (one for each system considered as backbone). These confusion networks are then connected together to create a lattice. This module uses different costs (which corresponds to a match, an insertion, a deletion, a substitution, a shift, a synonym and a stem) to compute the best alignment and incrementally build a confusion network. In the case of confu-sion network, the match (substitution, synonym, and stem) costs are considered when the word in the hypothesis matches (is a substitution, a syn-onym or a stem of) at least one word of the consid-ered confusion sets in the CN. The second module is the decoder. This decoder is based on the token pass algorithm and it accepts as input the lattice previously created. The probabilities computed in the decoder can be expressed as follow :
log(Pw) =
X
i
αilog(hi(t)) (1)
wheretis the hypothesis, theαiare the weights of
the feature functionshi.
The following features are considered for de-coding:
• The language model probability: the proba-bility given by a 4-gram language model.
• The word penalty: penalty depending on the size (in words) of the hypothesis.
• The null-arc penalty: penalty depending on the number of null-arcs crossed in the lattice to obtain the hypothesis.
• System weights: each system receives a weight according to its importance. Each word receives a weight corresponding to the sum of the weights of all systems which pro-posed it.
Our goal is to include the following ones:
• Word confidence score: each word is given a score, which is the combination of the three scores described in section 4 (equation 7).
• n-gram count: number ofn-grams present in input hypotheses for each combined hypoth-esis.
In most cases, the new features have best weights according to MERT (e.g. the best decoding weights of these features by com-bining two systems are: lm-weight: 0.049703, word-penalty: 0.0605602, null-penalty: 0.319905, weight-word-score: -0.378226, weight-ngram-count: -0.11687, priors: 0.0141794#-0.0605561).
3 boostn-grams
We defined two methods to boostn-grams present in input hypotheses. The first one is adding the count ofbiortri-grams like a new feature to the decoder as mentioned in Section 2. The second method is using an adapted language model (LM) to decode the lattice, in order to modifyn-grams probabilities, that have been observed in input hy-potheses.
Language models
Three 4-gram language models named LM-Web, LM-TuneandLM-Test, are used to interpolate the adapted LM. They were trained respectively on the English web Corpus and the system outputs : de-velopment and test sets (except their references) involved in system combination, using the SRILM Toolkit (Stolcke, 2002). The resulting model from the interpolation of LM-Tune and LM-Test is in-terpolated linearly with the LM-Web to build the adapted LM. These models are tuned to minimize the perplexity on the tune reference.
4 Word confidence score
The best hypothesis selection relies on several features. In (Barrault, 2011) decisions taken by the decoder depend mainly on an-gram language model, but it is sometimes insufficient to evaluate correctly the quality of the hypotheses. In order to improve these decisions, some additional infor-mation should be used. Several researches pre-sented some studies of confidence scores at word and sentence level, such as (Almut Siljaand and Vogel, 2008) and (Ueffing and Ney, 2007). A large set of confidence scores were calculated over the
n-best list. (Almut Siljaand and Vogel, 2008) de-fines several features extracted fromn-best lists (at the sentence level) to select the best hypothesis in a combination approach via hypothesis selection. The challenge of our work is to exploit these fea-tures to estimate a confidence score at the word level and injecting it into the confusion networks. The following features are considered:
Word agreement score based on a window of sizetaround positioni
This score represents the relative frequency of hy-potheses in then-best lists containing the worde
in a window of sizet around the positioni. It is computed as follows:
WAk(ei,t) = N1 k
Nk
X
p=0
f(ep,ip,i+−tt, e) (2)
whereNKis the number of hypotheses in the
n-best list for the corresponding source sentencek, t={0, 1 or 2}andf(Sij, w)=1 ifwappears in the word sequenceSij.
Whentequals 0, this means thati = t, then this score only depends on words at the exact position
WAk(ei) = N1 k
Nk
X
p=0
f(ep,i, e) (3)
The two equations described above, are handled in our contribution, thus the final word agreement score is the average between them if WAk(ei)6= 0
otherwise it is equal to WAk(ei,t)score.
Position independentn-best Listn-gram Agreement
This score represents the percentage of hypothe-ses in the n-best lists that contain the n-gram
ei
i−(n−1), independently of its position in the
sen-tence, as shown in Equation 4. For each hypothe-sis then-gram is counted only once.
NAk(eii−(n−1)) = N1
k Nk
X
p=0
f(eii−(n−1), eI1,p) (4)
where f(ei
i−(n−1), eI1,p) = 1 if the n-gram
ei
i−(n−1) exists in thepthhypothesis of then-best
list. We usen-gram lengths of 2 and 3 as two sep-arate features.
The position independent n-best list word agree-ment is the average count ofn-grams that contain the worde. It is computed as:
NAk(ei) = N1 ng
Nng
X
n=0
NAk(eii−(n−1)) (5)
WereNngis the number ofn-grams of hypothesis
k.
N-best listn-gram probability
This score is a traditionaln-gram language model probability. The n-gram probability for a target wordeigiven its historyeii−−1(n−1)is defined as:
NPk(ei|eii−−1(n−1)) = C(e i
i−(n−1))
C(eii−−1(n−1)) (6)
Where C(ei
i−(n−1)) is the count of the n-gram ei
i−(n−1)in then-best list for the hypothesisk.
Then-best list word probability NPk(ei)is the
av-erage of then-grams probabilities that contain the worde.
The word confidence score is computed using these three features as follows:
Sk(ei) =
WAk(ei) + X j∈NG
NAk(ei)j+NPk(ei)j
1 + 2∗ |NG| (7)
whereNGis the set ofn-gram order, experimen-tally defined as NG={2-gram,3-gram}and t = 2. Eachn-gram order in the setNGis considered as a separate feature.
5 Experiments
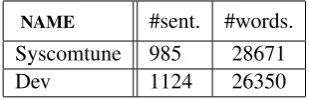
During experiments, data from the BOLT project on the Chinese to English translation task are used. The outputs (200-best lists) of eight translation systems were provided by the partners. The best six systems were used for combination. Syscom-tuneis used as development set andDevas internal test, these corpora are described in Table 1:
NAME #sent. #words.
Syscomtune 985 28671
[image:3.595.339.494.321.371.2]Dev 1124 26350
Table 1: BOLT corpora : number of sentences and words calculated on the reference.
To explore the impact of each new feature on the results, they are tested one by one (added one by one in the decoder) then both, given that, the oldest ones are used in all cases. These tests are named respectivelyboost-ngram,CS-ngramand
Boost-ngram+CS-ngramlater.
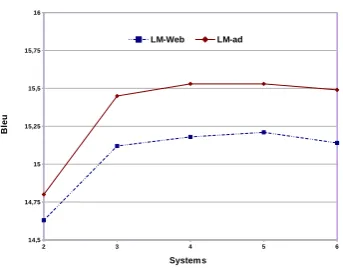
The language model is used to guide the decod-ing in order to improve translation quality, there-fore we evaluated the baseline combination system and each test (described above) with two LMs named LM-Web and LM-ad and compared their perfor-mance in terms of BLEU. By comparing their per-plexities, that are respectively295.43and169.923, we observe a relative reduction of about 42.5%, that results in an improvement of BLEU score.
Figure 1 shows the results of combining the best systems (up to 6) using these models, that achieved respectively an improvement of0.85and 1.17 %BLEU point relatively to the best single system. In the remaining experiments we assume thatMANY-LM-Webis the baseline.
2 3 4 5 6 14,5
14,75 15 15,25 15,5 15,75 16
LM-Web LM-ad
Systems
B
le
[image:4.595.74.246.59.193.2]u
Figure 1: Performance (%BLEU-cased) of MANY after reassessment by LM-Web and LM-ad on the test set.
when the number of systems is varied, that pro-vides varied outputs. In consequence, we observe that using the adapted LM is better than n-gram count feature to boostn-grams, indeed it guaran-teesn-grams quality.
2 3 4 5 6
14,5 14,75 15 15,25 15,5 15,75 16
MANY-LM-ad Boost-2gram-LM-Web Boost-3gram-LM-Web
Systems
B
le
[image:4.595.311.523.96.393.2]u
Figure 2:Comparison ofn-gram boost approaches.
2 3 4 5 6
14,5 14,63 14,75 14,88 15 15,13 15,25 15,38 15,5 15,63 15,75 15,88 16
CM-2g-LM-Web CM-2g+LM-ad CM-3g-LM-Web CM-3g+LM-ad Baseline
systems
B
le
u
Figure 3: The impact of confidence score on the results when using LM-Web and LM-ad for decoding.
The 200-best lists are operated to estimate the word confidence score that contributes the most to the improvement of results when several (up to 6) systems are combined, as described in Figure 3, whatever the language model used, compared to the baseline. In addition, it seems that the
confi-dence score performs better with the adapted LM thanLM-Web.
Systems BLEU
Best single 14.36
Sys2 14.21
Sys3 13.76
Sys4 13.52
Sys5 13.36
Sys6 12.99
MANY+LM-Web(baseline) 15.14 Boost-2gram+LM-Web 15.25 Boost-3gram+LM-Web 15.50 CS-2gram+LM-Web 15.32 CS-3gram+LM-Web 15.26 Boost-2gram+CS-2gram+LM-Web 15.39 Boost-3gram+CS-3gram+LM-Web 15.78
MANY+LM-ad 15.49
Boost-2gram+LM-ad 15.24 Boost-3gram+LM-ad 15.32
CS-2gram+LM-ad 15.72
CS-3gram+LM-ad 15.85
[image:4.595.77.247.330.456.2]Boost-2gram+CS-2gram+LM-ad 15.61 Boost-3gram+CS-3gram+LM-ad 15.74 Table 2:Impact of new features and the adapted LM on the combination result of six systems.
Table 2 summarizes the best experiments re-sults by combining the best six systems on the test set. We observe that new features yield signifi-cant improvements in term of BLEU score what-ever the language model used for decoding. But it is clear that the adapted LM performs rela-tively well in comparison with LM-Web, so the best gains achieved over the best single system and the baseline are respectively1.49and0.71for CS-3-gram+LM-ad.
6 Conclusion
[image:4.595.76.248.505.631.2]References
Hildebrand Almut Siljaand and Stephan Vogel. 2008. Combination of Machine Translation Systems via Hypothesis Selection from Combined N-Best Lists.
Proceedings of the Eighth Conference of the Asso-ciation for Machine Translation in the Americas, pages 254–261.
Spyros Matsoukas Antti-Veikko I. Rosti, Bing Zhang and Richard Schw. 2009. Incremental Hypothe-sis Alignment with Flexible Matching for Building Confusion Networks: BBN System Description for WMT09 System Combination Task. StatMT ’09 Proceedings of the Fourth Workshop on Statistical Machine Translation, pages 61–65.
Spyros Matsoukas Antti-Veikko I.Rosti and Richard Schwartz. 2007. Improved Word-Level System Combination for Machine Translation. Proceedings of the 45th Annual Meeting of the Association of Computational Linguistics, pages 312–319.
Lo¨ıc Barrault. 2010. MANY Open Source Machine Translation System Combination. The Prague Bul-letin of Mathematical Linguistics, pages 147–155. Lo¨ıc Barrault. 2011. MANY improvements for
WMT’11. Proceedings of the Sixth Workshop on Statistical Machine Translation, pages 135– 139. Sanjeev Khudanpur Damianos Karakos, Jason Eisner
and Markus Dreyer. 2008. Machine Translation System Combination using ITG-based Alignments.
In 46th Annual Meeting of the Association for Com-putational Linguistics, pages 81–84.
Bonnie Dorr Matthew G. Snover, Nitin Madnani and Richard Schwartz. 2009. TER-Plus: Paraphrase, semantic, and alignment enhancements to transla-tion edit rate. Machine Translation journal, pages 117–127.
Wade Shen, Brian Delaney, Tim Anderson, and Ray Slyh. 2008. The MIT-LL/AFRL IWSLT-2008 MT System. In Internationnal Workshop on Spoken Language Translation, pages 69–76.
Andreas Stolcke. 2002. Srilm-an extensible lan-guage modeling toolkit. In Proceedings Interna-tional Conference for Spoken Language Processing, Denver, Colorado.