Automatic Scoring of Children's Read-Aloud Text Passages and
Word Lists
Klaus Zechner and John Sabatini and Lei Chen Educational Testing Service
Rosedale Road Princeton, NJ 08541, USA
{kzechner,jsabatini,lchen}@ets.org
Abstract
Assessment of reading proficiency is typically done by asking subjects to read a text passage silently and then answer questions related to the text. An alternate approach, measuring reading-aloud proficiency, has been shown to correlate well with the aforementioned com-mon method and is used as a paradigm in this paper.
We describe a system that is able to automati-cally score two types of children’s read speech samples (text passages and word lists), using automatic speech recognition and the target criterion “correctly read words per minute”. Its performance is dependent on the data type (passages vs. word lists) as well as on the rela-tive difficulty of passages or words for indi-vidual readers. Pearson correlations with human assigned scores are around 0.86 for passages and around 0.80 for word lists.
1 Introduction
It has long been noted that a substantial number of U.S. students in the 10-14 years age group have deficiencies in their reading competence (National Center of Educational Statistics, 2006). With the enactment of the No Child Left Behind Act (2002), interest and focus on objectively assessing and im-proving this unsatisfactory situation has come to the forefront.
While assessment of reading is usually done post-hoc with measures of reading comprehension, di-rect reading assessment is also often performed using a different method, oral (read-aloud) reading. In this paradigm, students read texts aloud and their proficiency in terms of speed, fluency, pro-nunciation, intonation etc. can be monitored di-rectly while reading is in progress. In the reading research literature, oral reading has been one of the best diagnostic and predictive measures of founda-tional reading weaknesses and of overall reading ability (e.g., Deno et al., 2001; Wayman et al., 2007). An association between low reading com-prehension and slow, inaccurate reading rate has been confirmed repeatedly in middle school popu-lations (e.g., Deno & Marsten, 2006). Correpopu-lations consistently fall in the 0.65-0.7 range for predict-ing untimed passage readpredict-ing comprehension test outcomes (Wayman et al., 2007).
In this paper, we investigate the feasibility of large-scale, automatic assessment of read-aloud speech of middle school students with a reasonable degree of accuracy (these students typically attend grades 6-8 and their age is in the 10-14 years range). If possible, this would improve the utility of oral reading as a large-scale, school-based as-sessment technique, making it more efficient by saving costs and time of human annotations and grading of reading errors.
The most widely used measure of oral reading pro-ficiency is “correctly read words per minute” (cwpm) (Wayman et al., 2007). To obtain this measure, students’ read speech samples are first
recorded, then the reading time is determined, and finally a human rater has to listen to the recording and note all reading errors and sum them up. Read-ing errors are categorized into word substitutions, deletions etc.
We have several sets of digitally recorded read-aloud samples from middle school students avail-able which were not collected for use with auto-matic speech recognition (ASR) but which were scored by hand.
Our approach here is to pass the children’s speech samples through an automatic speech recognizer and then to align its output word hypotheses with the original text that was read by the student. From this alignment and from the reading time, an esti-mate for the above mentioned measure of cwpm can then be computed. If the automatically com-puted cwpm measures are close enough to those obtained by human hand-scoring, this process may be employed in real world settings eventually to save much time and money.
Recognizing children’s speech, however, has been shown to be substantially harder than adult speech (Lee et al., 1999; Li and Russell, 2002), which is partly due to children’s higher degree of variability in different dimensions of language such as pro-nunciation or grammar. In our data, there was also a substantial number of non-native speakers of English, presenting additional challenges. We used targeted training and adaptation of our ASR sys-tems to achieve reasonable word accuracies. While for text passages, the word accuracy on unseen speakers was about 72%, it was only about 50% for word lists, which was due in part to a higher percentage of non-native speakers in this data set, to the fact that various sources of noise often pre-vented the recognizer from correctly locating the spoken words in the signal, and also due to our choice of a uniform language model since conven-tional n-gram models did not work on this data with many silences and noises between words.
The remainder of this paper is organized as lows: in Section 2 we review related work, fol-lowed by a description of our data in Section 3. Section 4 provides a brief description of our speech recognizer as well as the experimental setup. Sec-tion 5 provides the results of our experiments, fol-lowed by a discussion in Section 6 and conclusions and future work in Section 7.
2 Related work
Following the seminal paper about the LISTEN project (Mostow et al. 1994), a number of studies have been conducted on using automatic speech recognition technology to score children’s read speech.
Similar to automated assessment of adults’ speech (Neumeyer, Franco et al. 2000; Witt, 1999), the likelihood computed in the Hidden Markov Model (HMM) decoding and some measurements of flu-ency, e.g., speaking rate, are widely used as fea-tures for predicting children’s speaking proficiency. Children’s speech is different than adults’. For example, children’s speech exhibits higher fundamental frequencies (F0) than adults on average. Also, children’s more limited knowledge of vocabulary and grammar results in more errors when reading printed text. Therefore, to achieve high-quality recognition on children’s speech, modifications have to be made on recognizers that otherwise work well for adults.
In the LISTEN project (Mostow et al., 1994), the basic technology is to use speech recognition to classify each word of text as correctly read or not. Such a classification task is hard in that the chil-dren’s speaking deviations from the text may in-clude arbitrary words and non-words. In a study, they modeled variations by the modification of the lexicon and the language model of the Sphinx1 speech recognizer.
Recently, the Technology Based Assessment of Language and Literacy project (TBALL, (Alwan, 2007)) has been attempting to assess and evaluate the language and literacy skills of young children automatically. In the TBALL project, a variety of tests including word verification, syllable blending, letter naming, and reading comprehension, are jointly used. Word verification is an assessment that measures the child’s pronunciation of read-aloud target words. A traditional pronunciation verification method based on log-likelihoods from HMM models is used initially (Tepperman et al., 2006). Then an improvement based on a Bayesian network classifier (Tepperman et al., 2007) is
1
ployed to handle complicated errors such as pro-nunciation variations and other reading mistakes.
Many other approaches have been developed to further improve recognition performance on chil-dren’s speech. For example, one highly accurate recognizer of children’s speech has been developed by Hagen et al. (2007). Vocal tract length normali-zation (VTLN) has been utilized to cope with the children‘s different acoustic properties. Some spe-cial processing techniques, e.g., using a general garbage model to model all miscues in speaking, have been devised to improve the language model used in the recognition of children’s speech (Li et al., 2007).
3 Data
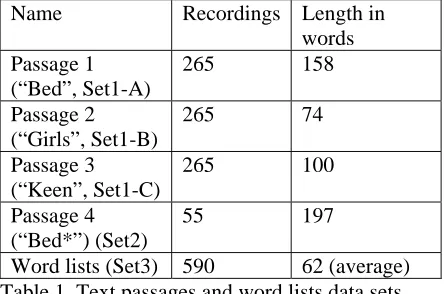
For both system training and evaluation, we use a data set containing 3 passages read by the same 265 speakers (Set1) and a fourth passage (a longer version of Passage 1), read by a different set of 55 speakers (Set2). Further, we have word lists read by about 500 different speakers (Set3). All speak-ers from Set12 and most (84%) from the third set were U. S. middle school students in grades 6-8 (age 10-14). A smaller number of older students in grades 10-12 (age 15-18) was also included in the third set (16%).3 4
In terms of native language, about 15% of Set1 and about 76% of Set35 are non-native speakers of English or list a language different from English as their preferred language.
Table 1 provides the details of these data sets. In the word lists data set, there are 178 different word lists containing 212 different word types in total (some word lists were read by several different students).
All data was manually transcribed using a spread-sheet where each word is presented in one line and the annotator, who listens to the audio file, has to
2
For Set1, we have demographics for 254 of 265 speakers (both for grade level and native language).
3
Grade demographics are available for 477 speakers of Set3.
4
We do not have demographic data for the small Set2 (55 speakers).
5
This set (Set 3) has information on native language for 165 speakers.
mark-up any insertions, substitutions or deletions by the student.
Name Recordings Length in words
Passage 1 (“Bed”, Set1-A)
265 158
Passage 2 (“Girls”, Set1-B)
265 74
Passage 3 (“Keen”, Set1-C)
265 100
Passage 4 (“Bed*”) (Set2)
55 197
[image:3.612.313.535.116.263.2]Word lists (Set3) 590 62 (average) Table 1. Text passages and word lists data sets.
For ASR system training only, we additionally used parts of the OGI (Oregon Graduate Institute) and CMU (Carnegie Mellon University) Kids data sets as well (CSLU, 2008; LDC, 1997).
4 ASR system and experiments
The ASR system’s acoustic model (AM) was trained using portions of the OGI and CMU Kids’ corpora as well as a randomly selected sub-set of our own passage and word list data sets described in the previous section. About 90% of each data set (Set1, Set2, Set3) was used for that purpose. Since the size of our own data set was too small for AM training, we had to augment it with the two men-tioned corpora (OGI, CMU Kids), although they were not a perfect match in age range and accent. All recordings were first converted and down-sampled to 11 kHz, mono, 16 bit resolution, PCM format. There was no speaker overlap between training and test sets.
reading mistakes not already encountered in the human transcriptions of the training set.
For the word lists, a trigram LM was found to be not working well since the words were spoken in isolation with sometimes significant pauses in be-tween and automatic removal of these silences proved too hard given other confounding factors such as microphone, speaker, or background noise. Therefore it was decided to implement a grammar LM for the word list decoder where all possible words are present in a network that allows them to occur at any time and in any sequence, allowing for silence and/or noises in between words. This model with uniform priors, however, has the dis-advantage of not including any words not present in the word list training set, such as common mis-pronunciations and is therefore more restrictive than the LM for text passages.
One could make the argument of using forced alignment instead of a statistical LM to determine reading errors. In fact, this approach is typically used when assessing the pronunciation of read speech. However, in our case, the interest is more in determining how many words were read cor-rectly in the sequence of the text (and how fast they were read) as opposed to details in pronuncia-tion. Further, even if we had confidence scores attached to words in forced alignment, deciding on which of the words obtained low confidence due to poor pronunciation or due to substitution would not be an easy decision. Finally, word deletions and insertions, if too frequent, might prevent the forced alignment algorithm from terminating.
After training was complete, we tested the recog-nizer on the held-out passage and word list data. After recognizing, we computed our target meas-ure of “correct words per minute” (cwpm) accord-ing to the followaccord-ing formula (W= all words in a text, S= substitutions, D= deletions, T= reading time in minutes), performing a string alignment between the recognizer hypothesis and the passage or word list to be read:
(1) cwpm W S D T
− −
=
The reason that insertions are not considered here is that they contribute to an increase in reading
time and therefore can be considered to be ac-counted for already in the formula.
Next, we performed an experiment that looks at whether automatic scoring of read-aloud speech allows for accurate predictions of student place-ments in broad cohorts of reading proficiency.
[image:4.612.311.534.337.421.2]We then also look more closely at typical errors made by human readers and the speech recognizer. All these experiments are described and discussed in the following section.
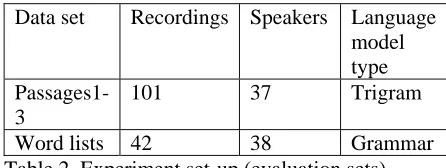
Table 2 describes the set-up of the experiments. Note that Passage4 (Set2) was included only in the training but not in the evaluation set since this set was very small. As mentioned in the previous sec-tion, most speakers from the passage sets read more than one passage and a few speakers from the word lists set read more than one word list.
Data set Recordings Speakers Language model type
Passages1-3
101 37 Trigram
Word lists 42 38 Grammar Table 2. Experiment set-up (evaluation sets).
5 Results
5.1 Overall results
Table 3 depicts the results of our evaluation run with the ASR system described above. Word accu-racy is measured against the transcribed speaker reference (not against the true text that was read). Word accuracy is computed according to Equation (2), giving equal weight to reference and ASR hy-pothesis (c=correct, s=substitutions, d=deletions, i=insertions). This way, the formula is unbiased with respect to insertions or deletions:
(2) 0.5 100.0
c c
wacc
c s d c s i
⎛ ⎞
= × ×⎜ + ⎟
+ + + +
Data set Recordings Speakers Average word Accuracy over all speech sample
Minimum word accuracy on a speech sample
Maximum word accuracy on a speech sample
All Passages (1-3)
101 37 72.2 20.4 93.8
Passage1 (“Bed”)
28 28 70.8 20.4 83.6
Passage2 (“Girls”)
36 36 64.1 25.4 85.7
Passage3 (“Keen”)
37 37 77.7 27.4 93.8
[image:5.612.71.537.102.256.2]Word lists 42 38 49.6 10.8 78.9
Table 3. ASR experiment results (word accuracies in percent)
The typical run-time on a 3.2GHz Pentium proces-sor was less than 30 seconds for a recording (faster than real time).
We next compute cwpm measures for both human annotations (transcripts, “gold standard”) and ma-chine (ASR) hypotheses
Human annotators went over each read passage and word list and marked all reading errors of the speakers (here, only deletions and substitutions are relevant). The reading time is computed directly from the speech sample, so machine and human cwpm scores only differ in error counts of dele-tions and substitudele-tions. Currently we only have one human annotation available per speech sample, but we aim to obtain a second annotation for the pur-pose of determining inter-annotator agreement.
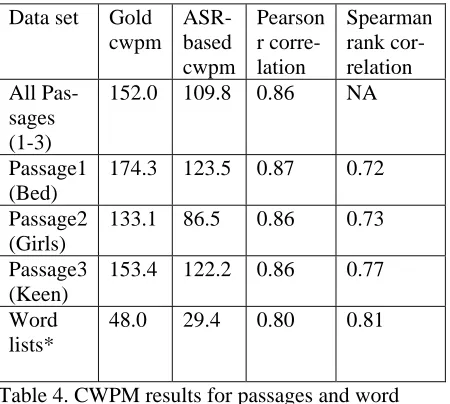
Table 4 presents the overall results of comparing machine and human cwpm scoring. We performed both Pearson correlation as well as Spearman rank correlation. While the former provides a more ge-neric measure of cwpm correlation, the latter fo-cuses more on the question of the relative performance of different speakers compared to their peers which is usually the more interesting question in practical applications of reading as-sessment. Note that unlike for Table 3, the ASR hypotheses are now aligned with the text to be read since in a real-world application, no human tran-scriptions would be available.
We can see that despite the less than perfect recog-nition rate of the ASR system which causes a much
lower average estimate for cwpm or cw (for word-lists), both Pearson and Spearman correlation coef-ficients are quite high, all above 0.7 for Spearman rank correlation and equal to 0.8 or higher for the Pearson product moment correlation. This is en-couraging as it indicates that while current ASR technology is not yet able to exactly transcribe children’s read speech, it is
Data set Gold cwpm
ASR-based cwpm
Pearson r corre-lation
Spearman rank cor-relation All
Pas-sages (1-3)
152.0 109.8 0.86 NA
Passage1 (Bed)
174.3 123.5 0.87 0.72
Passage2 (Girls)
133.1 86.5 0.86 0.73
Passage3 (Keen)
153.4 122.2 0.86 0.77
Word lists*
[image:5.612.314.539.390.592.2]48.0 29.4 0.80 0.81
Table 4. CWPM results for passages and word lists. All correlations are significant at p<0.01. *For word lists, we use “cw” (correct words, nu-merator of Equation (1)) as the measure, since stu-dents were not told to be rewarded for faster reading time here.
which can help to quickly and automatically assess reading proficiencies of students.
5.2 Cohort assignment experiment
To follow up on the encouraging results with basic and rank correlation, we conducted an experiment to explore the question of practical importance whether the automatic system can assign students to reading proficiency cohorts automatically. For better comparison, we selected those 27 stu-dents from 37 total who read all 3 passages (Set 1) and grouped them into three cohorts of 9 students each, based on their human generated cwpm score for all passages combined: (a) proficient (cwpm>190), (b) intermediate (135<cwpm<190), and (c) low proficient (cwpm<135).
We then had the automatic system predict each student’s cohort based on the cwpm computed from ASR. Since ASR-based cwpm values are co-nsistently lower than human annotator based cwpm values, the automatic cohort assignment is not based on the cwpm values but rather on their rank-ing.
The outcome of this experiment is very encourag-ing in that there were no cohort prediction errors by the automatic system. While the precise ranking differs, the system is very well able to predict overall cohort placement of students based on cwpm.
5.3 Overall comparison of students’ reading er-rors and ASR recognition erer-rors
To look into more detail of what types of reading errors children make and to what extent they are reflected by the ASR system output, we used the sclite-tool by the National Institute for Standards and Technology (NIST, 2008) and performed two alignments on the evaluation set:
1. TRANS-TRUE: Alignment between human transcription and true passage or word list text to be read: this alignment informs us about the kinds of reading errors made by the students.
2. HYPO-TRANS: Alignment between the ASR hypotheses and the human transcriptions; this alignment informs us of ASR errors. (Note that this is different from the experiments reported in Table 4 above where we aligned the ASR hypotheses with the true reference texts to compute cwpm.)
Table 5 provides general statistics on these two alignments.
Data set Alignment SUB DEL INS
Passages 1-3
TRANS-TRUE
2.0% 6.1% 1.8%
Pas-sages1-3
HYPO-TRANS
18.7% 9.6% 8.1%
Word lists
TRANS-TRUE
5.6% 6.2% 0.6%
Word lists
HYPO-TRANS
42.0% 8.9% 6.4%
Table 5. Word error statistics on TRANS-TRUE and HYPO-TRANS alignments for both evaluation data sets.
From Table 5 we can see that while for students, deletions occur more frequently than substitutions and, in particular, insertions, the ASR system, due to its imperfect recognition, generates mostly sub-stitutions, in particular for the word lists where the word accuracy is only around 50%.
Further, we observe that the students’ average reading word error rate (only taking into account substitutions and deletions as we did above for the cwpm and cw measures) lies around 8% for pas-sages and 12% for wordlists (all measured on the held-out evaluation data).
5.4 Specific examples
Next, we look at some examples of frequent confu-sion pairs for those 4 combinations of data sets and alignments. Table 6 lists the top 5 most frequent confusion pairs (i.e., substitutions).
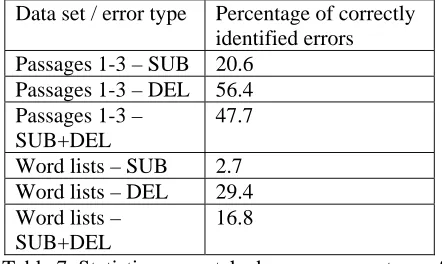
Finally, we look at a comparison between errors made by the students and the fraction of those cor-rectly identified by the ASR system in the recogni-tion hypotheses. Table 7 provides the statistics on these matched errors for text passages and word lists. Data set Align-ment Refer-ence Spoken/ recog-nized Count Pas-sages 1-3 TRANS -TRUE asks savings projects teacher’s time ask saving project teacher times 6 5 4 4 4 Pas-sages 1-3 HYPO-TRANS storm lee’s lee’s observer thousand storms be we and the 11 6 6 6 6 Word lists TRANS -TRUE nature over-sleep equality linear ware-housed Natural overslept equally liner ware-house 6 5 4 4 3 Word lists HYPO-TRANS plan see simple unoffi-cial loud planned season example competi-tion through-out 8 6 6 5 4
Table 6. Top 5 most frequent confusion pairs for passages and word list evaluation sets in two dif-ferent alignments. For passages, substitutions among closed class words such as determiners or prepositions are omitted.
Table 7 shows that while for text passages, almost half of the relevant errors (substitutions and dele-tions) were correctly identified by the recognizer, for word lists, this percentage is substantially smaller.
6 Discussion
The goal of this paper is to evaluate the possibility of creating a system for automatic oral reading as-sessment for middle school children, based on text passages and word lists.
We decided to use the common reading profi-ciency measure of “correct words per minute” which enables us to align ASR word hypotheses with the correct texts, estimate cwpm based on this alignment and the reading time, and then compare the automatically estimated cwpm with human an-notations of the same texts.
Data set / error type Percentage of correctly identified errors Passages 1-3 – SUB 20.6
Passages 1-3 – DEL 56.4 Passages 1-3 –
SUB+DEL
47.7
Word lists – SUB 2.7 Word lists – DEL 29.4 Word lists –
SUB+DEL
[image:7.612.312.533.262.394.2]16.8
Table 7. Statistics on matched errors: percentage of students’ reading errors (substitutions and dele-tions) that were also correctly identified by the ASR system.
We built a recognizer with an acoustic model based on CMU and OGI kids’ corpora as well as about 90% of our own text passages and word list data (Sets 1-3). For the in-context reading (text passages) we trained a trigram model focused mostly on transcriptions of the passages. For the out-of-context isolated word reading, we used a grammar language model where every possible word of the word lists in the training set can follow any other word at any time, with silence and/or noise between words. (While this was not our pre-ferred choice, standard n-gram language models performed very poorly given the difficulty of re-moving inter-word silences or noise automati-cally.)
prob-lematic and we conjecture that the two main rea-sons for the worse performance were (a) the ab-sence of time stamps for the location of words which made it sometimes hard for the recognizer to locate the correct segment in the signal for word decoding (given noises in between), and (b) the sometimes poor recording conditions where vol-umes were set too high or too low, too much back-ground or speaker noise was present etc. Further, the high relative number of non-native speakers in that data set may also have contributed to the lower word accuracy of the word lists.
While the current data collection had not been done with speech recognition in mind, in future data collection efforts, we will make sure that the sound quality of recordings is better monitored, with some initial calibration, and that we store time stamps when words are presented on the screen to facilitate the recognition task and to allow the rec-ognizer to expect one particular word at one par-ticular point in time.
Despite imperfect word accuracies, however, for both passages and word lists we found encourag-ingly high correlations between human and auto-matic cwpm measures (cw measures for word lists). Obviously, the absolute values of cwpm dif-fer greatly as the ASR system generates many more errors on average than the readers, but both Pearson correlation as well as Spearman rank cor-relation measures are all above 0.7. This means that if we would use our automatic scoring results to rank students’ reading proficiency, the ranking order would be overall quite similar to an order produced by human annotators. This observation about the rank, rather than the absolute value of cwpm, is important in so far as it is often the case that educators are interested in separating “co-horts” of readers with similar proficiency and in particular to identify the lowest performing cohort for additional reading practice and tutoring.
An experiment testing the ability of the system to place students into three reading proficiency co-horts based on cwpm was very encouraging in that all 27 students of the test set were placed in the correct cohort by the system.
When we compare frequent student errors with those made by the machine (Table 6), we see that often times, students just substitute slight morpho-logical variants (e.g., “ask” for “asks”), whereas in the ASR system, errors are typically more complex than just simple substitutions of morphological
variants. However, in the case of word lists, we do find substitutions with related phonological content in the ASR output (e.g., “example” for “simple”). Finally, we observed that, only for the text pas-sages, the ASR system could correctly identify a substantial percentage of readers’ substitutions and deletions (about 48%, see Table 7). This is also encouraging as it is a first step towards meaningful feedback in a potential interactive setting. How-ever, we here only look at recall – because of the much larger number of ASR substitutions, preci-sion is much lower and therefore the risk of over-correction (false alarms) is still quite high.
Despite all of the current shortcomings, we feel that we were able to demonstrate a “proof-of-concept” with our initial system in that we can use our trained ASR system to make reliable estimates on students’ reading proficiency as measured with “correct words per minute”, where correlations between human and machine scores are in the 0.80-0.86 range for text passages and word lists.
7 Conclusions and future work
This paper demonstrates the feasibility of building an automatic scoring system for middle school stu-dents’ reading proficiency, using a targeted trained speech recognition system and the widely used measure of “correctly read words per minute” (cwpm).
The speech recognizer was trained both on external data (OGI and CMU kids’ corpora) and internal data (text passages and word lists), yielding two different modes for text passages (trigram language model) and word lists (grammar language model). Automatically estimated cwpm measures agreed closely with human cwpm measures, achieving 0.8 and higher correlation with Pearson and 0.7 and higher correlation with Spearman rank correlation measures.
Acknowledgements
The authors would like to acknowledge the contri-butions of Kathy Sheehan, Tenaha O’Reilly and Kelly Bruce to this work. We further are grateful for the useful feedback and suggestions from our colleagues at ETS and the anonymous reviewers that greatly helped improve our paper.
References
Alwan, A. (2007). A System for Technology Based Assessment of Language and Literacy in Young Children: the Role of Multiple Information Sources. Proceedings of MMSP, Greece.
Center for Spoken Language Understanding (CSLU), 2008. Kids’ Speech Corpus, http://www.cslu.ogi.edu/corpora/kids/.LDC, BN.
Deno, S. L., Fuchs, L. S., Marston, D., & Shin, J. (2001). Using curriculum-based measurements to establish growth standards for students with learning disabilities. School Psychology Re-view, 30(4), 507-524.
Deno, S. L. and D. Marsten (2006). Curriculum-based measurement of oral reading: An indicator of growth in fluency. What Research Has to Say about Fluency Instruction. S. J. Samuels and A. E. Farstrup. Newark, DE, International Reading Association: 179-203.
Hagen, A., B. Pellom, & R. Cole. (2007). "Highly accurate children’s speech recognition for inter-active reading tutors using subword units." Speech Communication 49(6): 861-873.
Lee, S., A. Potamianos, & S. Narayanan. (1999). "Acoustics of children's speech: developmental changes of temporal and spectral parameters." Journal of Acoustics Society of American (JASA) 105: 1455-1468.
Li, X., Y. C. Ju, L. Deng & A. Acero. (2007). Effi-cient and Robust Language Modeling in an Automatic Children's Reading Tutor System. Proc. IEEE International Conference on Acous-tics, Speech and Signal Processing ICASSP 2007.
Li, Q. and M. Russell (2002). An analysis of the causes of increased error rates in children's speech recognition. ICSLP. Denver, CO.
Linguistic Data Consortium (LDC), 1997. 1996 English Broadcast News Speech (HUB4), LDC97S44.
Linguistic Data Consortium (LDC), 1997. The CMU Kids Corpus, LDC97S63.
Mostow, J., S. F. Roth, G. Hauptmann & M. Kane. (1994). A prototype reading coach that listens. AAAI '94: Proceedings of the twelfth national conference on Artificial intelligence, Menlo Park, CA, USA, American Association for Arti-ficial Intelligence.
National Center of Educational Statistics. (2006). National Assessment of Educational Progress. Washington DC: U.S. Government Printing Of-fice.
National Institute for Standards and Technology (NIST), 2008. Sclite software package. http://www.nist.gov/speech/tools/
Neumeyer, L., H. Franco, V. Digalakis & M. Weintraub. (2000). "Automatic Scoring of Pro-nunciation Quality." Speech Communication 6.
No Child Left Behind Act of 2001, Pub. L. No. 107-110, 115 Stat. 1425 (2002).
Tepperman, J., J. Silva, A. Kazemzadeh, H. You, S. Lee, A. Alwan & S. Narayanan. (2006). Pro-nunciation verification of children's speech for automatic literacy assessment. INTERSPEECH-2006. Pittsburg, PA.
Tepperman, J., M. Black, P. Price, S. Lee, A. Ka-zemzadeh, M. Gerosa, M. Heritage, A. Alwan & S. Narayanan.(2007). A bayesian network clas-sifier for word-level reading assessment. Pro-ceedings of ICSLP, Antwerp, Belgium.
Wayman, M. M., Wallace, T., Wiley, H. I., Ticha, R., & Espin, C. A. (2007). Literature synthesis on curriculum-based measurement in reading. The Journal of Special Education, 41(2), 85-120.