Class error rates for evaluation of machine translation output
Maja Popovi´c
German Research Center for Artificial Intelligence (DFKI) Language Technology (LT), Berlin, Germany
Abstract
We investigate the use of error classification results for automatic evaluation of machine translation output. Five basic error classes are taken into account: morphological errors, syn-tactic (reordering) errors, missing words, ex-tra words and lexical errors. In addition, lear combinations of these categories are in-vestigated. Correlations between the class er-ror rates and human judgments are calculated on the data of the third, fourth, fifth and sixth shared tasks of the Statistical Machine Trans-lation Workshop. Machine transTrans-lation outputs in five different European languages are used: English, Spanish, French, German and Czech. The results show that the following combina-tions are the most promising: the sum of all class error rates, the weighted sum optimised for translation into English and the weighted sum optimised for translation from English.
1 Introduction
Recent investigations have shown that it is possi-ble to carry out a reliapossi-ble automatic error analysis of a given translation output in order to get more information about actual errors and details about particular strengthnesses and weaknesses of a sys-teml (Popovi´c and Ney, 2011). The obtained results correlate very well with the human error classifica-tion results. The quesclassifica-tion we try to answer is: how the class error rates correlate with the human eval-uation (ranking) results? As a first step, we inves-tigate the correlations of five basic class error rates with human rankings. In the next step, linear
com-binations (sums) of basic class error rates are inves-tigated.
Spearman’s rank correlation coefficients on the document (system) level between all the metrics and the human ranking are computed on the English, French, Spanish, German and Czech texts gener-ated by various translation systems in the frame-work of the third (Callison-Burch et al., 2008), fourth Burch et al., 2009), fifth (Callison-Burch et al., 2010) and sixth (Callison-(Callison-Burch et al., 2011) shared translation tasks.
2 Class error rates
In this work, the method proposed in (Popovi´c and Ney, 2011) is used, i.e. classification of the translation errors into five basic categories based on the Word Error Rate (WER) (Levenshtein, 1966) together with the recall- and precision-based Position-independent Error Rates called Reference PER(RPER) and HypothesisPER(HPER).
As a result of an error classification, two values are usually of interest: raw error counts for each er-ror class, and erer-ror rates for each class, i.e. raw erer-ror counts normalised over the total number of running words. Which of the values is preferred depends of the exact task. For example, if only a distribution of error types within a translation output is of in-terest, the raw error counts are sufficient. On the other hand, if we want to compare different transla-tion outputs, normalised values i.e. error rates are more suitable. Therefore they are appropriate candi-dates to be used for the evaluation task.
In this work, we explore the error rates calculated on the word level as well as on the block level, where
a group of consecutive words labelled with the same error category is called a block. The normalisation in both cases is carried out over the total number of running words. Therefore the block level error rate for a particular error class is always less or equal than the corresponding word level error rate.
2.1 Basic class error rates
The following five basic class error rates are ex-plored:
INFER (inflectionalerrorrate):
Number of words translated into correct base form but into incorrect full form, normalised over the hypothesis length.
RER (reorderingerrorrate):
Number of incorrectly positioned words nor-malised over the hypothesis length.
MISER (missing worderrorrate):
Number of words which should appear in the translation hypothesis but do not, normalised over the reference length.
EXTER (extra worderrorrate):
Number of words which appear in the transla-tion hypothesis but should not, normalised over the hypothesis length.
LEXER (lexicalerrorrate):
Number of words translated into an incorrect lexical choice in the target language (false dis-ambiguation, unknown/untranslated word, in-correct terminology, etc.) normalised over the hypothesis length.
Table 1 presents an example of word and block level class error rates. Each erroneous word is la-belled with the corresponding error category, and the blocks are marked within the parentheses { and}. The error rates on the block level are marked with a letter “b” at the beginning. It should be noted that the used method at its current stage does not enable assigning multiple error tags to one word.
2.2 Combined error rates (sums)
The following linear combinations (sums) of the ba-sic class error rates are investigated:
reference:
The famous journalist Gustav Chalupa , born in ˇCesk´e Budˇejovice ,
also confirms this .
hypothesis containing 14 running words: The also confirms the famous
Austrian journalist Gustav Chalupa , from Budweis Lamborghini .
hypothesis labelled with error classes: The{alsoorder conf irmsorder}
{theextra} {f amousorder} {Austrianextra} {journalistorder GustavorderChalupaorder},
{f romlexBudweislexLamborghinilex}.
class error rates: word order:
RER= 6/14 = 42.8% bRER= 3/14 = 21.4%
extra words:
EXTER= 2/14 = 14.3% bEXTER= 2/14 = 14.3%
lexical errors:
LEXER= 3/14 = 21.4% bLEXER= 1/14 = 7.1%
Table 1: Example of word and block level class error rates: the word groups within the parentheses{and}are considered as blocks; all error rates are normalised over the hypothesis length, i.e. 14 running words.
WΣER (sumofword levelerrorrates)1:
Sum of all basic class error rates on the word level;
BΣER (sumofblock levelerrorrates):
Sum of all basic class error rates on the block level;
WBΣER (sumofword andblock levelerrorrates):
Arithmetic mean ofWΣERandBΣER.
XENΣER (X→Englishsumoferrorrates): Linear interpolation of word level and block level class error rates optimised for translation into English;
ENXΣER (English→X sumoferrorrates): Linear interpolation of word level and block level class error rates optimised for translation from English.
For the example sentence shown in Table 1, WΣER = 84.7%, BΣER = 46.2% and WBΣER = 65.4%. XENΣERand ENXΣERare weighted sums which will be explained in the next section.
The prerequisite for the use of the described met-rics is availability of an appropriate morphological analyser for the target language which provides base forms of the words.
3 Experiments onWMT2008, 2009, 2010 and 2011 test data
3.1 Experimental set-up
The class error rates described in Section 2 were produced for outputs of translations from Spanish, French, German and Czech into English and vice versa using Hjerson (Popovi´c, 2011), an open-source tool for automatic error classification. Span-ish, French, German and English base forms were produced using the TreeTagger2, and the Czech base
forms using Morˇce (Spoustov´a et al., 2007). In this way, all references and hypotheses were provided with the base forms of the words.
For each error rate, the system level Spearman correlation coefficientsρ with human ranking were calculated for each document. In total, 40 correla-tion coefficients were obtained for each error rate – twelve English outputs from the WMT 2011, 2010 and 2009 task and eight from the WMT2008 task, together with twenty outputs in other four target lan-guages. For further analysis, the obtained corre-lation results were summarised into the following three values:
• mean
average correlation coefficient;
2http://www.ims.uni-stuttgart.de/projekte/corplex/TreeTagger/
• rank>
percentage of documents where the particular error rate has better correlation than the other error rates;
• rank≥
percentage of documents where the particular error rate has better or equal correlation than the other error rates.
3.2 Comparison of basic class error rates
Our first experiment was to compare correlations for the basic set of class error rates in order to investi-gate a general behaviour of each class error rate and to see if some of the error categories are particularly (in)convenient for the evaluation task. Since certain differences between English and non-English trans-lation outputs are observed for some error classes, the values described in the previous section were also calculated separately.
Table 2 presents the results of this experiment. The mean values over all documents, over the En-glish documents and over the non-EnEn-glish docu-ments are shown.
According to the overall mean values, the most promising error categories are lexical and reorder-ing errors. However, the mean values for English outputs are significantly different than those for non-English outputs: the best error classes for non-English are in deed lexical and reordering errors, however for the non-English outputs the inflectional errors and missing words have higher correlations. On the other hand, for the English outputs missing words have even negative correlations, whereas correla-tions for inflectional errors are relatively low. The extra word class seems to be the least convenient in general, especially for non-English outputs.
Therefore, therank≥values were calculated only separately for English and non-English outputs, and the previous observations were confirmed: for the English outputs lexical and reordering errors are the most relevant, whereas for the non-English outputs all classes except extra words are almost equally im-portant.
error mean rank≥
rate overall x→en en→x x→en en→x INFER 0.398 0.190 0.595 46.2 71.7
RER 0.360 0.344 0.373 53.8 51.1
MISER 0.173 -0.101 0.434 26.3 54.4
EXTER 0.032 0.212 -0.195 42.7 12.2 LEXER 0.508 0.669 0.355 86.0 58.3
bINFER 0.423 0.211 0.624 47.9 75.6
bRER 0.508 0.594 0.426 78.3 60.0 bMISER 0.169 -0.121 0.446 21.1 53.9
bEXTER -0.031 0.186 -0.238 36.8 10.0 bLEXER 0.515 0.634 0.402 79.5 62.8
Table 2:meanandrank≥values for each basic word level and block level error rate over all documents, over En-glish documents and over non-EnEn-glish documents.
For example, if the translation reference is “a very good translation”, and the obtained hypothesis is “a translation very good” , one possibility is to mark the word “translation” as reordering error, another possibility is to mark the words “very good” as re-ordering errors, and it is also possible to mark all the words as reordering errors. In such cases, the group-ing of consecutive word level errors into blocks is beneficial.
3.3 Comparison of error rate sums
A first step towards combining the basic class error rates was investigation of simple sums, i.e. WΣER, BΣERas well asWBΣERas arithmetic mean of pre-vious two. The overall average correlation coeffi-cients of the sums were shown to be higher than those of the basic class error rates. Further exper-iments have been carried out taking into account the results described in the previous section. Firstly, ex-tra word class was removed from all sums, however no improvement of correlation coefficients was ob-served. Then the sums containing only the most promising error categories separately for English and non-English output were investigated, but this also resulted in no improvements. Finally, we in-troduced weights for each translation direction ac-cording to the rank≥ value for each of the basic class error rates (see Table 2), and this approach was promising. In this way, the specialised sums XENΣERand ENXΣERwere introduced.
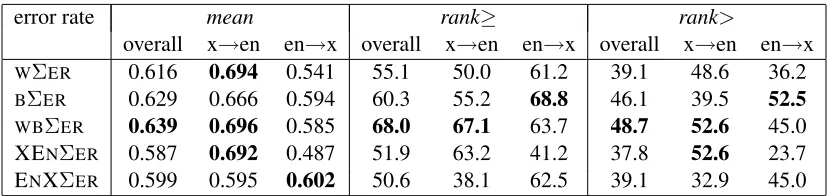
In Table 3 the results for all five error rate sums are presented. mean, rank> andrank≥values are presented over all translation outputs, over English outputs and over non-English outputs. As already mentioned, the overall correlation coefficients of the sums are higher than those of the basic class error rates. This could be expected, since summing class error rates is oriented towards the overall quality of the translation output whereas the class error rates are giving more information about details.
According to the overall values, the best error rate is combination of all word and block level class er-ror rates, i.e. WBΣER followed by the block sum BΣER, whereas theWΣERand the specialised sums XENΣER and ENXΣER have lower correlations. For the translation into English, this error rate is also very promising, followed by the specialised sum XENΣER. On the other hand, for the translation from English, the most promising error rates are the block sumBΣERand the corresponding specialised sum ENXΣER. Following these observations, we decided to submit WBΣER scores for all transla-tion outputs together with XENΣERand ENXΣER scores, each one for the corresponding translation direction. In addition, we submitted BΣER scores since this error rate also showed rather good results, especially for the translation out of English.
4 Conclusions
The presented results show that the error classifica-tion results can be used for evaluaclassifica-tion and ranking of machine translation outputs. The most promis-ing way to do it is to sum all word level and block level error rates, i.e. to produce the WBΣER error rate. This error rate has eventually been submitted to the WMT2012 evaluation task. In addition, the next best metrics have been submitted, i.e. the block level sum BΣER for all translation directions, and the specialised sums XENΣERand ENXΣEReach for the corresponding translation outputs.
The experiments described in this work are still at early stage: promising directions for future work are better optimisation of weights3, further investigation of each language pair and also of each non-English
error rate mean rank≥ rank>
overall x→en en→x overall x→en en→x overall x→en en→x WΣER 0.616 0.694 0.541 55.1 50.0 61.2 39.1 48.6 36.2 BΣER 0.629 0.666 0.594 60.3 55.2 68.8 46.1 39.5 52.5
WBΣER 0.639 0.696 0.585 68.0 67.1 63.7 48.7 52.6 45.0
[image:5.612.99.516.53.151.2]XENΣER 0.587 0.692 0.487 51.9 63.2 41.2 37.8 52.6 23.7 ENXΣER 0.599 0.595 0.602 50.6 38.1 62.5 39.1 32.9 45.0
Table 3: mean,rank≥andrank>values for error rate sums compared over all documents, over English documents and over non-English documents.
target language separately, filtering error categories byPOSclasses, etc.
Acknowledgments
This work has partly been developed within the TARAX ¨U project4 financed by TSB Technologies-tiftung Berlin – Zukunftsfonds Berlin, co-financed by the European Union – European fund for regional development. Special thanks to Mark Fishel and Ondˇrej Bojar.
References
Chris Callison-Burch, Cameron Fordyce, Philipp Koehn, Christof Monz, and Josh Schroeder. 2008. Further Meta-Evaluation of Machine Translation. In Proceed-ings of the 3rd ACL 08 Workshop on Statistical Ma-chine Translation (WMT 2008), pages 70–106, Colum-bus, Ohio, June.
Chris Callison-Burch, Philipp Koehn, Christof Monz, and Josh Schroeder. 2009. Findings of the 2009 Workshop on Statistical Machine Translation. In Pro-ceedings of the Fourth Workshop on Statistical Ma-chine Translation (WMT 2009), pages 1–28, Athens, Greece, March.
Chris Callison-Burch, Philipp Koehn, Christof Monz, Kay Peterson, Mark Przybocki, and Omar Zaidan. 2010. Findings of the 2010 Joint Workshop on Sta-tistical Machine Translation and Metrics for Machine Translation. In Proceedings of the Joint Fifth Work-shop on Statistical Machine Translation and Metrics-MATR (WMT 2010), pages 17–53, Uppsala, Sweden, July.
Chris Callison-Burch, Philipp Koehn, Christof Monz, and Omar Zaidan. 2011. Findings of the 2011 Work-shop on Statistical Machine Translation. In Proceed-ings of the Sixth Workshop on Statistical Machine
4http://taraxu.dfki.de/
Translation (WMT 2011), pages 22–64, Edinburgh, Scotland, July.
Vladimir Iosifovich Levenshtein. 1966. Binary Codes Capable of Correcting Deletions, Insertions and Re-versals. Soviet Physics Doklady, 10(8):707–710, February.
Maja Popovi´c and Hermann Ney. 2011. Towards Au-tomatic Error Analysis of Machine Translation Out-put. Computational Linguistics, 37(4):657–688, De-cember.
Maja Popovi´c. 2011. Hjerson: An Open Source Tool for Automatic Error Classification of Machine Trans-lation Output. The Prague Bulletin of Mathematical Linguistics, (96):59–68, October.