Readability Annotation: Replacing the Expert by the Crowd
Philip van Oosten
LT3, Language and Translation Technology Team, University College Ghent
Groot-Brittanni¨elaan 45, 9000 Ghent, Belgium
Department of Applied Mathematics and Computer Science, Ghent University Krijgslaan 281 (S9), 9000 Ghent, Belgium
V´eronique Hoste
LT3, Language and Translation Technology Team, University College Ghent
Groot-Brittanni¨elaan 45, 9000 Ghent, Belgium Department of Linguistics, Ghent University
Blandijnberg 2, 9000 Ghent, Belgium
Abstract
This paper investigates two strategies for collecting readability assessments, an Ex-pert Readers application intended to collect fine-grained readability assessments from lan-guage experts and a Sort by Readability ap-plication designed to be intuitive and open for everyone having internet access. We show that the data sets resulting from both annota-tion strategies are very similar. We conclude that crowdsourcing is a viable alternative to the opinions of language experts for readabil-ity prediction.
1 Introduction
The task of automatically determining the readabil-ity of texts has a long and rich tradition. This has not only resulted in a large number of readability formu-las (Flesch, 1948; Brouwer, 1963; Dale and Chall, 1948; Gunning, 1952; McLaughlin, 1969), but also to the more recent tendency of using insights from NLP for automatic readability prediction (Schwarm and Ostendorf, 2005; Collins-Thompson and Callan, 2004; Pitler and Nenkova, 2008). Potential appli-cations include the selection of reading material for language learners, automatic essay scoring, the se-lection of online text material for automatic summa-rization, etc.
One of the well-known bottlenecks in data-driven NLP research is the lack of sufficiently large data sets for which annotators provided labels with suffi-cient agreement. Also readability research is faced
with the crucial obstacle that very few corpora of generic texts exist of which reliable readability in-formation is available (Tanaka-Ishii et al., 2010). When constructing such a corpus, the inherent sub-jectivity of the concept of readability cannot be
ig-nored. The ease with which a given reader can
correctly identify the message conveyed in a text is, among other things, inextricably related to the reader’s background knowledge of the subject at hand (McNamara et al., 1993). The construction of a corpus, which can serve as a gold standard against which new scoring or ranking systems can be tested, thus requires a multifaceted approach taking into ac-count both the properties of the text under evaluation and those of the readers. In recent years, a tendency seems to have arisen to also explicitly address this subjective aspect of readability. Pitler and Nenkova (2008), for example, base their readability predic-tion method exclusively on the extent to which read-ers found a text to be “well-written” and Kate et al. (2010) take the assessments supplied by a number of experts as their gold standard, and test their read-ability prediction method as well as assessments by novices against these expert opinions.
In this paper, we report on two methodologies to construct a corpus of readability assessments, which can serve as a gold standard against which new scoring or ranking systems can be tested. Both methodologies were used for collecting readabil-ity assessments of Dutch and English texts. Since these data collection experiments for English only recently started, the focus in this paper will be on
Dutch. By collecting multiple assessments per text, the goal was to level out the reader’s background
knowledge and attitude. We will both report on
a data collection experiment designed for language experts and a simple crowdsourcing experiment.
We will introduce inter-annotator agreement and
calculate K scores in different settings. We will
show that from the two readability assessment appli-cations, two very similar data sets are obtained, with calculations of Pearson correlations of at least 87 %, and conclude that the simple crowdsourcing results are a viable alternative to the assessments resulting from expert labelings.
In section 2, we describe the data from language experts and how those data can be converted to rela-tive assessments. Section 3 outlines a simpler crow-sourcing application and its correspondences with the experts. Finally, in section 4, we draw conclu-sions and give a short summary of future work.
2 Readability assessment by the expert reader
Since readability prediction was initially primarily designed to identify reading material suited to the reading competence of a given individual, most of the existing data sets are drawn from textbooks and other sources intended for different compentence levels (Franc¸ois, 2009; Heilman et al., 2008). For Dutch, for example, the only large-scale experi-mental readability research (Staphorsius and Krom, 1985; Staphorsius, 1994) is limited to texts for
el-ementary school children.1 For English, the
situa-tion is similar as for Dutch, viz. a predominant focus on educational corpora. Recently, an evaluation was designed by LDC in the framework of the DARPA Machine Reading Program (Kate et al., 2010). For this purpose a more general corpus was assembled which was not tailored to a specific audience, genre or domain. Unfortunately, the data are not available for further use. Our research focus is similar and we report on the collection of readability assessments
1
Staphorsius (1994), for instance, who conducted the only large-scale experimental readability research in the Dutch-speaking regions, based his research entirely on cloze-testing. A cloze-test is a reading comprehension test introduced by Rankin (1959) in which test subjects are required to fill in automatically deleted words in an unseen text. It is unclear whether such tasks are actually suitable to estimate the readability of a text.
for a corpus of Dutch text, which will be used for training and evaluating a readability prediction sys-tem.
2.1 Source data
In order to acquire useful data for the construction of
a gold standard, we implemented theExpert
Read-ersapplication intended for language experts. The
texts for the application were chosen from the Lassy corpus (van Noord, 2009), which is syntactically an-notated, and which is currently being enhanced with several layers of semantic annotations (Schuurman et al., 2009). These annotations will allow us in the future to determine the impact of various semantic, syntactic and pragmatic factors on text readability. The small subcorpus consists of 105 texts of be-tween about 100 and 200 words. Most of the texts are extracted from a larger context, but all are mean-ingful by themselves. All texts are in Dutch and most of them originate from Wikipedia or newspa-pers. Further, the corpus contains parts of domaspecific and official documents, manuals, patient in-formation leaflets and others. The texts in the sub-corpus have no readability levels assigned, but they are carefully selected in order to obtain texts with a multitude of readability levels. Because of the lack of a prior readability assessment, the selection was purely based on careful, yet intuitive judgment.
2.2 Application set-up
TheExpert Readersapplication2is designed to
col-lect readability assessments from language experts. They can express their opinion by ranking texts on a scale of 0 (easy) to 100 (difficult), which allows them to compare the texts with each other while at the same time assigning absolute scores. These fine-grained assessments committed by experts are
grouped into submission batches, holding a
num-ber of texts which have been ranked and to which a score has been assigned. For each submitted text, we know who sent it when, with which score and along with which other texts in the same submission batch. The experts can also make use of a so-called frame of reference, in which texts are kept avail-able over different submission batches. The same
2
The Expert Readers application is accessible at the password-protected link http://lt3.hogent.be/
text can occur only once per batch, but can be pre-sented again to the same expert in other batches. Apart from the readability scores and the rankings in the batches, the experts can also enter comments on what makes each text more or less readable.
That allows for qualitative analysis. We did not
ask more detailed questions about certain aspects of readability, because we wanted to avoid influenc-ing the text properties experts pay attention to. Nei-ther did we inform the experts in any way how they should judge readability. Any presumption about which features are important readability indicators was thus avoided. Our main interest is to design a system that is robust enough to model readability as generally as possible.
In the context of our experiments, we regard peo-ple as language experts if they are native readers pro-fessionally involved with the Dutch language. Our current pool of active experts consists of 34 teach-ers, writers and linguists, who have contributed a to-tal of 1862 text scores over 108 submission batches. The experts were all volunteers and were not paid for their work. Their instructions consisted of an ex-planation of how the application works on paper and an instruction movie of a couple of minutes. The sizes of the submission batches range from 5 to all available texts. Batches with less than 5 texts were omitted from the data.
2.3 Text scores converted to text pairs
The Expert Readers application provided a rich, but highly fine-grained output. At first sight, a
straight-forward and intuitive way to work with theExpert
Readersdata would be to use, for example, the mean
readability score assigned to each text. Pitler and Nenkova (2008) and Kate et al. (2010), for example, average out results collected from different readers. However, problems with this approach immediately arise. Results from Anderson and Davison (1986), for example, show for their data set that if the data on which readability formulas are based, were not aggregated on the school grade level but considered at the individual level, their predictive power would drop from around 80% to an estimated 10%.
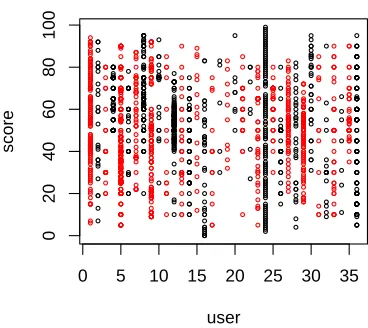
We observed a similar tendency in the results of the expert readers application: Figure 1 illustrates that different experts employ different standards to assign readability scores to texts. Being given the
● ● ● ● ● ● ● ● ● ● ● ● ● ● ● ● ● ● ● ● ● ● ● ● ● ● ● ● ● ● ● ● ● ● ● ● ● ● ● ● ● ● ● ● ● ● ● ● ● ● ● ● ● ● ● ● ● ● ● ● ● ● ● ● ● ● ● ● ● ● ● ● ● ● ● ● ● ● ● ● ● ● ● ● ● ● ● ● ● ● ● ● ● ● ● ● ● ● ● ● ● ● ● ● ● ● ● ● ● ● ● ● ● ● ● ● ● ● ● ● ● ● ● ● ● ● ● ● ● ● ● ● ● ● ● ● ● ● ● ● ● ● ● ● ● ● ● ● ● ● ● ● ● ● ● ● ● ● ● ● ● ● ● ● ● ● ● ● ● ● ● ● ● ● ● ● ● ● ● ● ● ● ● ● ● ● ● ● ● ● ● ● ● ● ● ● ● ● ● ● ● ● ● ● ● ● ● ● ● ● ● ● ● ● ● ● ● ● ● ● ● ● ● ● ● ● ● ● ● ● ● ● ● ● ● ● ● ● ● ● ● ● ● ● ● ● ● ● ● ● ● ● ● ● ● ● ● ● ● ● ● ● ● ● ● ● ● ● ● ● ● ● ● ● ● ● ● ● ● ● ● ● ● ● ● ● ● ● ● ● ● ● ● ● ● ● ● ● ● ● ● ● ● ● ● ● ● ● ● ● ● ● ● ● ● ● ● ● ● ● ● ● ● ● ● ● ● ● ● ● ● ● ● ● ● ● ● ● ● ● ● ● ● ● ● ● ● ● ● ● ● ● ● ● ● ● ● ● ● ● ● ● ● ● ● ● ● ● ● ● ● ● ● ● ● ● ● ● ● ● ● ● ● ● ● ● ● ● ● ● ● ● ● ● ● ● ● ● ● ● ● ● ● ● ● ● ● ● ● ● ● ● ● ● ● ● ● ● ● ● ● ● ● ● ● ● ● ● ● ● ● ● ● ● ● ● ● ● ● ● ● ● ● ● ● ● ● ● ● ● ● ● ● ● ● ● ● ● ● ● ● ● ● ● ● ● ● ● ● ● ● ● ● ● ● ● ● ● ● ● ● ● ● ● ● ● ● ● ● ● ● ● ● ● ● ● ● ● ● ● ● ● ● ● ● ● ● ● ● ● ● ● ● ● ● ● ● ● ● ● ● ● ● ● ● ● ● ● ● ● ● ● ● ● ● ● ● ● ● ● ● ● ● ● ● ● ● ● ● ● ● ● ● ● ● ● ● ● ● ● ● ● ● ● ● ● ● ● ● ● ● ● ● ● ● ● ● ● ● ● ● ● ● ● ● ● ● ● ● ● ● ● ● ● ● ● ● ● ● ● ● ● ● ● ● ● ● ● ● ● ● ● ● ● ● ● ● ● ● ● ● ● ● ● ● ● ● ● ● ● ● ● ● ● ● ● ● ● ● ● ● ● ● ● ● ● ● ● ● ● ● ● ● ● ● ● ● ● ● ● ● ● ● ● ● ● ● ● ● ● ● ● ● ● ● ● ● ● ● ● ● ● ● ● ● ● ● ● ● ● ● ● ● ● ● ● ● ● ● ● ● ● ● ● ● ● ● ● ● ● ● ● ● ● ● ● ● ● ● ● ● ● ● ● ● ● ● ● ● ● ● ● ● ● ● ● ● ● ● ● ● ● ● ● ● ● ● ● ● ● ● ● ● ● ● ● ● ● ● ● ● ● ● ● ● ● ● ● ● ● ● ● ● ● ● ● ● ● ● ● ● ● ● ● ● ● ● ● ● ● ● ● ● ● ● ● ● ● ● ● ● ● ● ● ● ● ● ● ● ● ● ● ● ● ● ● ● ● ● ● ● ● ● ● ● ● ● ● ● ● ● ● ● ● ● ● ● ● ● ● ● ● ● ● ● ● ● ● ● ● ● ● ● ● ● ● ● ● ● ● ● ● ● ● ● ● ● ● ● ● ● ● ● ● ● ● ● ● ● ● ● ● ● ● ● ● ● ● ● ● ● ● ● ● ● ● ● ● ● ● ● ● ● ● ● ● ● ● ● ● ● ● ● ● ● ● ● ● ● ● ● ● ● ● ● ● ● ● ● ● ● ● ● ● ● ● ● ● ● ● ● ● ● ● ● ● ● ● ● ● ● ● ● ● ● ● ● ● ● ● ● ● ● ● ● ● ● ● ● ● ● ● ● ● ● ● ● ● ● ● ● ● ● ● ● ● ● ● ● ● ● ● ● ● ● ● ● ● ● ● ● ● ● ● ● ● ● ● ● ● ● ● ● ● ● ● ● ● ● ● ● ● ● ● ● ● ● ● ● ● ● ● ● ● ● ● ● ● ● ● ● ● ● ● ● ● ● ● ● ● ● ● ● ● ● ● ● ● ● ● ● ● ● ● ● ● ● ● ● ● ● ● ● ● ● ● ● ● ● ● ● ● ● ● ● ● ● ● ● ● ● ● ● ● ● ● ● ● ● ● ● ● ● ● ● ● ● ● ● ● ● ● ● ● ● ● ● ● ● ● ● ● ● ● ● ● ● ● ● ● ● ● ● ● ● ● ● ● ● ● ● ● ● ● ● ● ● ● ● ● ● ● ● ● ● ● ● ● ● ● ● ● ● ● ● ● ● ● ● ● ● ● ● ● ● ● ● ● ● ● ● ● ● ● ● ● ● ● ● ● ● ● ● ● ● ● ● ● ● ● ● ● ● ● ● ● ● ● ● ● ● ● ● ● ● ● ● ● ● ● ● ● ● ● ● ● ● ● ● ● ● ● ● ● ● ● ● ● ● ● ● ● ● ● ● ● ● ● ● ● ● ● ● ● ● ● ● ● ● ● ● ● ● ● ● ● ● ● ● ● ● ● ● ● ● ● ● ● ● ● ● ● ● ● ● ● ● ● ● ● ● ● ● ● ● ● ● ● ● ● ● ● ● ● ● ● ● ● ● ●● ● ● ● ● ● ● ● ● ● ● ● ● ● ● ● ● ● ● ● ● ● ● ● ● ● ● ● ● ● ● ● ● ● ● ● ● ● ● ● ● ● ● ● ● ● ● ● ● ● ● ● ● ● ● ● ● ● ● ● ● ● ● ● ● ● ● ● ● ● ● ● ● ● ● ● ● ● ● ● ● ● ● ● ● ● ● ● ● ● ● ● ● ● ● ● ● ● ● ● ● ● ● ● ● ● ● ● ● ● ● ● ● ● ● ● ● ● ● ● ● ● ● ● ● ● ● ● ● ● ● ● ● ● ● ● ● ● ● ● ● ● ● ● ● ● ● ● ● ● ● ● ● ● ● ● ● ● ● ● ● ● ● ● ● ● ● ● ● ● ● ● ● ● ● ● ● ● ● ● ● ● ● ● ● ● ● ● ● ● ● ● ● ● ● ● ● ● ● ● ● ● ● ● ● ● ● ● ● ● ● ● ● ● ● ● ● ● ● ● ● ● ● ● ● ● ● ● ● ● ● ● ● ● ● ● ● ● ● ● ● ● ● ● ● ● ● ● ● ● ● ● ● ● ● ● ● ● ● ● ● ● ● ● ● ● ● ● ● ● ● ● ● ● ● ● ● ● ● ● ● ● ● ● ● ● ● ● ● ● ● ● ● ● ● ● ● ● ● ● ● ● ● ● ● ● ● ● ● ● ● ● ● ● ● ● ● ● ● ● ● ● ● ● ● ● ● ● ● ● ● ● ● ● ● ● ● ● ● ● ● ● ● ● ● ● ● ● ● ● ● ● ● ● ● ● ● ● ● ● ● ● ● ● ● ● ● ● ● ● ● ● ● ● ● ● ● ● ● ● ● ● ● ● ● ● ● ● ● ● ● ● ● ● ● ● ● ● ● ● ● ● ● ● ● ● ● ● ● ● ● ● ● ● ● ● ● ● ● ● ● ● ● ● ● ● ● ● ● ● ● ● ● ● ● ● ● ● ● ● ● ● ● ● ● ● ● ● ● ● ● ● ● ● ● ● ● ● ● ● ● ● ● ● ● ● ● ● ● ● ● ● ● ● ● ● ● ● ● ● ● ● ● ● ● ● ● ● ● ● ● ● ● ● ● ● ● ● ● ● ● ● ● ● ● ● ● ● ● ● ● ● ● ● ● ● ● ● ● ● ● ● ● ● ● ● ● ● ● ● ● ● ● ● ● ● ● ● ● ● ● ● ● ● ● ● ● ● ● ● ● ● ● ● ● ● ● ● ● ● ● ● ● ● ● ● ● ● ● ● ● ● ● ● ● ● ● ● ● ● ● ● ● ● ● ● ● ● ● ● ● ● ● ● ● ● ● ● ● ● ● ● ● ● ● ● ● ● ● ● ● ● ● ● ● ● ● ● ● ● ● ● ● ● ● ● ● ● ● ● ● ● ● ● ● ● ● ● ● ● ● ● ● ● ● ● ● ● ● ● ● ● ● ● ● ● ● ● ● ● ● ● ● ● ● ● ● ● ● ● ● ● ● ● ● ● ● ● ● ● ● ● ● ● ● ● ● ● ● ● ● ● ● ● ● ● ● ● ● ● ● ● ● ● ● ● ● ● ● ● ● ● ● ● ● ● ● ● ● ● ● ● ● ● ● ● ● ● ● ● ● ● ● ● ● ● ● ● ● ● ● ● ● ● ● ● ● ● ● ● ● ● ● ● ● ● ● ● ● ● ● ●
0 5 10 15 20 25 30 35
[image:3.612.316.500.74.238.2]0 20 40 60 80 100 user score
Figure 1: Different scoring strategies for a subset of ex-perts, showing all text scores aggregated across batches
choice to label texts with marks between 0 and 100, some annotators decided to use a more coarse-grained labeling strategy (e.g. by using multiples of 10 or 20), whereas others used a fine-grained scoring (all marks between 0 and 100). Furthermore, some people seem to be reluctant to assign either high or low scores, or both, while some others use the full range of possible scores.
Moreover, the experts delivered their data in sev-eral batches. The texts presented in each submis-sion batch were selected randomly, which implies that the annotator could have been confronted with predominantly less readable or predominantly more readable texts, which may have affected his scoring. Furthermore, since each text being added to a batch makes it increasingly difficult for an annota-tor to position this text to the already scored texts, we can assume that the greater the number of texts in a batch, the more effort the annotator did to posi-tion each text correctly in the batch. We decided to only take into account submission batches in which at least 5 texts were compared to each other. Figure 2 clearly shows the variability in the scores assigned to the texts.
Figure 2: Box plots showing the minimum, first quantile, median, third quantile, the maximum and the outliers for the scores assigned to each text
of two texts, accompanied with an assessment that designates which of the two texts is easier than the other one, and to what degree. The identification of text pairs is straightforward, since in each batch, each pair of distinct texts presents a text pair, leading
to n×(n2−1) pairs per batch. For the transformation
from the position of the texts in a batch to a relative assessment for each text pair, we need to fit the batch size and number of texts scored in between two texts in the same batch to a measure that indicates the dif-ference in readability between two texts. In order to do so, a possible formula to map the significance of the difference in readability is the following:
S =
t B
2
×
1−exp
−B
10
in which S is the significance of the difference in
readability,B is the batch size andtis the number
of texts scored in between two texts.
The quadratic function Bt2
in the first factor ex-presses that, in order to achieve a greater
signifi-cance, the value oftmust be more than
proportion-ally higher. Because of the quadratic function, more texts must be scored in between two texts in order to get a higher significance estimate. If the quadratic part would be the only factor, the two outer texts in each batch would always get the highest possible significance estimate. However, the second factor,
1−exp −B 10
ensures that small batches are less
0 20 40 60 80 100
0.0
0.2
0.4
0.6
0.8
1.0
t
Significance estimate
[image:4.612.79.266.106.244.2]B = 5 B = 25 B = 45 B = 65 B = 85 B = 105
Figure 3:Sas a function oftfor 6 different values ofB
likely to result in text pairs with a great difference in
readability. Figure 3 illustratesS as a function oft
for different batch sizes.
0 20 40 60 80 100
0.0
0.2
0.4
0.6
0.8
1.0
Percentile
Estimated significance
Figure 4: The relative cumulative frequency of the esti-mated significance scores
[image:4.612.320.511.364.524.2]right part will be interpreted as text pairs with much difference in readability.
3 From the expert to the crowd
Based on the assumption that the readability of a text can be conceptualized as the extent to which the text is perceived to be readable by the community of language users, we also investigated whether a crowdsourcing approach could be a viable alterna-tive to expert labeling. Crowdsourcing has already been used with success for NLP applications such as
WSD (Snow et al., 2008) or anaphora resolution3.
By redesigning readability assessment as a crowd-sourcing application, we hypothesize that no back-ground in linguistics is required to judge the
read-ability of a given text. TheSort by Readability
ap-plication4is designed as a simple crowdsourcing
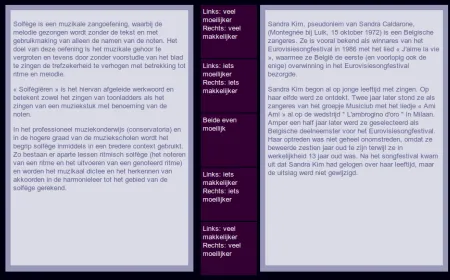
ap-plication to be used by as many users as possible. The site is accessible to anyone having internet ac-cess and very inutitive; the users are not required to provide personal data. A screenshot of the crowd-sourcing application is shown in Figure 5.
Two texts are displayed simultaneously and the user is asked to tick one of the following statements “Left: much more difficult – Right: much easier”, “Left: somewhat more difficult – Right: somewhat easier”, “Both equally difficult”, “Left: somewhat easier – Right: somewhat more difficult”, “Left: much easier Right: much more difficult”. The as-sessments were performed on the same data set that was used for the Expert readers application. The re-spondents were not paid for their work and initially recruited among friends and students. The only in-structions they were given were the following two sentences on the landing page of the application:
Using this tool, you can help us compose a readability corpus. You are shown two texts of which you can decide which is the more difficult and which is the easier one.
We assume that most respondents are native speak-ers of the Dutch language.
At the time of writing, 8568 comparisons were performed.
3http://www.phrasedetectives.org 4
The Sort by Readability application can be accessed through the following link: http://lt3.hogent.be/
[image:5.612.323.505.68.226.2]tools/sort-by-readability-nl/.
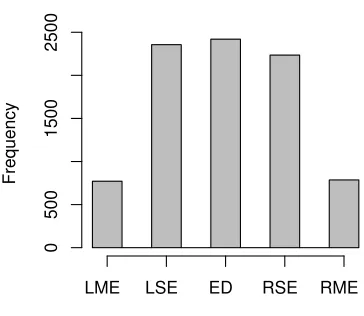
Figure 6: The number of times each button is pressed in the Sort by Readability application. The buttons from left to right are LME (“Left: much easier – Right: much more difficult”), LSE (“Left: somewhat easier – Right: somewhat more difficult”), ED (“Both equally difficult”), RSE (“Left: somewhat more difficult – Right: somewhat easier”) and RME (“Left: much more difficult – Right: much easier”).
The number of times each button in the crowd-sourcing application was pressed is displayed in Fig-ure 6. The number of times the text on the left was found easier is almost exactly the same as the num-ber of times for the right one. That means that users of the crowdsourcing application are generally not biased towards finding texts on one side easier than on the other side. Most of the times two texts were compared, people found that there was a difference in readability. Only in 28.2% of the cases, people as-sessed both texts as equally difficult. In 53.6% of the cases, the crowd assigned a slight difference in read-ability and in 18.2%, the readread-ability was assessed as very different. Note that not everyone evaluated the same text pairs. Moreover, nobody evaluated all the possible text pairs.
Figure 7 shows for both theExpert readers and
Sort by Readabilityapplication the relationship
Read-Figure 5: A screenshot of theSort by Readabilityapplication.
ers data. That may indicate that the Expert Readers application actually helps people to provide assess-ments more consistently than the Sort by Readability application. Despite these small variations, we can conclude that from the two readability assessment applications, two very similar data sets are obtained.
3.1 Inter-annotator agreement
For most NLP tasks, there is a tradition to calculate some measure of inter-annotator agreement (IAA). If this measure is high enough, the data are deemed acceptable to serve as a gold standard. If not, the un-derlying annotation guidelines can be adapted or fur-ther specified in order to improve the future agree-ment between annotators. In readability research, however, this practice does not seem to have gained
much ground. Given that many readability
pre-diction methods (e.g. (Flesch, 1948; Staphorsius, 1994)) were developed before it became common-place, it is not surprising that inter-annotator agree-ment played no great part in the developagree-ment of
those readability formulas. However, also in the
more recent classification-based work on readability
prediction, we are not aware of such efforts. Deter-mining inter-annotator agreement for both our
an-notation tasks is far from trivial. In both
appli-cations, not all texts received an equal number of assessments, as shown in Figures 8 and 9. Since this evidently leads to a varying number of assess-ments per text pair (ranging from 1 to 25 for Expert Readers and from 1 to 8 for Sort by Readability), we took this into account in the calculation of the inter-annotator agreement. Further, our definition of readability does not allow annotation guidelines. We explicitly avoided to influence people on what their view on readability should be, because we as-sume that their collective view is what defines the readability of a given text. Annotation guidelines would make the definition recursive. Inter-annotator agreement is therefore implemented as a descriptive statistic. It is not used to further guide the annotation process.
[image:6.612.79.529.71.351.2]Read-easier
0.0 0.4 0.8
● ● ● ● ● ● ● ● ● ● ● ● ● ● ● ● ● ● ● ● ● ● ● ● ● ● ● ● ●● ● ● ● ● ● ● ● ● ● ● ● ● ● ● ● ● ● ● ● ● ● ● ● ● ● ● ● ● ● ● ● ● ● ● ● ● ● ● ● ● ● ● ● ● ● ● ●● ● ● ● ● ● ● ● ● ● ● ● ● ● ● ● ● ● ● ● ● ● ● ● ● ● ● ● 0.0 0.4 0.8 ● ● ● ● ● ● ● ● ● ● ● ● ● ● ● ● ● ● ● ● ● ● ● ● ● ●● ● ● ● ●● ● ● ● ●● ● ● ● ● ● ● ● ● ● ● ● ● ● ● ●● ● ● ● ● ● ● ● ● ● ● ● ● ● ● ● ● ● ● ● ● ● ● ● ● ● ● ● ● ● ● ● ● ● ● ● ● ● ● ● ● ● ● ● ● ● ● ● ● ● ● ● ● 0.0 0.4 0.8 ● ● ●● ● ●●● ● ● ● ● ● ● ● ● ● ● ● ● ● ● ● ● ● ● ● ● ●●● ● ● ● ● ● ● ● ● ● ● ● ● ● ● ● ● ● ● ● ● ● ● ●● ●● ● ● ● ●● ● ● ● ● ● ● ● ● ● ● ● ● ● ● ●● ● ● ● ● ● ● ● ● ● ● ● ● ● ● ● ● ● ● ● ● ● ● ● ● ● ● ● same ● ● ● ● ● ● ●● ● ● ● ● ● ● ● ● ● ● ● ● ● ● ●● ● ● ● ● ● ● ● ● ● ● ● ● ● ● ● ● ● ● ● ● ● ● ● ● ● ● ● ● ● ● ●● ● ● ● ● ● ● ● ● ● ● ● ● ● ● ● ● ● ● ● ● ● ● ● ●● ● ● ● ● ● ● ● ● ● ● ● ● ● ●● ● ● ● ● ● ● ● ●●
0.0 0.4 0.8 ● ● ● ● ● ● ● ● ● ● ● ● ● ● ● ● ● ●● ● ● ● ● ● ● ● ● ● ●● ● ● ● ● ● ● ● ● ● ● ●● ● ● ● ● ● ● ● ● ● ● ● ● ● ● ● ● ● ● ● ● ●● ● ● ● ● ● ● ● ● ● ● ● ● ● ● ● ● ● ● ● ● ● ● ● ● ● ● ● ● ● ● ● ● ● ● ● ● ● ● ● ● ● ● ● ● ● ● ● ●● ● ● ● ● ● ● ● ● ● ● ● ● ● ●● ● ● ● ● ●●● ● ● ● ● ● ● ● ● ● ● ● ● ● ● ● ● ● ● ● ● ● ● ● ● ● ● ● ● ● ● ● ● ● ● ● ● ● ● ● ● ● ● ● ● ● ● ● ● ● ● ● ● ● ● ● ● ● ● ● ● ● ● ● ● ● ● ● ● ● ● ● ●● ● ●
0.0 0.4 0.8
0.0
0.4
0.8
more.difficult
easier
0.0 0.4 0.8
● ● ●● ● ● ● ● ● ● ● ● ● ● ●● ● ● ● ● ● ● ●● ● ● ● ● ● ● ● ●● ● ● ● ● ● ● ● ● ● ● ● ● ● ●● ● ● ● ● ● ● ● ● ● ● ● ● ● ● ● ● ● ● ● ● ● ● ● ● ● ● ● ● ● ●● ● ● ● ● ● ● ● ● ● ● ● ● ● ● ● ● ● ● ● ● ● ● ● ● ● ● 0.0 0.4 0.8 ● ● ●● ● ● ● ● ● ● ● ● ● ● ● ● ● ● ● ● ● ● ● ●● ● ● ● ● ● ● ●● ● ● ● ● ● ● ● ● ● ● ● ● ● ● ● ● ● ● ● ●● ● ● ● ● ● ● ● ● ● ● ● ● ●● ● ● ● ● ● ● ● ● ● ● ● ● ● ● ● ● ● ● ● ● ● ● ● ● ● ● ● ● ● ● ● ● ● ● ● ● ● 0.0 0.4 0.8 ● ● ●●●●● ● ● ● ● ● ● ●●● ●●●●●●● ● ● ● ● ●●● ● ●● ● ● ●● ● ● ● ● ●●●● ●● ● ● ● ●● ● ● ● ●● ● ● ● ●●● ● ● ● ● ● ● ● ●● ● ● ●●● ● ●● ● ● ●● ●● ● ●● ● ● ● ●●● ● ● ●● ● ● ● ● ● ● same ● ● ●●●●● ● ● ● ● ● ● ● ● ● ● ● ●●● ●●● ● ● ●●● ● ● ●● ● ● ● ● ● ● ● ● ●●●● ● ● ● ● ● ● ● ● ● ● ●●● ● ● ●●● ● ● ● ●●●● ● ● ● ● ● ●● ● ●● ● ● ●●● ● ● ● ● ●● ● ● ●● ● ● ● ● ● ● ● ● ● ●
0.0 0.4 0.8 ● ● ● ● ● ● ● ● ● ● ● ● ● ● ●● ● ● ● ● ● ● ● ●● ● ● ● ● ●● ●● ● ● ● ● ● ● ● ● ● ● ● ● ● ● ● ● ● ● ● ●● ● ● ● ● ● ● ● ● ● ● ● ● ● ● ● ● ● ● ● ● ● ● ● ● ● ● ● ● ● ● ● ● ● ● ● ● ● ● ● ● ● ● ● ● ● ● ● ● ●● ● ● ● ●● ● ● ● ● ● ● ● ●● ● ●● ● ● ● ● ● ● ● ● ● ● ● ● ● ● ● ●● ● ● ● ● ● ● ●● ● ● ● ● ● ● ● ●● ● ● ● ● ● ● ● ● ● ● ● ●● ● ● ● ● ● ● ● ● ● ● ● ● ● ● ● ● ● ● ● ● ● ● ● ● ● ● ● ● ● ● ● ● ● ● ● ● ● ● ●● ● ●
0.0 0.4 0.8
0.0
0.4
0.8
more.difficult
[image:7.612.112.505.57.266.2](a) (b)
Figure 7: Proportion of times each text was assessed as easier, equally difficult or more difficult than any other text: (a) for the Sort by Readability data and (b) for the Expert Readers data.
Data set # text pairs Setup K
Experts 1 – 10 standard 30 %
Experts 11 – 25 standard 31 %
Experts 1 – 25 standard 30 %
Experts 1 – 10 no same 56 %
Experts 11 – 25 no same 75 %
Experts 1 – 25 no same 60 %
Experts 1 – 10 much difference 95 %
Experts 11 – 25 much difference 98 %
Experts 1 – 25 much difference 96 %
Experts 1 – 10 adjacent 50 %
Experts 11 – 25 adjacent 65 %
Experts 1 – 25 adjacent 54 %
Experts 1 – 10 merged 35 %
Experts 11 – 25 merged 41 %
Experts 1 – 25 merged 37 %
Crowd 1 – 8 standard 44 %
Crowd 1 – 8 no same 66 %
Crowd 1 – 8 much difference 88 %
Crowd 1 – 8 adjacent 59 %
Crowd 1 – 8 merged 50 %
Table 1: Kappa statistics for all the different setups. The second column shows the number of times a text pair must have been labeled in order to be taken into account.
Number of occurrences in a batch
Number of te
xts
10 20 30 40
0
5
10
20
[image:7.612.78.296.329.656.2]30
Figure 8: The distribution of the texts, according to the number of submission batches in which they occurred. Only batches with>5 texts were taken into account.
[image:7.612.323.505.332.468.2]Number of sessions in which text was compared
Number of te
xts
90 100 110 120
0
5
10
20
[image:8.612.84.269.85.215.2]30
Figure 9: Distribution of the number of sessions each text was seen in for the Sort by Readability application
Readability application5on the Expert Readers data
set, leads to the boundary values displayed as dashed lines in Figure 4. 28 % of the text pairs in both ap-plications are thus labeled as equally readable, while 18 % of the pairs are labeled with much difference in difficulty. Those partitions correspond with
bound-ary values of 0.016 and 0.29 forS, respectively.
We usedK as proposed by Carletta (1996) as a
measure for the agreement between annotators. K
is given by the following formula:
K =P(A)−P(E) 1−P(E)
in whichP(A)is the probability that two annotators
make the same decision andP(E) is the
probabil-ity that the same decision is made coincidently. For
P(A), we take into account the number of times two
annotators agree about a text pair and the number of times they disagree. The trivial case, when there is total agreement, simply because a text pair is anno-tated only once, was not taken into account for the
calculation of the kappa statistic. P(E) is
empiri-cally estimated in the standard way.
We calculateKin 5 different settings. In the
stan-dard setting, each of the five possible assessments
for a text in a text pair is regarded as a separate class, without ordering of the classes.
In a second calculation of inter-annotator agree-ment, we considered a click on an adjacent button
5See Figure 6
for the same text pair as agreement. By doing so, we took into account that the choice between “eas-ier” and “much eas“eas-ier” and between “more diffi-cult” “much more diffidiffi-cult” , respectively, is less straightforward than the distinction between “eas-ier” and “more difficult”. Furthermore, the bound-ary between “both equally difficult” and “somewhat
easier/more difficult” could also be considered less
transparent.
In a third calculation, namedmerged, the classes
“easier” and “much easier” on one hand, and “more difficult” and “much more difficult” on the other hand are merged, resulting in three different classes. Finally, we examine two cases in which a part of
the text pairs are omitted, viz. no sameand much
difference. In both cases, a binary classification is
performed. P(E) now equals 0.5 for both classes,
because there are two possible outcomes, with equal
probability. For no same, the button in the
mid-dle was discarded. The “easier” and “much easier” classes were merged, as well as the “more difficult”
and “much more difficult” classes. In themuch
dif-ferencesetting, only the texts labeled as much easier
or much more difficult were taken into account. The results of all these calculations are shown in Table 1. The second column indicates a range of a number of text pairs, which determines how many times a text pair must have been labeled in order
to be taken into account for the calculation of K.
The results are variable, depending on howK was
calculated. For the Expert Readers, we consistently
observe higherK values when more labelings are
required per text pair.
One possibility to get an idea of how similar the two data sets are is by calculating correlation met-rics, such as the Pearson correlation coefficient. In order to calculate that, a numerical value acquired from both data sets must be attached to each text. For each text, we attached two values per data set, viz. the proportions of times the text was assessed either as easier or as more difficult than any other text. The correlations between the 4 resulting values per text are shown in Table 2. From those results, it is clear that the data sets are very similar.
Crowd Crowd Experts Experts
easier more difficult easier more difficult
Crowd – easier 100 % -93 % 88 % -87 %
Crowd – more difficult -93 % 100 % -87 % 89 %
Experts – easier 88 % -87 % 100 % -99 %
[image:9.612.139.479.65.148.2]Experts – more difficult -87 % 89 % -99 % 100 %
Table 2: Pearson correlations between 4 different metrics calculated based on the assessments by experts or the crowd. The metrics are the proportions of times a text is assessed either as easier or as more difficult than any other text.
most suitable gold standard consists of an assign-ment of a readability score to each individual text. Those readability scores can for example be the pro-portion of times each text was assessed as easier than any other text. Other possibilities to assign scores can also lead to a gold standard for regression. Bi-nary classification is an example of a different learn-ing task, for which the data set doesn’t need to be transformed. For two texts, a binary classifier at-tempts to determine which is the easiest and which the most difficult one. Further research will focus on how the data sets resulting from both annotation strategies can be transformed into gold standards.
4 Concluding remarks
We have implemented two web applications to col-lect assessments about the readability of texts in a selected corpus: an application intended for lan-guage experts and a crowdsourcing tool. Although both English and Dutch are targeted, we focused on the results that were obtained for Dutch. In order to compare the resulting readability assessments, we viewed the data as text pairs, for which a relative as-sessment is given. A comparison of both data sets revealed that they are very similar, a similarity which was numerically confirmed by an analysis with Pear-son’s correlation coefficient. Finally, we gave ex-amples of how gold standards for different learning tasks canbe constructed from the data sets.
We introduced the problem of inter-annotator agreement into the field of readability prediction and calculated inter-annotator agreement for both data sets in five different ways. We show that for the
text pairs which were assessed> 10 times, higher
K scores are obtained in each of the different
set-tings, which strengthens our confidence that read-ability can be learned from our data sets.
We conclude that both data sets are valuable and
that crowdsourcing is a viable alternative to read-ability assessments by language experts.
Future work includes a further extension and anal-ysis of the data sets. Further analanal-ysis could also re-veal the ideal way to extract a gold standard from the data sets. We will also continue to investigate the impact of different linguistic features on automatic readability prediction (van Oosten et al., 2010).
Acknowledgments
This research was funded by the University College Ghent Research Fund.
We would like to thank all volunteers who coop-erated with our research by using our web applica-tions.
References
Richard C. Anderson and Alice Davison. 1986. Con-ceptual and Empirical Bases of Readability Formulas. Technical Report 392, University of Illinois at Urbana-Champaign, October.
R. H. M. Brouwer. 1963. Onderzoek naar de leesmoeili-jkheden van Nederlands proza. Pedagogische Studi¨en, 40:454–464.
Jean Carletta. 1996. Assessing Agreement on Classi-fication Tasks: The Kappa Statistic. Computational Linguistics, 22(2):249–254.
Kevin Collins-Thompson and Jamie Callan. 2004. A language modeling approach to predicting reading dif-ficulty. InProceedings of HLT / NAACL 2004, Boston, USA, May.
Edgar Dale and Jeanne S. Chall. 1948. A formula for predicting readability. Educational research bulletin, 27:11–20.
Rudolph Flesch. 1948. A new readability yardstick.
Journal of Applied Psychology, 32(3):221–233, June. Thomas Franc¸ois. 2009. Combining a Statistical
In Proceedings of the EACL 2009 Student Research Workshop.
Robert Gunning. 1952. The technique of clear writing. McGraw-Hill, New York.
Michael Heilman, Kevyn Collins-Thompson, and Max-ine Eskenazi. 2008. An Analysis of Statistical Models and Features for Reading Difficulty Prediction. InThe Third Workshop on Innovative Use of NLP for Build-ing Educational Applications.
Rohit J. Kate, Xiaoqiang Luo, Siddharth Patwardhan, Martin Franz, Radu Florian, Raymond J. Mooney, Salim Roukos, and Chris Welty. 2010. Learning to Predict Readability using Diverse Linguistic Features. In 23rd International Conference on Computational Linguistics.
G. Harry McLaughlin. 1969. SMOG grading – a new readability formula. Journal of Reading, pages 639– 646.
Danielle S. McNamara, Eileen Kintsch, Nancy Butler Songer, and Walter Kintsch. 1993. Are good texts always better? Interactions of text coherence, back-ground knowledge, and levels of understanding in learning from text. Technical report, Institute of Cog-nitive Science, University of Colorado.
Emily Pitler and Ani Nenkova. 2008. Revisiting Read-ability: A Unified Framework for Predicting Text Quality. InEMNLP, pages 186–195. ACL.
Earl F. Rankin. 1959. The cloze procedure: its validity and utility. Eighth Yearbook of the National Reading Conference, 8:131–144.
Ineke Schuurman, V´eronique Hoste, and Paola Monach-esi. 2009. Cultivating Trees: Adding Several Se-mantic Layers to the Lassy Treebank in SoNaR. In
Proceedings of the 7th International Workshop on Treebanks and Linguistic Theories, Groningen, The Netherlands.
Sarah E. Schwarm and Mari Ostendorf. 2005. Read-ing Level Assessment UsRead-ing Support Vector Machines and Statistical Language Models. InProceedings of the 43rd Annual Meeting of the ACL, pages 523–530, Ann Arbor, June. Association of Computational Lin-guistics.
Rion Snow, Brendan O’Connor, Daniel Jurafsky, and An-drew Y. Ng. 2008. Cheap and fast—but is it good?: evaluating non-expert annotations for natural language tasks. InProceedings of the Conference on Empirical Methods in Natural Language Processing, EMNLP ’08, pages 254–263, Stroudsburg, PA, USA. Associ-ation for ComputAssoci-ational Linguistics.
Gerrit Staphorsius and Ronald S.H. Krom. 1985. Cito leesbaarheidsindex voor het basisonderwijs: verslag van een leesbaarheidsonderzoek. Number 36 in Spe-cialistisch bulletin. Cito Arnhem, april.
Gerrit Staphorsius. 1994. Leesbaarheid en leesvaardigheid. De ontwikkeling van een domein-gericht meetinstrument.Cito, Arnhem.
Kumiko Tanaka-Ishii, Satoshi Tezuka, and Hiroshi Ter-ada. 2010. Sorting Texts by Readability. Computa-tional Linguistics, 36(2):203–227.
Gertjan J.M. van Noord. 2009. Large Scale Syntactic Annotation of written Dutch (LASSY), January. Philip van Oosten, Dries Tanghe, and V´eronique Hoste.
2010. Towards an Improved Methodology for Auto-mated Readability Prediction. In Nicoletta Calzolari, Khalid Choukri, Bente Maegaard, Joseph Mariani, Jan Odijk, Stelios Piperidis, and Daniel Tapias, editors,