EXPERIMENTS FOR NONDETONATIVE REACTIONS OF CONFINED EXPLOSIVES
John Delaney
U.S. Naval Explosive Ordnance Disposal Technology Division Indian Head, MD 20640
Patrick Baker
Weapons and Materials Research Directorate/U.S. Army Research Laboratory Aberdeen Proving Ground, MD 21005-5066
ABSTRACT
The nondetonative behavior of confined explosives is of considerable interest in many areas. To predict this behavior, the influence of many variables must be understood. These include, but are not limited to, the explosive's chemical formulation and the confinement strength. This paper describes continuing experiments conducted to elucidate the influence of these variables on the violence of nondetonative reactions and the possible transition to detonation. These data represent a follow-on to results presented in a 1998 Propulsion Systems Hazards Subcommittee (PSHS) paper. Steel tubes, 0.71-m length x 50.8-mm internal diameter, were loaded with TNT and Composition-B (Comp-B). The thickness of the tubes was varied from 3.18 to 25.4 mm. Embedded pressure gauges, fiber optics, strain gauges, and high-speed film were used to characterize the reaction. As expected, significant differences were observed between TNT and Comp-B. In addition, a strong effect of confinement was observed. For Comp-B as confinement was increased, the reactions varied from very mild to a possible transition to detonation. These data help explain some phenomena observed in actual experiments with unexploded ordnance (UXO).
INTRODUCTION
The Naval Explosive Ordnance Disposal Technology Division (NAVEODTECHDIV) is funding the Army Research Laboratory (ARL) to study the nondetonative response of confined explosives to impact. Previous tests that supported an acquisition program [1] identified six possible reaction types following impact:(1) prompt detonation, (2) delayed detonation, (3) violent explosion, (4) mild explosion, (5) burn, (6) quench/no-reaction. Categorization of the reaction was based on fragment size, internal pressure history, and blast pressure [1]. In this effort, the main goal is to develop a predictive capability for the type of reaction and the reaction level.
The basic mechanism for nondetonative response is as follows in most scenarios. Upon impact, shock is transmitted through the confinement and into the explosive. If strong enough, shock-to-detonation transition (SDT) (reaction type 1) can occur, but that is not a primary interest here. As the penetrator perforates the case and penetrates the main charge, the explosive undergoes significant deformation under high pressure. At this point, ignition usually occurs, although ignition sometimes does occur later due to hot fragment conduction. If no initiation occurs or if the initiation is quenched, the reaction is type 6. Otherwise a tradeoff begins between the pressure generated due to explosive burning and the venting of the products to the outside environment. If the process is near steady state, then the explosive can burn out without confinement fracture (type 5 reaction). Otherwise, if dp/dt > 0 inside the charge, a mild explosion, violent explosion, or delayed detonation can occur. The deciding factor between these reactions is the magnitude of the pressure increase. This will be controlled by the dynamic interaction between the burn rate of the material, the surface area available for burn, and the venting to the outside. The burn rate is controlled by the explosives chemical formulation; the surface area is controlled to a large part by the explosives mechanical properties and its propensity for damage, and the venting is strongly influenced by confinement strength.
Currently, our efforts at ARL are focused in four areas. First, experiments are underway to elucidate the mechanisms and processes by which the reaction grows from initiation to various degrees of violence. Some of these experiments are the subject of this paper. Second, experiments are being conducted to define damage to explosive grains as a function of loading. Third, these experiments are being modeled with the CTH hydrocode using a new damage model [2]. The beginning of these two efforts is described in a companion paper [3]. Fourth, a computer program was written to predict the load on the explosive from the burning cavity following penetration of the impactor. This work is not covered in these proceedings. In parallel with the ARL effort, researchers at the Naval Surface Warfare Center (NSWC) are developing constitutive relationships and initiation models for the explosives used in these experiments. These models are being validated using the EPIC hydrocode.
The experiments reported here are a continuation of the experiments reported in the 1998 JANNAF PSHS proceedings [4]. These are deflagration tube experiments in which explosive confined within a tube is initiated at one end and the subsequent reaction growth or quenching is observed. Those experiments focussed on thick-walled tubes to simulate heavy confinement. In these experiments, the tube thickness was varied to study confinement effects.
TEST DESCRIPTION - TUBE EXPERIMENTS
[image:2.612.71.256.233.470.2]A schematic of the tube experiment is in Figure 1. TNT and Composition-B (Comp-B) were cast into the tubes, 0.71-m length by 51-mm internal diameter (28 inch x 2 inch). The TNT contained no additives, and the Comp-B was nominal 59.5% RDX, 39.5% TNT, and 1% wax. Plugs 51-mm long were placed on each end of the tube, so the explosive column length was 0.61 m (24 inches). The tubes were machined from 1026 series mild-steel pipes. Wall thickness and type of instrumentation were varied. Wall thicknesses were 25.4 mm (1 inch), 12.7 mm (1/2 inch), 6.35 mm (1/4 inch), and 3.18 mm (1/8 inch).
Table 1 shows the estimated pressure required for the tube to reach plastic instability. The minimum values for yield stress and ultimate tensile strength are also shown in Table 1. The maximum pressures were calculated using the equation Pmax = 2σutst0/r0. This
[image:2.612.294.537.355.459.2]gives only estimated pressures, considering approximations in the equation, uncertainties in mechanical properties, and strain rate and inertia effects. Thus, these values should be used as relative comparisons more than absolute burst pressures.
Table 1. Estimated Burst Pressures for Tubes
Tube Thickness
(mm)
Minimum Yield Stress (kBar)
Minimum Ultimate Tensile
Stress (kBar)
Estimated Burst Pressure
(kBar)
3.18 2.48 4.14 0.49
6.35 2.48 4.14 0.92
12.7 2.48 4.14 1.65
25.4 3.24 4.83 3.22
Ignition of the explosive was achieved with ~3 g of a mixture of three parts potassium nitrate to one part boron. The potassium nitrate was ground and passed through a 297-µm sieve. The boron particle size was roughly 1 µm. The BKNO3 mixture was placed
inside a brass ring that rested against the explosive. The ring was 6.35-mm thick and 31.75 mm in internal diameter, for a volume of 5.03 cm3. This mixture was ignited with an M105 electric
match. The match leads were fed out of the tube through a 6.4-mm hole drilled through the plug, which was screwed down against the ring. This hole was filled with epoxy, which was allowed to dry before testing. The electric match was ignited with a high-voltage pulse, effectively causing it to act like an exploding bridgewire igniter. This facilitated timing and triggering of the instrumentation.
The idea of using this ignition mix was to cause hot low-pressure reaction gases to ignite the explosive. However, it was later discovered that the ignition source pressure was not as low as expected. A Cheetah [5] calculation was performed for a constant volume explosion of the mixture. Figure 2 shows a plot of temperature and pressure vs. loading density. For the nominal loading density of 0.596 g/cm3, a pressure of 3.1 kBar and temperature of 4075 K is expected. In practice these values
are lower due to heat loss and significant venting. But, the amount lower is not known as this point. Off line tests are scheduled to measure the pressure history of the ignition mix, but they were not completed before this meeting.
EXPLOSIVE
TUBE
PLUGS ELECTRIC MATCH
IGNITION MIX
CARBON GAGES
FIBER OPTICS
STRAIN GAGES SHORTING PINS
Three types of instrumentation were used on the pipe bombs: (1) embedded carbon resistors, (2) embedded fiber optics, and (3) externally mounted strain gauges. The carbon resistors were 1/8W Allen Bradley. In previous work, a high-pressure calibration was used for the carbon resistors [6,2]. However, this calibration is not valid at the low pressures of these tests. Thus, a low-pressure static calibration was obtained. A single curve was fit to the low-pressure data and the existing high-pressure calibration up to 30 kBar. The calibration of these gauges is one area where more work is needed.
The strain gauges were Micro Measurements EP-08 120 Ω. They were placed on the outside of the tubes to measure the tangential strain. A standard Wheatstone bridge circuit was used for each gauge. These gauges are calibrated up to 20% strain and were used to examine the progression of large strains in the tubes. One drawback of strain gauges is that there can be significant pressurization within the tubes before a large signal is obtained.
The fiber-optic cables were low-cost plastic fibers, 1-mm diameter, wrapped in a 0.6-mm-thick plastic sheathing. One end was embedded in the explosive, and the other end was fed into an optical detection circuit. To provide rigidity during casting, the fibers were thread through brass tubes, 2.5-mm internal diameter and 0.36-mm thick. Additional diagnostics included a piezoelectric blast pressure gauge at a distance of 50 ft normal to the axis of the tube, shorting pins on the outside of the tube, and a Redlake Hycam high-speed camera. The camera was used in quarter-frame mode at top speed. A nominal framing rate of ~35,000 frames/second was obtained. The tube was painted white to facilitate imaging. To illuminate the tube, flash bulbs were flashed with high voltage from a second firing unit.
Table 2 shows the matrix of instrumentation used on the various experiments. Twenty-one tests are described here, eleven using TNT and ten using Comp-B. The numbers in parentheses indicate where tests were done twice. Figure 3 shows the location of the gauges used relative to the end of the explosive near the BKNO3 depending on the number of gauges. In all
cases, the gauges were equally spaced along the length of the tube.
Table 2. Instrumentation Used in Tube Experiments
Number of Gauges Wall Thickness (mm)
Fiber Optics
Strain Gauges Carbon Gauges 3.18 6.35 12.7 25.4
- 6 8 TNT TNT TNT
-4 - 4 TNT TNT TNT
-8 - - TNT TNT TNT
-- - 8 - - - TNT (2)
- 6 8 Comp-B Comp -B Comp -B
-4 - 4 Comp -B Comp -B Comp -B
-8 - - Comp -B Comp -B -
-- - 8 - - - Comp -B (2)
0 1 2 3 4 5 6
0 0.2 0.4 0.6 0.8 1
Loading Density (g/cm3)
Pressure (kBar)
3700 3750 3800 3850 3900 3950 4000 4050 4100 4150
Temperature (K)
Pressure Temperature
Nominal Load
0 100 200 300 400 500 600
Distance From BKNO3 (mm)
Eight Gages - 76.2 mm Spacing
Six Gages - 87 mm Spacing Four Gages - 122 mm Spacing
1 2 3 4 5 6 7 8
1 2 3 4 5 6
1 2 3 4
END OF EXPLOSIVE START OF
[image:4.612.184.430.74.257.2]EXPLOSIVE
Figure 3. Gauge locations in tubes depending on number of gauges.
RESULTS
The sequence of events for these tests is as follows. After the electric match is initiated, there is a several millisecond induction period for the BKNO3 to burn. This was as much as 10-20 ms. As the BKNO3 burns, the pressure increases in the ring
cavity and a pressure wave is transmitted into the explosive. During this process, the hot combustion products can ignite the explosive. If this happens, then the pressure wave is enhanced. As this wave travels through the explosive, it can coalesce into a shock wave. Secondary ignition of the explosive is possible during this process, though the mechanism for secondary ignition is unclear. Since the burning of the explosive is strongly a function of pressure, the confinement can control to what extent the explosive burns and whether or not there is a growth to detonation.
TNT Results
The TNT tubes resulted in relatively mild reactions for all tube thicknesses. In no case did the TNT transition to detonation. Figure 4 shows an example high-speed film of a test. The spacing between frames is approximately 29 µs. The film indicates some venting through the plug where the electric match was inserted. This venting typically proceeded as unchoked flow for some time, and then the flow became choked. Then it appeared that a shock wave detached from the surface and the flame somewhat separated from the plug. This separation is indicated in the figure. Usually, breakup of the tube followed closely behind this process, as is the case with this image. For TNT, black soot, as shown on the far side of the tube, was frequently emitted first from the tube rather than flame. This quickly obscured the pipe. The image shown in Figure 4 actually has more flame in the image than typical for TNT. Close examination of this figure also shows that this flame is progressing toward the rear surface of the tube, but this progression appears to slow in the last five frames of the image. In addition, there is some expansion near the end of the tube away from ignition. This is most likely due to the reflected pressure wave from the plug opposite the ignition side.
Recovered fragments indicated mild reactions. Large pieces were recovered from longitudinal splits. The number of splits was small, indicating that the expansion of the tube was relatively slow. Figure 5 shows typical fragments recovered from the tubes of various thicknesses. In many cases, melted TNT and solid fragmented TNT were found on the fragments and the witness plate after the test, thus indicating incomplete combustion.
DETACHING FLAME FROM VENTING OF PRODUCT GASES
IGNITION END
POSSIBLE INDICATION OF PROPAGATING REACTION IN TNT
[image:5.612.74.540.71.255.2]EXPANSION AT FAR END OF TUBE
Figure 4. Example event for a 12.7-mm-thick TNT loaded tube.
3.18 mm
6.35 mm
[image:5.612.93.519.300.531.2]25.4 mm 12.7 mm
Figure 5. Typical fragments from tubes loaded with TNT for various tube thicknesses.
The 6.35-mm-thick tube shows the best example of the pressure wave traveling down the tube. The sound speed in TNT is roughly 2.0-2.2 mm/µs, so there should be approximately 165-183 µs between the waves at gauge locations 1 and 4. Close examination of the curves indicates that there is some steepening of the pressure history as the wave travels down the tube. At 0.3 kBar, there is roughly 190 µs between the waves at gauges 1 and 4; at 0.8 kBar, there is 153 µs, and, at 1.5 kBar, there is 135 µs. This is in part due to the increase in sound speed with pressure and partially due to the reflection of the wave from the far end of the tube.
The fiber optics provide some information about the TNT reaction. For some of the tests with eight fiber optics, a reaction was seen to propagate from fiber to fiber. But there is some doubt as to if this reaction is in the tube or outside of the tube after fracture. On the tests where both fiber optics and pressure gauges were present, some reaction was detected while there was still pressure on the corresponding gauges and, in some cases, while the pressure was still increasing. This was primarily for the fibers closer to the initiation end. In general, though, the fiber-optic data were not conclusive.
The limited strain-gauge data provide little extra information to the experiments with TNT. Since many of the tubes failed by longitudinal cracking, the gauges records were occasionally erratic. However, in a qualitative sense, the records were as expected. There was little signal until the pressure increased significantly in the tube, the tube yielded, and the strain grew rapidly. This is fine for thin tubes, but, for thicker tubes, the high yield stress means that a low strain signal is obtained for significant pressures. Thus, it is difficult for pressurization of the explosive to be backed out with strain records on thick tubes. This is a drawback to using strain gauges to observe nondetonative behavior.
Comp-B Results
The Comp-B-loaded tubes resulted in reactions ranging from mild to transitions to detonation. In addition, it appears that secondary ignition was evident in many of the experiments. The top of Figure 8 shows an example high-speed film for a Comp-B-loaded tube with four gauge locations. This is a 3.18-mm-thick tube. At some distance (between gages 1 and 2) into the tube, a violent reaction occurs. This is believed to be a secondary ignition of the Comp-B in this region. Here, pressure rise is sufficiently fast to cause local tube failure. Thus, the resulting high pressure is diminished as the pressure wave propagates the remaining distance down the tube. The pressure records for this experiment support this sequence of events. This tube had four pressure gauges. The pressure rise was nearly identical for gauges 1 and 2, rising from about 0.1 to 1.3 kBar in 60 µs with gauge 2 rising about 10-20 µs ahead of gauge 1. The pressures in gauges 3 and 4 are much lower.
Recovered fragments for Comp-B tubes indicated a variety of reaction types depending on the tube thickness. Figure 9 shows examples of the fragments for various tube sizes. For thinner tubes, large fragments were recovered and much of the tube was minimally damaged. Apparently, when the local violent reaction broke open the tube, the pressure was relieved quickly enough to quench the reaction. As tube thickness became greater, the number of small fragment increased. For 6.35-mm-thick tubes, there was a variety of fragment sizes ranging from small to large. For 12.7-mm-thick tubes, there was a higher number of small fragments, and, for 25.4-mm-thick tubes, nearly all the fragments were small. In tubes up to 12.7-mm thick, the impressions on the witness plate indicated a reaction that was dying as it propagated the length of the tube. This does not imply, however, that the reactions were mild.
Figure 10 shows the peak blast pressure and specific impulse at 50 ft for the Comp-B tubes. As with TNT, there was an effect of tube thickness on blast pressure. Included on this graph are data from experiments covered in the previous PSHS paper for 25.4-mm-thick tubes [4]. Note that the scatter appears to be reduced compared to the results for TNT in Figure 6. This is because the strong reaction of Comp-B results in a more consistent breakup of the tube. However, due to the nature of nondetonative reactions, there is still some scatter. There appears to be a slight drop on average for peak pressure and impulse as thickness is increased from 12.7 to 25.4 mm. This is likely a result of more energy being used to project fragments for the thicker tube. It is well known that case mass can significantly reduce blast for detonations and should decrease blast for equivalent energy nondetonative reactions.
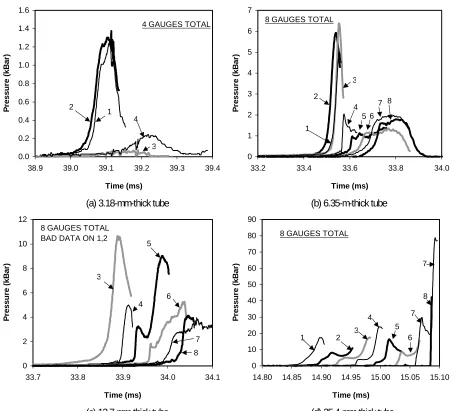
propagated down the tube for the 3.18-, 6.35-, and 12.7-mm-thick tubes. This is clearly shown in Figure 11. For the 6.35-mm-thick tube, as the pressure propagates from gauge location 2 to 3 to 4, the leading edge of the wave becomes steeper but the wave widens in time due to the release waves. For the 25.4-mm example though, the pressure does not decrease as the wave travels down the tube.
Though the true peak pressures for the 25.4-mm tube are not known since many of the gauges broke on the pressure rise, it is clear that a large pressure wave is propagating down the tube. This is supported by the witness plate data for this test, which indicate a growing reaction for the 25.4-mm-thick tube. This is contrasted by the dying reactions that were indicated for the other tube thicknesses. Note in Figure 11 that near the end of the 25.4-mm thick tube, the pressure rises very fast and a shock is being setup. The pressure at gauge location 7 rises to 30 kBar in 12 µs, and certainly before any reflected wave off the rear plug can affect its response. It is quite interesting though that these pressure records do not indicate a detonation, even though the pressure is very high. The spacing of the arrival times indicates a wave traveling down the tube at 2.19-2.81 mm/µs. Of course, this does not mean that a detonation did not occur when the wave was reflected off the rear surface or that a detonation wave did not breakout at some point behind this compression wave. Data from the paper in the previous meeting indicated that, if detonation did occur, it broke out in the last 152 mm of the tube. Figure 11 indicates that this is indeed where the pressure wave becomes a shock. Interestingly, it is also where this shock would be strongly reflected into damage material when it reaches the rear plug, which brings up the possibility of an XDT type scenario. The film record in bottom of Figure 8 shows a nondetonative reaction that travels the length of the tube in about seven frames. This is approximately 190-210 µs, which is clearly too long for a detonation.
For Comp-B, the fiber-optic results did provide some information. For the 25.4-mm tubes, no fiber-optic data exist. However, for the 3.18-, 6.35-, and 12.7-mm tubes, those fiber optics adjacent to the carbon gauges in the areas of local reaction rose nearly simultaneously with the increase in pressure. Fiber optics farther down the tubes did not rise with the pressure. Rather, they appeared to rise later. This further indicates a dying reaction.
The strain data support the pressure data. They indicate large strains coming first some distance down the tube, as opposed to at the first gauge. Again, however, strain does not provide as much information as pressure. If pressure slightly decreases in the tube but is still positive, the strain record may show this as a change of slope, where as the pressure record will show a change in the sign of the slope. Thus, subtleties will be harder to detect with strain gauges.
DISCUSSION AND CONCLUSIONS
These experiments demonstrate some phenomenology of confinement effects for nondetonative reactions of TNT and Comp-B. A comparison of the blast pressures and impulses for TNT and Comp-B in Figures 6 and 10 shows that, except for the 6.35-mm-thick tubes, the blasts as a function of confinement are similar for the two materials. For the 3.18-mm-thick tubes, the low burst pressure of the tubes controlled the reaction violence, so any differences between TNT and Comp-B were not significant. For the 12.7- and 25.4-mm tubes, blast pressures and impulses were similar for TNT and Comp-B, though TNT had more scatter in the data. This is somewhat contrary to the fragments, witness plates, and internal pressure records, which clearly indicated that the initial reaction of Comp-B was more violent. It is speculated that since both Comp-B and TNT are very brittle [3] and the burst pressures of these tubes are large, much of the explosive is consumed in the high-pressure fireball after confinement has been lost. For TNT, the film frequently showed a slightly delayed fireball. More detailed blast pressure measurements at various distances would be required to determine when the energy release occurs and if the timing is different for TNT and Comp-B.
For the 6.35-mm-thick tubes, the behavior is different between the two explosives. Now the confinement has been weakened sufficiently so that we see a difference for Comp-B and TNT. The Comp-B gives a generally stronger blast wave. This is due to the greater burn rate of RDX as opposed to TNT. At the burst pressures associated with these tubes, the differing burn rates play a role in controlling the blast pressure. This difference is interesting since these tubes have a diameter-to-thickness ratio and burst pressure that are comparable to that for typical artillery shells and since significant differences in nondetonative blast response have been observed for artillery shells loaded with Comp-B and TNT.
wave to steepen somewhat but the pressure histories are insufficient to cause a shock wave to be formed in the TNT. Had the tubes been longer, a shock may have been able to form in the TNT, but this is not of particular interest since it requires a special geometry not expected to be found in most unexploded ordnance (UXO) applications. That does not mean, however, that secondary SDT cannot occur in other UXO scenarios with TNT or other low-reactive explosives. Convergence of pressure waves due to geometric effects or combustion in an area of damaged material may lead to delayed SDT.
As opposed to TNT, with Comp-B, the pressure histories are clearly affected by the reaction. In all cases, the pressures were higher than with TNT. With 3.18- and 6.35-mm-thick tubes, high local pressures were measured and then the pressure decreased as release waves propagated down the tube from the area of local failure. For the 12.7-mm tubes, the pressure does not rapidly decrease and can even rise away from the region of local failure. In Figure 11c, the pressure is higher at gauge location 3 than in location 2, but the local failure was between gauge locations 1 and 2. With the thickest tube, the pressure and reaction are strong enough for the wave to significantly steepen in an attempt to set up a shock wave in the explosive. Thus, it is concluded that local confinement significantly affects the pressure wave emanating from the region of secondary ignition for Comp-B. When applied to a real scenario, this agrees with the observation that reduced local confinement in the area of impact can reduce the yield from UXO with Comp-B or another highly reactive fill. In the UXO scenario, the ignition would occur by impact, whereas, here, there is an apparent secondary ignition in some tubes with Comp-B.
The secondary ignition mechanism is significant, since, if it occurs in a real scenario it could lead to a more violent reaction. Examples of secondary ignition were shown in Figure 8 for a 3.18-mm-thick tube and in Figure 11 for the 3.18- and 6.35-mm-thick tubes. Interestingly though, secondary ignition was not observed for the heaviest confinement. In this case, the pressure wave appears to progress from gauges 1 through 8, as expected. The mechanism for the secondary ignition is not clear from these experiments, but there is some indication of what is not causing secondary ignition. First, this behavior did not seem to occur as readily with TNT, but it is a low-pressure phenomenon. Figure 11 showed that for a 6.35-mm-thick tube, the pressure is much less than a kilobar before ignition breaks out near gauge 2. Similar observations were made for other tubes with secondary ignition. Thus, this is not believed to be a secondary shock initiation. In addition, this is not believed to be due to compression of a void near a gauge, since that mechanism should not prefer thinner tubes. Thus, the exact mechanism is unclear. We have speculated on other mechanisms but prefer not to draw firm conclusions until other more definitive experiments are conducted.
FUTURE WORK
We are about to begin another set of tube experiments. In these experiments, the focus will be on the combustion and the secondary ignition processes separately. In one arrangement, a piston will be used to separate the combustion region from the main charge. A fast burning pistol powder is being used so that a given pressure history can be delivered to the piston, which pushes on the main charge. The pressure waves will be similar to those observed here, but will be decoupled from the primary reaction zone. A second set of experiments will support the nondetonative combustion modeling effort being conducted. Burning experiments with well-defined geometrical cavities are being planned to provide benchmark measurements for the code. One geometry is a short end burning tube with an axisymmetric vent. We expect that as these tests are conducted, and, as phenomena become clearer, additional specialized tests will be required.
REFERENCES
1. Baker, P. J., S. Stegall, and A. Canami, “The Effect of Case Strength, Path Length, and Main Explosive Charge Type on the Performance of Three Main Charge Disrupter Candidates,” ARL-TR, U.S. Army Research Laboratory, Aberdeen Proving Ground, MD, (In Progress)
2. Matheson, E.R., Drumheller, D.S. and Baer, M.R., “A Viscoelastic-Viscoplastic Distension Model for Granulated Energetic Materials,” 1999 JANNAF Propulsion Systems Hazards Subcommittee Meeting, (1999)
3. Lieb, R.J., Leadore, M., Starkenberg, J. and Baker, P.J., “Mechanical Damage and Combustion of TNT and Composition-B,” 1999 JANNAF Propulsion Systems Hazards Subcommittee Meeting, (1999)
5. Fried, L.E., Howard, W.M. and Souers, P.C., “Cheetah 2.0 User’s Manual,” Energetic Materials Center, Lawrence Livermore National Laboratory, (1999)
0 1 2 3 4 5 6 7 8 9
0.00 0.25 0.50 0.75 1.00
[image:10.612.179.435.76.260.2]Thickness (inches) S p ec if ic I m pu ls e ( p si -m s) 0.0 0.5 1.0 1.5 2.0 2.5 P e ak Bl a s t P res su re (p si ) Impulse Pressure
Figure 6. Specific impulse and peak blast pressure measured at 50 ft for TNT-loaded tubes.
0.00 0.05 0.10 0.15 0.20 0.25 0.30 0.35
35.0 35.5 36.0 36.5 37.0 37.5 38.0
Time (ms) P ressu re ( k B a r) 2 4 6 8 8 GAUGES TOTAL
0.0 0.2 0.4 0.6 0.8 1.0 1.2 1.4 1.6
35.0 35.5 36.0 36.5 37.0 37.5 38.0
Time (ms) P ressu re ( k B a r) 2 4 3 1 4 GAUGES TOTAL
(a) 3.18-mm-thick tube (b) 6.35-mm-thick tube
0.0 0.5 1.0 1.5 2.0 2.5 3.0
30.5 31.0 31.5 32.0 32.5
Time (ms) P ressu re ( k B a r) 2 4 3 1 4 GAUGES TOTAL
0 1 2 3 4 5 6
14.2 14.4 14.6 14.8 15.0
Time (ms) P ressu re ( k B a r) 2 4 3 1 8 GAUGES TOTAL
5
6 7 8
(c) 12.7-mm-thick tube (d) 25.4-mm-thick tube
[image:10.612.76.531.299.699.2]LOCAL VIOLENT REACTION
3.18 mm
[image:11.612.90.523.70.376.2]25.4 mm
Figure 8. Example events for 3.18-mm-thick and 25.4-mm-thick Comp-B-loaded tubes.
3.18 mm 6.35 mm
12.7 mm 25.4 mm
[image:11.612.90.519.432.658.2]0 1 2 3 4 5 6 7 8 9
0.00 0.25 0.50 0.75 1.00
[image:12.612.178.434.74.258.2]Thickness (inches) S p ec if ic I m pu ls e ( p si -m s) 0.0 0.5 1.0 1.5 2.0 2.5 P e ak Bl a s t P res su re (p si ) Impulse Pressure
Figure 10. Specific impulse and peak blast pressure measured at 50 ft for Comp-B-loaded tubes.
0.0 0.2 0.4 0.6 0.8 1.0 1.2 1.4 1.6
38.9 39.0 39.1 39.2 39.3 39.4
Time (ms) P ressu re ( k B a r) 2 4 3 1
4 GAUGES TOTAL
0 1 2 3 4 5 6 7
33.2 33.4 33.6 33.8 34.0
Time (ms) P ressu re ( k B a r) 2 4 3 1 8 GAUGES TOTAL
5 6 7 8
(a) 3.18-mm-thick tube (b) 6.35-m-thick tube
0 2 4 6 8 10 12
33.7 33.8 33.9 34.0 34.1
Time (ms) P ressu re ( k B a r) 4 3
8 GAUGES TOTAL BAD DATA ON 1,2
5 6 7 8 0 10 20 30 40 50 60 70 80 90
14.80 14.85 14.90 14.95 15.00 15.05 15.10
Time (ms) P ressu re ( k B a r) 2 4 3 1
8 GAUGES TOTAL
5 6
7 8 7
(c) 12.7-mm-thick tube (d) 25.4-mm-thick tube
[image:12.612.76.528.281.692.2]