Optimization of extraction parameters for the chemical profiling of
3,4-methylenedioxymethamphetamine (MDMA) tablets
Pascal Gimeno, Fabrice Besacier
*,
Huguette Chaudron-Thozet
Laboratoire de Police Scientifique de Lyon, 31 Avenue Franklin Roosevelt, 69134 Ecully, France Received 9 October 2002; received in revised form 6 January 2003; accepted 10 January 2003
Abstract
The extraction of impurities from illegally produced 3,4-methylenedioxymethamphetamine (MDMA) has been studied in order to optimize the parameters. Two different MDMA samples were used. Particular attention was paid to the influence of the pH, the evaporation step, and the sample storage. The method used was an extraction of impurities by diethyl ether from a buffer solution at pH 11.5, followed by gas chromatography (GC) mass spectrometric (MS) analyses after a dryness concentration under monitored conditions of the ethereal extract. Repeat extractions of the same sample gave an average relative standard deviation (RSD) of less than 8.5% within day and less than 10.5% between days.
#2003 Elsevier Science Ireland Ltd. All rights reserved.
Keywords: 3,4-Methylenedioxymethamphetamine (MDMA); Impurities; Gas chromatography; Mass spectrometry; Profiling
1. Introduction
3,4-Methylenedioxymethamphetamine (MDMA) is an illicit synthetic, psychoactive substance possessing stimu-lant and mild hallucinogenic properties. According to Euro-pol, in 2000, 17.4 millions of ecstasy tablets were seized in the member states of the European Union, corresponding to an increase of almost 50% compared with 1999. Significant increases were observed in Austria (420%), Finland (394%), Greece (1803%), Ireland (163%), Italy (86%), The Nether-lands (50%), Spain (64%) and Sweden (152%)[1].
In order to know synthesis schemes used by clandestine laboratories, an analytical method has been developed in order to identify by gas chromatography–mass spectrometry (GC–MS) the various impurities present in ecstasy samples [2]. Nevertheless, several extraction parameters needed to be optimized in order to improve the reproducibility of the method suggested.
As a matter of fact, if many publications deal with a detailed impurity extraction process for the profiling of
amphetamine or methamphetamine samples like the paper of Sten et al. [3], only few articles are concerned with MDMA[4–7]. More authors prefer to focus on the identi-fication of impurities in freshly prepared MDMA samples via different synthesis routes and give us analytical data of precursors, intermediates and reaction by products[8–18]. Among published extraction processes, one consists in dissolving 5 mg of crushed MDMA tablets into 1 ml of redistilled diethyl ether[4]. The supernatant is then taken off and evaporated to dryness before adding 0.1 ml of methyl alcohol for GC–MS analyses. Another paper pre-sents the impurities found in MDMA and MDEA street samples[5]. The extraction method used consists in dis-solving 150–300 mg of each sample into 5 ml of phosphate buffer (pH¼7), in order to have about 80 mg of active substance, the extraction being carried out with 1 ml of diethyl ether containing heneicosane (C21) as internal standard. Other authors also use a phosphate buffer (pH¼6[6]or pH¼9[7]) to dissolve MDMA powders whereas organic impurities are extracted, respectively by dichloromethane[6]and ethyl acetate[7]. In that last study, comparison between liquid–liquid extraction (LLE) and solid phase extraction (SPE) for the profiling of ecstasy tablets is also discussed.
Forensic Science International 132 (2003) 182–194
*Corresponding author. Tel.:
þ33-47-286-8982.
E-mail address:[email protected] (F. Besacier).
2. Materials and methods
2.1. Gas chromatography and mass spectrometry
All analyses were carried out on a Thermofinnigan GC trace 2000 gas chromatograph interfaced with an ion trap Polaris mass spectrometer. Two microliters of each extract were injected according to the splitless mode using a Thermo-finnigan AS 2000 autosampler. The column was a Supelco PTA5 capillary column (cross-linked poly 5% diphenyl/95% dimethylsiloxane); 30 m0:32 mmði:d:Þ 0:5mm film thickness. The oven temperature was programmed as follows: 508C for 1 min, 58C min1 to 1508C for 12 min, and 158C min1 to 3008C for 10 min. The injection port and transfer line temperatures were, respectively 280 and 2758C. The ion source temperature was set at 2008C, and the helium carrier gas flow rate was fixed at 1 ml min1. The mass spectrometer was tuned on electron impact ionization (Ei) for low-mass analysis for detection of each impurity. For the reproducibility and the optimization studies, selected ion monitoring (SIM) was used on the most intense impurity mass fragments. In order to preserve the MS filament life, the mass spectrometer was switched-off during elution of the major compounds.
2.2. MDMA materials
Two different MDMA samples (RefA and RefB) have been used for the optimization of extraction parameters. These samples consisted of 35% MDMA Phosphate diluted with lactose (RefA), and of 99% MDMA hydrochloride (RefB).
2.3. Standard extraction method
An amount of sample equivalent to 10 mg of pure MDMA hydrochloride was weighed and dissolved into 2 ml of a buffer solution at pH 11.5 and shaken for 10 min at 1800 rpm. The extraction was performed adding 3 ml of diethylether and shaking for another 10 min. After centrifugation, the organic layer was transferred to a conic tube and evaporated to dryness under monitored conditions at room temperature (extracts
were evaporated to dryness under a low nitrogen flow rate). Five hundred microliter of diethylether containing n-dode-cane as ISTD at 0.113 ppm were added to the tube, shaken for a few seconds, and transferred to a micro-vial for profile analysis. In order to avoid impurity degradation, the extracts were injected the same day they were prepared.
3. Results and discussion
3.1. Identification of impurities
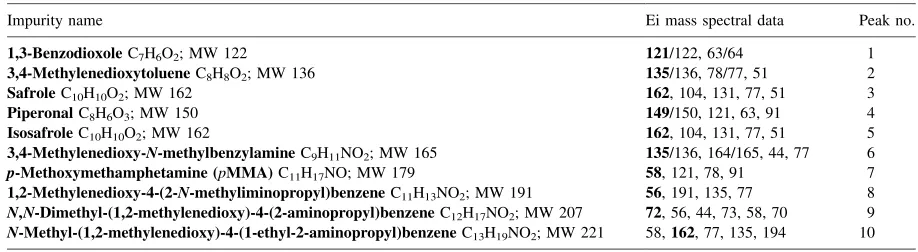
The chromatographic profiles of samples RefA and RefB are shown inFigs. 1 and 2, respectively.Table 1gives peak identity and mass spectral data for impurities used in this study. Target ions used in the SIM mode are bold typed in the table.
3.2. Overall reproducibility of the method
Results were expressed giving relative standard deviation (RSD) of each peak area, acquired according to SIM mode and after normalization, i.e. dividing all areas in a run by the peaks sum. Peaks used for this study were peaks 1–10, for both samples RefA and RefB (Figs. 1 and 2). However, impurity 6 is not present in sample RefB.
3.2.1. Gas chromatography repeatability
Five injections of the same extract from sample RefA gave a minimum relative standard deviation of 1.8% to a maximum of 7.0%, the average value being 4.9%. The same study on sample RefB gave a minimum relative standard deviation of 0.9% to a maximum of 9.3%, the average value being 6.1%.
3.2.2. Overall reproducibility (extraction and gas chromatography)
[image:2.544.39.498.555.681.2]3.2.2.1. Within day. Four extractions by day during 4 days were made from samples RefA and RefB and analyzed. The relative standard deviations for RefA sample varied from 3.5
Table 1
Target impurities in MDMA samples
Impurity name Ei mass spectral data Peak no.
1,3-BenzodioxoleC7H6O2; MW 122 121/122, 63/64 1
3,4-MethylenedioxytolueneC8H8O2; MW 136 135/136, 78/77, 51 2
SafroleC10H10O2; MW 162 162, 104, 131, 77, 51 3
PiperonalC8H6O3; MW 150 149/150, 121, 63, 91 4
IsosafroleC10H10O2; MW 162 162, 104, 131, 77, 51 5
3,4-Methylenedioxy-N-methylbenzylamineC9H11NO2; MW 165 135/136, 164/165, 44, 77 6
p-Methoxymethamphetamine (pMMA)C11H17NO; MW 179 58, 121, 78, 91 7
1,2-Methylenedioxy-4-(2-N-methyliminopropyl)benzeneC11H13NO2; MW 191 56, 191, 135, 77 8
N,N-Dimethyl-(1,2-methylenedioxy)-4-(2-aminopropyl)benzeneC12H17NO2; MW 207 72, 56, 44, 73, 58, 70 9
N-Methyl-(1,2-methylenedioxy)-4-(1-ethyl-2-aminopropyl)benzeneC13H19NO2; MW 221 58,162, 77, 135, 194 10
Fig. 1. Ei/full scan impurity profile of sample RefA.
184
P
.
Gimeno
et
al.
/
F
or
ensic
Science
International
132
(2003)
182
–
[image:3.544.89.666.73.465.2]Fig. 2. Ei/full scan impurity profile of sample RefB.
P
.
Gimeno
et
al.
/
F
or
ensic
Science
International
132
(2003)
182
–
194
[image:4.544.88.656.72.460.2]to 13.3% with an average of 7.7%, and similar results were obtained for RefB sample with a minimum relative standard deviation of 4.6% to a maximum of 11.0% and an average of 8.1%. Table 2 gives the results obtained for each target impurity.
3.2.2.2. Between days. Four extractions by day during four days were made from samples RefA and RefB and analyzed. If we consider sample RefA, the relative standard deviations varied from 6.6 to 16.3% depending on the impurity, with an average value of 10.2%. For RefB sample, values varied
from 7.2 to 12.1% with an average of 9.9%.Table 3gives the results obtained for each target impurity.
3.3. Optimization of extraction parameters
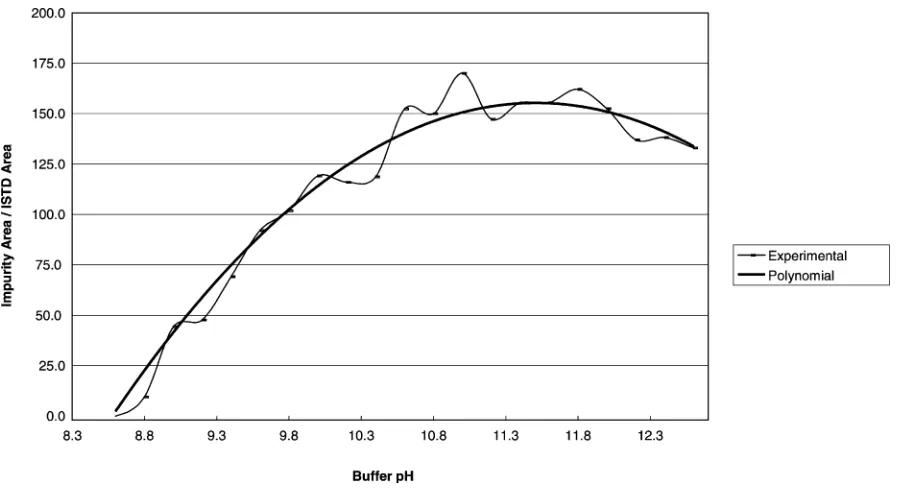
3.3.1. Influence of the pH
[image:5.544.47.501.92.135.2]A buffer solution of glycocoll–NaCl/NaOH was used for the pH study. The pH was changed from 8.4 to 12.6 in increments of 0.2. Results point out that almost all target impurities were strongly influenced by the buffer pH. The extracted impurity amounts increased with the pH from 8.4 Table 2
Within day repeatability (RSD%)
Sample/peak 1 2 3 4 5 6 7 8 9 10 Average
RefA 9.2 6.4 7.1 13.3 8.7 3.5 5.4 9.4 7.8 6.3 7.7
[image:5.544.47.500.180.223.2]RefB 10.3 8.1 11.0 10.3 7.5 6.9 4.6 8.7 5.7 8.1
Table 3
Between days reproducibility (RSD%)
Sample/peak 1 2 3 4 5 6 7 8 9 10 Average
RefA 12.3 8.4 6.6 16.3 10.9 6.9 7.2 12.4 13.0 7.4 10.2
RefB 12.1 9.9 10.9 10.6 10.5 8.9 7.2 11.1 8.2 9.9
Fig. 3. Influence of pH on impurity 3.
[image:5.544.47.500.392.668.2]to 10.5–11.0 where a maximum was reached. Further increase only slightly improved the extracted amounts. For instance, results obtained for peaks 3 and 6 of the sample RefA (corresponding respectively to the lower and the higher impurity peak area) for a pH range from 8.6 to 12.6 are plotted inFigs. 3 and 4.
Moreover, the relative standard deviations resulting from extractions between pH 10.8 to 12.0 were not sig-nificantly higher than in the within day study (Table 4). Therefore, a buffer pH of 11.5 was chosen and small variations due to, for instance, buffer storage could be accepted.
3.3.2. Influence of the extraction solvent
Five different solvents were tested at the optimum buffer pH (11.5), for the extraction of impurities from sample RefA: diethyl ether, chloroform, cyclohexane, butyl alcohol and toluene. The extraction was processed as follows: an amount of sample equivalent to 10 mg of pure MDMA hydrochloride was weighed and dissolved into 2 ml of a buffer solution (pH 11.5) and shaken for 10 min at 1800 rpm.
Five hundred microliter of the extraction solvent were then added and shaken for 10 min. After centrifugation, the organic layer was transferred to a micro-vial, and 2ml of the extracts were injected.
The normalized impurity areas obtained for each solvent are shown inFig. 5. As we can see, diethyl ether seems to better extract low amount impurities (peaks 2, 4, 5) than other solvents such as butyl alcohol or toluene, even if impurity 10 does not have a good extraction yield. Impurity 8 was not considered because with some solvents (chloro-form and toluene) the chromatographic peak was eluted with MDMA.
3.3.3. Influence of the shaking times
Three different shaking times (5, 10, and 20 min) were tested for the dissolution and the extraction steps for sample RefA. Results point out the necessity to shake the tube at least 10 min at each step in order to optimize both processes. Increasing the shaking times up to 20 min only slightly improved the results, therefore 10 min was chosen as the best compromise.
[image:6.544.47.496.65.311.2]Fig. 4. Influence of pH on impurity 6.
Table 4
Relative standard deviations (calculated from the area ratio between each impurity and the ISTD) obtained for samples RefA and RefB extracted from buffer pH 10.8 to 12.0
Sample/peak 1 2 3 4 5 6 7 8 9 10 Average
RefA 10.9 5.9 11.8 13.1 9.3 5.0 4.7 8.6 5.2 2.0 7.6
RefB 14.0 6.6 10.2 9.6 10.5 4.9 11.2 5.3 5.9 9.1
[image:6.544.41.499.387.430.2]Fig. 5. Influence of the extraction solvent (RefA).
188
P
.
Gimeno
et
al.
/
F
or
ensic
Science
International
132
(2003)
182
–
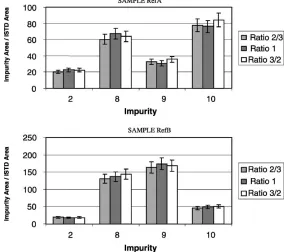
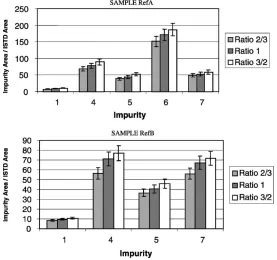
[image:7.544.93.662.122.428.2]3.3.4. Distribution of impurities between extraction phases
In order to evaluate the distribution of impurities between diethyl ether and the buffer solution at pH 11.5, the amounts of diethyl ether and buffer were varied, while keeping the amount of samples (10 mg of pure MDMA) constant (Table 5). This evaluation was performed by direct compar-ison of the impurity area ratio (impurity area/ISTD area) depending on the volume ratios used.
As we can see inFig. 6, some of the impurities (2, 8–10) have almost the same amounts extracted whatever is the ratio used, indicating that most of these impurities have been extracted. Others (1, 4–7) seem to depend more on the ratio between diethyl ether and the buffer, which indicates a lower extraction yield (Fig. 7). Therefore, the ratio 3/2 was pre-ferred.
3.3.5. Influence of consecutive extractions
Three consecutive extractions of samples RefA and RefB were made. Results point out that even after a third
extrac-tion some MDMA impurities were still extracted. Fig. 8 shows the impurity amount extracted for the second and third extractions, compared to the first one for impurities 1, 4, 5 and 7. As expected, these impurities with low distribu-tion ratios between diethyl ether and buffer are still present in the third extract. Nevertheless, other impurities (2, 3, 6, 8– 10) were no longer detected at the second extraction.
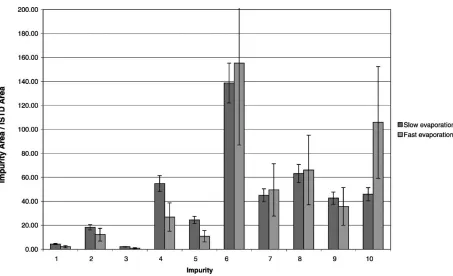
3.3.6. Influence of solvent evaporation
In order to investigate the influence of the evaporation step, four experiments involving three extractions each were performed on samples RefA and RefB. The first one con-sisted in evaporating extracts to dryness under a minimum nitrogen flow rate and stopping it right after complete evaporation (45 min approximatively). The second serie was performed using the same evaporation conditions but with a fixed time of 1 h and 45 min in order to study a possible impurity degradation. The third and fourth experi-ments had the same differences (changeable time VS fixed time) but with a high nitrogen flow (complete evaporation was performed in less than 10 min).
[image:8.544.41.257.91.145.2]First of all, no significant differences were observed between stopping or not the evaporation right after dryness. Therefore, it could be possible to use a longer evaporation time which allows not to look after the samples. Moreover, for all target impurities, the high evaporation speed increase the relative standard deviations obtained (Fig. 9points out this influence for the sample RefA). Therefore, a slow rate has to be preferred.
Table 5
Distribution of impurities between extraction phases
Diethyl ether (ml) Buffer (ml) Ratio
2 3 2/3
3 3 1
3 2 3/2
Fig. 6. Distribution of impurities 2, 8–10 between extraction phases (samples RefA and RefB).
[image:8.544.126.413.411.663.2]3.3.7. Storage of an extract
As the extraction process and the run time analysis (50 min) are quite long, they could lead to prepare numerous extracts and store them before analyses. In order to deter-mine the best conditions to store the extracts, and to study the stability of impurities, three experiments were made on sample RefA. Two extracts were stored in the dark and, respectively at 68C and at ambient temperature. The third extract was exposed to day light at ambient temperature. All three extracts were analyzed the same day they were pre-pared and after 1–3 days. An internal standard (n-dodecane) was added to determine the stability of all impurities. The peak area ratios between each target impurity and the internal standard were calculated for each storage time relative to the initial ratios. Impurity peak 3 could not be considered in this study due to its very low amount in the sample. Fig. 10 shows us the stability of impurities for extracts stored in a refrigerator (in the dark and, respectively at 68C).
Regardless of impurity and even storage conditions, dra-matic loss was noticed after 2 days of storage for most impurities, apart from impurities 8 and 10 which did not show changes larger than expected from analytical errors. Therefore, the extracts need to be analyzed the same day they are prepared.
We can also notice an increase of impurity 2 regardless of storage conditions. As a matter of fact, this impurity (3,4-methylenedioxytoluene) is the common fragment of all
impurities, therefore a total degradation of other compounds might lead to its formation.
3.3.8. Influences of sample size and addition of lactose To investigate the influences of sample size and addition of lactose, two series of extractions were performed on sample RefB. The first serie consisted of two experiments using different amounts (9–11 mg) of pure MDMA HCl. The relative standard deviation were then calculated between 9–10 mg on one hand and 10–11 mg on the other hand and compared to results obtained with the within day repeatability (8.1%). The relative standard deviations obtained varied from 2.6 to 15.4% with an average of 8.7%, pointing out no significant influence of size variation on the results.
[image:9.544.136.413.69.329.2]The second serie was performed to evaluate how lactose, which is the most common diluent, influences the extraction of impurities. For this experiment, different amounts of lactose (0, 50, 60, 70, 80 to 90%) were added to sample RefB.Fig. 11show the influence of lactose on the normal-ized impurity areas. The relative standard deviations varied from 5.4 to 16.6% with an average of 10.9%. If we consider samples diluted with an amount of lactose from 0 to 70%, the deviations decreased from 3.5 to 14.9%, with an average of 7.4%. As a matter of fact, amounts of lactose higher than 60% seem to influence the extraction of impurities 8–10 (Fig. 11). It is then necessary to apply the method to samples diluted with less than 60% of lactose.
Fig. 8. Influence of consecutive extractions.
P
.
Gimeno
et
al.
/
F
or
ensic
Science
International
132
(2003)
182
–
194
[image:10.544.108.653.99.443.2]3.3.9. Influence of volume variations
Three solvent volumes were studied: buffer, extraction solvent (diethyl ether) and recovery solvent (diethyl ether).Table 6shows the various volumes tested as well as the accuracy of the dispenser used. It can be noticed that the volume variation chosen were much larger than instrument accuracy. As a matter of fact, each variation corresponds to one graduation on the solvent dispenser
that is for instance 0.1 ml for the 5 ml dispenser used in the buffer study.
Within each study, the normalized impurities areas and the relative standard deviations were calculated (Table 7). From a global point of view, only the recovery solvent volume has a significant influence on the results with an average RSD of 13.2% for sample RefA and 11.2% for sample RefB. However, volume variations of the other two Fig. 9. Influence of solvent evaporation (sample RefA).
[image:11.544.49.502.62.338.2] [image:11.544.145.407.500.663.2]solvents seem to influence some particular impurities like 2 and 3 for the buffer, 8 and 10 for the extraction solvent. Fortunately, all these variations are unlikely to occur if the solvent dispensers are calibrated and checked on a regular basis.
4. Conclusion
[image:12.544.132.410.63.392.2]The developed extraction method proved to be repeatable and reproducible. Repeat extractions of the same sample gave an average relative standard deviation of less than 8.5% within day and less than 10.5% between days. It was observed that small variations of the MDMA amount (9– 11 mg) gave comparable impurity profiles, and that the most common additive (lactose) did not influence the impurity Fig. 11. Influence of the addition of lactose on the impurity extraction (sample RefB).
Table 6
Influence of volume variations (buffer, extraction solvent, recovery solvent)
Solvent Buffer
volume (ml)
Extraction volume (ml)
Recovery volume (ml)
Dispenser accuracy (ml)
First serie buffer 1.90 3.00 500 20 2.00
2.10
Second serie extraction
2.00 2.80 500 15
3.00 3.20
Third serie recovery 2.00 3.00 400 3.5 500
[image:12.544.280.498.453.556.2]600
Table 7
Influence of volume variations (samples RefA and RefB)
Sample RSD%
Solvent Minimum Maximum Average
RefA Buffer 6.1 20.8 11.5
Extraction 3.7 18.2 10.9
Recovery 4.8 21.7 13.2
RefB Buffer 4.9 14.5 9.2
Extraction 4.3 13.5 7.3
Recovery 4.5 16.0 11.2
[image:12.544.42.258.538.681.2]profile if its amount is below 60%. Most impurities are extracted at pH 11.5 and a higher pH did not give significant improvements. Diethyl ether seems to better extract low amount impurities (2, 4, 5) than other solvents like butyl alcohol or toluene, even if butyl alcohol is more interesting for impurity 10.
A fast nitrogen flow rate means a quick evaporation time but it also leads to a worse precision of the results. Therefore, a slow flow rate has to be preferred.
According to the experiments, large variations of the solvent volumes seem to have a significant influence on the precision of the method. It is then absolutely necessary to use calibrated and reproducible dispensers. Finally, extracts could not be stored more than one day and need to be analyzed the same day they are prepared to avoid impurity degradation.
Acknowledgements
M. Gimeno thanks Ms Laure Morandat for her technical assistance. The authors are grateful to the financial support from the MILDT (Mission Interministerielle de Lutte contre la Drogue et la Toxicomanie).
References
[1] Anon., European Union situation report on drug production and drug trafficking 2000–01, Europol, Hague, 2001. [2] P. Gimeno, F. Besacier, H. Chaudron-Thozet, J. Girard, A.
Lamotte, A contribution to the chemical profiling of 3,4-methylenedioxymethamphetamine (MDMA) tablets, Forensic Sci. Int. 127 (2002) 1–44.
[3] C. Sten, L. Jonson, N. Artizzu, Factors influencing the extraction of impurities from Leuckart amphetamine, Foren-sic Sci. Int. 93 (1998) 99–116.
[4] R.J. Renton, J.S. Cowie, M.C.H. Oon, A study of the precursors 3,4-methyenedioxymethylamphetamine and its application to forensic drug analysis, Forensic Sci. Int. 60 (1993) 189–202.
[5] E. Lock, Impurities found in MDMA and MDEA street samples: synthesis, identification and interpretation, in: Proceedings of the ENFSI First European Meeting of
Forensic Science, Lausanne, Switzerland, 17–19 September 1997.
[6] M. Bohn, G. Bohn, G. Blaschke, Synthesis markers in illegally manufactured 3,4-methylenedioxyamphetamine and 3,4-methylenedioxymethamphetamine, Int. J. Legal Med. 106 (1993) 19–23.
[7] A.M. Rashed, R.A. Anderson, L.A. King et al., Solid-phase extraction for profiling of ecstasy tablets, J. Forensic Sci. 45 (2000) 413–417.
[8] D. Stein, The use of heliotrope oil as a precursor source for piperonal, J. Clan. Lab. Invest. Chem. 6 (1996) 17–18. [9] Drug Enforcement Administration, Uncommon precursor
sour-ces used in 3,4-methylenedioxymethamphetamine (MDMA), Microgram 32 (1999) 193–194.
[10] A. Poortman, Unusual manufacturing of MDMA in The Netherlands, J. Clan. Lab. Invest. Chem. 8 (1998) 25–26. [11] R.R. Laing, B. Dawson, Identification of the major product
from the Ritter reaction using safrole, J. Clan. Lab. Invest. Chem. 7 (1997) 22–26.
[12] T.A. Dal Carson, An evaluation of the potential for clandestine manufacture of 3,4-methylenedioxyamphetamine (MDA) analogs and homologs, J. Forensic Sci. 34 (1990) 675–697.
[13] C. Randall Clark, F. Taylor Noggle, J. DeRuiter, GC–MS analysis of products, intermediates and by-products in the synthesis of MDA from isosafrole, Microgram 27 (1994) 188–200.
[14] T. Lukaszewski, Spectroscopic and chromatographic identi-fication of precursors, intermediates, and impurities of 3,4-methylenedioxyamphetamine synthesis, J. Assoc. Off. Anal. Chem. 61 (1978) 951–967.
[15] F.T. Noggle, C. Randall Clarck, J. Deruiter, Gas chromato-graphic and mass spectrometric analysis of samples from clandestine laboratory involved in the synthesis of ecstasy from sassafras oil, J. Chromatogr. Sci. 29 (1991) 168–173. [16] A.M.A. Verweij, Clandestine manufacture of
3,4-methylene-dioxymethamphetamine (MDMA) by low pressure reductive amination. A mass spectrometric study of some reaction mixtures, Forensic Sci. Int. 45 (1990) 91–96.
[17] A.M.A. Verweij, Impurities in illicit drug preparation (XXIV). Spectroscopic properties of some compounds present in essential oils, used as starting compounds in the synthesis of ‘‘designer drugs’’ of the phenethylamine type, Microgram 28 (1995) 224–228.