PRODUCTIVITY IN THE IRISH
ROAD FREIgHT INDUSTRY
CIARÁN AYLWARD AND RONNIE O’TOOLE
1AbstRAct
This chapter reports the results of a study into productivity in the Irish road freight industry. The results indicate that productivity in the industry, measured as tonne-kilometres per employee, increased by per cent between 995 and 00. Increases in the average size and capacity of goods vehicles accounted for per cent of that increase, with improvements in capital efficiency accounting for the remaining eight per cent. In other words, there were more large goods vehicles on the road in 00 that were being utilised more efficiently than there were in 995.
8.1 Introduction
The purpose of this chapter is to provide an assessment of the productivity performance of the Irish road freight industry and the factors that influenced this performance. Our definition of the Irish road freight sector is based on the parameters outlined in the Central Statistics Office’s Road Freight Transport Survey. Broadly, the Irish road freight industry includes all firms that are mainly engaged in the transportation of freight by road, and firms engaged in renting vehicles with drivers for road freight transport.
We estimate that productivity in the industry, measured in tonne-km per employee, increased by per cent between 995 and 00. Tonne-kilometres (tonne-km) is the recognised measurement of output for the road freight industry, and is calculated by multiplying the number of tonnes carried by a vehicle by the number of kilometres travelled.
Measuring the productivity performance or the efficiency of sectors that are predominately domestically traded has become increasingly important in Ireland. Since these sectors are only open to limited international competition, the services on offer can often be over priced, of poor quality and hinder the overall competitiveness of our economy. Productivity growth in the road freight sector can aid the Irish economy in three primary ways:
. Productivity growth can help by ensuring the cost of transporting goods for industry via road freight remains competitive;
. Productivity growth can improve the quality and speed of service being delivered;
. Productivity growth has the potential to reduce the number of vehicles on our roads, which can in turn, lessen the welfare and monetary costs associated with traffic congestion.
Section 8. of this chapter presents an outline of the key characteristics of the sector and its importance to the Irish economy. Section 8. describes the choice of measure of productivity used in this study, while Section 8. decomposes the estimate of productivity into the roles played by improvements in carrying capacity and capital efficiency. Section 8.5 outlines some additional underlying factors that have influenced the industry’s productivity performance, while Section 8. concludes.
8.2 The Irish road Freight Industry
Some key characteristics of the road freight sector are as follows:• The road freight industry is an important element in Ireland’s economic growth and employment. With less than three per cent of freight transported by rail in 00, the great majority of all freight is transported by road.
• Between 995 and 00, road freight output in terms of tonne-km trebled to almost million while direct employment in the sector almost doubled from 7,78 to 5,58 employees.
• The road freight industry in Ireland is characterised by a large number of small companies. There are about 5,000 licensed haulage operators in Ireland. Evidence would suggest that about 55 per cent of all operations are one vehicle firms with just four per cent of all operations having ten or more vehicles (Laoide-Kemp and O’Keefe, 00).
• There are two broad categories of regulations that affect the road freight industry; regulations on traffic and vehicles (i.e. regulations on the carriage of hazardous substances) and regulations on the operation of the market (i.e. regulations on price and market access). Regulations on the operation of the market were largely removed in most OECD countries, including Ireland, by the early 990s. There are still a significant number of regulations governing vehicle operation.
• The industry is fiercely competitive, and profit margins are low. Road freight operators are deemed to be price takers rather than price makers.
• The internationalisation of the road freight transport industry varies widely across countries, though is relatively small in geographically peripheral nations such as an island like Ireland. International journeys accounted for per cent of the total tonne-km of Irish registered vehicles in 00.
• The industry is divided into the activities of ‘hire or reward’ vehicles (i.e. dedicated haulage companies who are not the owners of the goods being transported) and ‘own account’ vehicles (i.e. firms who transport their own goods with their own vehicles). In 00, vehicles used mainly for 'hire or reward' accounted for per cent of all registered goods vehicles, but transported 7 per cent of the total output measured in tonne-km. • Since 995, there has been a decline in the percentage of goods being transported for
agricultural purposes (i.e. foodstuffs, fertilisers and live animals); while there has been an increase in the percentage of goods being transported for manufacturing (i.e. chemical and metal products) and construction purposes (i.e. building materials and minerals).
8.3 Measure of productivity
In this chapter, productivity is measured in tonne-km per employee per annum. Where it is difficult to find directly comparable measures of labour input (i.e. when comparing our performance relative to the UK), an alternative is used, namely tonne-km per vehicle per annum. Assuming that the ratio of hours worked to the number of vehicles does not differ greatly over time or between countries, these two measures should show very similar results.
Tonne-km per employee is a measure of actual output of the road freight industry, and is widely used for international comparisons of output and productivity in road freight. Its principal drawback is that it does not allow for the fact that transport companies might be adding value in other ways than merely moving more produce longer distances. For example, they might be providing more refrigerated trucks, which will protect produce from spoilage. In what follows, efforts are made to highlight such cases where improvements in quality may not be captured using tonne-km as a measure of productivity.
added will be lower in a poorer country such as Russia, even if Russian freight workers have exactly the same efficiency as their Irish counterparts.
Attempts have been made to account for these differences through purchasing power parity adjustment, though these are generally recognised as being unsatisfactory for the analysis of specific industries.
8.4 analysis of productivity Changes,
1995-2003
5
Output from the industry measured in terms of tonne-km tripled between 99 and 00, while direct employment only doubled, indicating a strong rise in output per worker. We estimate that productivity in the Irish road freight sector increased by per cent between 995 and 00.
The sources of productivity changes in the road freight industry can be divided into two effects, namely the Carrying Capacity Effect and the Capital Efficiency Effect. In terms of the Carrying Capacity Effect, if drivers operate bigger vehicles with larger carrying capacities this will have a positive influence on productivity, assuming the same average laden factor. Capital efficiency on the other hand is a measure of how intensively vehicles are being used. As such, the Capital Efficiency Effect is when there is an increase in the amount of goods transported given a fixed level of carrying capacity.
8
Figure 8.1: Decomposition of Productivity Changes, 995-00
Source: Authors Calculations.
Despite this improvement, we also estimate that the productivity of the Irish road freight sector to be only 70 per cent of the UK level (measured as tonne-km per vehicle per annum). Irish goods vehicles have smaller carrying capacities, are emptier for longer, travel fewer kilometres and have lower average laden factors. The longer average journeys length in the UK can only account for a small share of this differential.
The sources of the increase in Ireland’s productivity improvements differ greatly from that observed in other European countries. A study by McKinsey Global Institute (MGI) on the causes of productivity improvements in the French and German road freight industries estimated that only 50 per cent of total productivity gains could be explained by the Carrying Capacity Effect (McKinsey, 00). In Ireland, almost 5 per cent of the total improvements in productivity were explained by the Carrying Capacity Effect. The Capital Efficiency Effect played a much more important role in terms of increasing the productivity of the French and German freight industries than was the case in Ireland. This suggests that the French and German road freight industries have been able to extract efficiencies that the Irish road freight industry has not, and that there is still considerable room for improvement in Ireland.
8.4.1 the Carrying Capacity effect
One way of improving the average size of load per driver is to increase the average vehicle size with larger carrying capacities. This is called the Carrying Capacity Effect. Our estimates indicate that the increase in carrying capacity accounted for most of the productivity gains in the sector. This section outlines how average vehicle size and carrying capacity increased between 995 and 00.
ä Óä {ä Èä nä £ää £Óä £{ä
£x
*À`ÕVÌÛÌÞ *iÀViÌ>}iÊ Ó¯
³££¯
³Ç¯ n¯ ³£{¯
>`i` ÕÀiÞÃ
ÛiÀ>}iÊ >`i >VÌÀ
ÕÀiÞÃÊ
*iÀÊ7ii ,iÃ`Õ> >ÀÀÞ}Ê>«>VÌÞ vviVÌ
ÓääÎ >LÕÀ *À`ÕVÌÛÌÞ
Goods Vehicles by Weight Category
In 995, trucks in the two heaviest vehicle weight categories accounted for per cent of registered goods vehicles and carried 5 per cent of total tonne-km.7 By 00, the number of vehicles within these two weight categories had increased to per cent of registered goods vehicles, and carried almost 7 per cent of total tonne-km.
Goods Vehicles by Body Type
[image:6.482.61.430.308.563.2]A change in the type of truck body being used in the industry also reveals that there has been a shift towards the use of larger vehicles with larger carrying capacities. Vehicles in the ‘platform or sided’ and ‘box or van body’ categories, categories that would generally be classified as being relatively small in terms of weight and carrying capacity, transported 80 per cent of total tonne-km in 995. In 00, these two categories transported just per cent of total tonne-km. In contrast, the percentage of tonne-km being transported by vehicles with larger capacities, for example ‘tipper trucks’ and ‘insulated or refrigerated box trucks’, increased significantly during the same time period.
Figure 8.2: Percentage of Tonne-km Transported by Body Type, 995-00
Source: CSO, Road Freight Transport Survey, various editions.
£x ÓääÎ
*>ÌvÀÊÀÊ-`i` /««iÀ
/>iÀÊÀÊÌ iÀÊLÕÊV>ÀÀiÀ
ÃÕ>Ìi`ÊÀÊ,ivÀ}iÀ>Ìi`Ê Ý ÝÊÀÊ6>Ê `Þ
ÛiÃÌVÊV>ÀÀiÀ "Ì iÀ ä
Óä {ä Èä nä £ää £Óä
50
8.4.2 Capital efficiency effect
We estimate that goods vehicles were used eight per cent more efficiently in 00 than they were in 995. There are a number of factors that led to this improvement in the Capital Efficiency Effect. Some factors had a positive impact, some made no impact, while others had a negative impact.
Positive Impact
Average laden factor (+ 11%)
Our calculations suggest that the increase in the average laded factor (i.e. weight carried) made the most telling contribution towards improving capital efficiency. We estimate that the average goods vehicle, holding vehicle size constant, carried per cent more tonnage in 00 than in 995. This was despite a large increase in the average truck size – in other words, the larger trucks in Ireland in 00 were even fuller (as a percentage of their total capacity) than were smaller trucks in 995.
The most probable explanation for this is to be found in the increase in the scale and number of Irish manufacturers, and the increased volume of imports over the course of the period 995 to 00. Against this is the trend towards an economy based on high value goods which are more time sensitive and therefore where the lower transport costs brought about by a more efficient utilisation of trucking capacity would be of less importance. For example, the increased demand for just-in-time deliveries in manufacturing firms in Ireland would tend to reduce the average laden factor of the freight industry. The average laden factor of heavy goods vehicles in the UK, Denmark and the Netherlands have remained stable or declined over recent years, indicating that Ireland has bucked the trend in this regard.8
Journeys per week (+ 7%)
An increase in the average number of journeys per week would indicate that goods vehicles are being used more intensively. We estimate that there has been a 7 per cent increase in the number journeys being made per week by the average Irish truck. The increase in the average laden factor in addition to this increase in the number of weekly journeys has resulted in there being more trucks in 00 making more journeys carrying heavier weights than there were in 995.
No Impact
Average length of haul (0%)
If a goods vehicle completes more long journeys per week, productivity measured in tonne-km would increase. While a potentially important factor, journey length is outside the control of the industry since it is influenced mainly by the geographic size and location of population centres and industry within a country.
Examining tonnage carried (as opposed to tonne-km) from region of origin to region of destination can provide us with some additional insights on how the movements of the freight fleet can influence productivity. The data indicates that on average approximately 78 per cent of total tonnes hauled started and finished within the same region. These figures have remained virtually unchanged between 995 and 00. This would suggest that the majority of tonnes carried in Ireland are generally transported relatively short distances, and that those vehicles that are travelling longer distances are generally carrying lighter loads.
Negative Impact
Empty Running (-2%)
[image:8.482.61.427.362.604.2]Data on the percentage of journey time that a vehicle is empty indicates that the overall rate has increased slightly from 7 per cent in 995 to 8 per cent in 00. Examining the data by main use of vehicle provides some interesting results (see Figure 8.). Rates of empty running for goods vehicles used by local authorities have deteriorated from per cent to 5 per cent between 995 and 00, while rates for vehicles used in the building and construction industry have also deteriorated from 5 per cent to per cent. In contrast, empty running rates for vehicles operating in the manufacture of drink, tobacco and food have all improved since 995. This suggests that some freight sectors are operating more efficiently than others (see 8.5. for more detail).
Figure 8.3: Levels of Empty Running by Freight Sector, 995-00
Source: CSO, Road Freight Transport Survey, various editions.
ä £ä Óä Îä {ä xä Èä
£x ÓääÎ
¯
ÀÊ>` /L>VV /À>ëÀ
Ì
`ÊE
ii`}Ê-ÌÕv
vÃ
"Ì iÀ
ÃÌÀLÕÌ
>Õv>VÌÕÀ}
"Ì iÀ
>Õv>VÌÕÀ}
À
i>iÀià EÊ}À
ÃÌÀ
ÕVÌ
>ÃÃ]ÊiiÌÊE >ÞÊ«À
`ÕVÌÃ }ÀÊE
ÛiÃÌV }ÊE +Õ>À
ÀÞ} V>
5
8.5 Underlying Influences
The previous section described the factors that directly influenced the productivity performance of goods vehicles over the period under investigation. Industry and statistical evidence indicates that there are other underlying influences on productivity growth, notably industry characteristics, that have a more indirect, yet significant impact on vehicle efficiency. In contrast to Section 8., it is not possible to accurately measure the influence that these factors had on determining our overall productivity growth rate of per cent. This section categorises these factors based on whether they are thought to have had a positive or indeterminate influence on productivity growth.
Positive Impact
8.5.1 Distribution Centres
Distribution Centres (DC) for a set of products are warehouses or other specialised buildings that are stocked with products to be re-distributed to retailers or wholesalers. Historically goods were delivered by manufacturers and suppliers directly to individual stores. This resulted in multiple drops of relatively low volumes over dispersed locations and was an inherently sub-optimal operation in terms of the efficiency of freight haulage operations. The introduction of DC has meant that deliveries from manufacturers and suppliers are now limited to large volume deliveries directly into a DC. Within centres, the complete range of stock is available to dispatch, and an individual vehicle can typically leave a DC with the total daily delivery requirement for one to three stores within a small region. Thus the overall mileage required to supply a given store with a full range of stock is far less than it otherwise would be.
The centres have allowed for the introduction of complex logistics functions that reduce order times, give greater product availability in shops and minimise stockholding while also placing the logistics function under the control of retailers and away from suppliers and their agents. Furthermore, large retail organisations have been able to retain control of the supply chain while outsourcing the operation of the logistics function to third party logistics providers.
While smaller independent retailers are still served directly by local agents and suppliers, the vast majority of Ireland’s multiples and symbol groups now operate through a DC, particularly in the retail sector. Indeed, the Irish outlets of some British owned retailers are served directly from DC located in the UK, through daily deliveries via ferries.
Case studies emerging from the UK highlight the impact that more advanced ICT systems can have on improving fleet efficiency.0 For example, trials established that Glanbia in the UK could save up to £00,000 a year by introducing a fleet management tracking system that makes sure that drivers can be re-routed quickly and efficiently, that drivers follow recognised routes and at authorised speeds and that vehicle idle time is reduced. Driver habits also changed for the better as drivers began to return to the depot earlier, avoiding unnecessary overnight stays. The system also provided a warning if the trailer temperature fell outside a specific range and allowed the company to supply their customers with records of the transit temperature of goods. The UK Government is encouraging the greater adoption of ICT, or Intelligent Transport Systems as an integral part of its ten-year plan for a modern transport system.
No Impact/Indeterminate
8.5.3 product Mix
Productivity performance can vary depending on what types of goods are being transported. Some bulky, heavy goods are relatively easy to transport compared to goods that have specialised transport requirements, for example, a requirement for temperature controlled vehicles. If there is a significant increase or decrease in the transport activity of a particular type of good, this can influence the aggregate productivity performance of the industry.
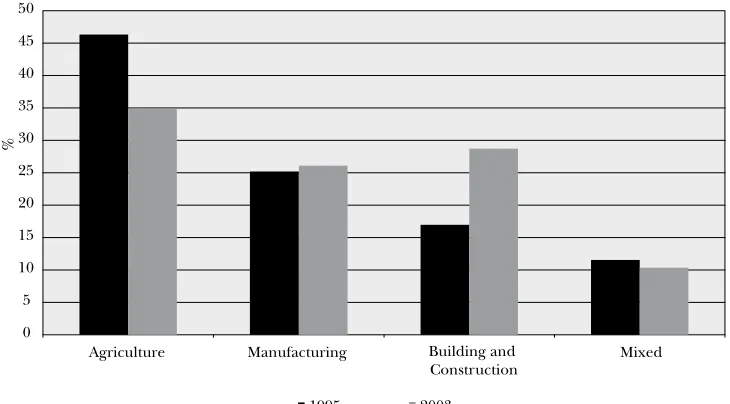
[image:10.482.61.426.426.628.2]The Road Freight Transport Survey breaks down the overall output of the road freight industry (in terms of tonne-km) into groups of different good categories. This tells us what percentage of the overall output is accounted for by the transport of different goods. Figure 8. outlines the transport activity by group of good. For simplicity, each of the different good categories are grouped as being either ‘Agricultural’, ‘Manufacturing’ ‘Building and Construction’ or ‘Mixed’.
Figure 8.4: Percentage of Aggregate Industry Output (in Tonne-km) Transported by Group of Goods, 995 and 00
ä x £ä £x Óä Óx Îä Îx {ä {x xä
}ÀVÕÌÕÀi >Õv>VÌÕÀ} Õ`}Ê>`Ê
ÃÌÀÕVÌ Ýi`
5
Transport activity (in tonne-km) in Agriculture fell by 5 per cent and by 0 per cent for Mixed goods between 995 and 00, while transport activity in Manufacturing rose by four per cent, and by almost 9 per cent in Building and Construction. The phenomenal growth of the construction industry has increased the use of vehicles with larger carrying capacities (i.e. tipper trucks, see Section 8..), the main contributing factor towards productivity growth in the industry for the period 995 to 00 according to our earlier analysis. This may have artificially increased productivity growth in the industry.
8.5.4 Main Use of Vehicle
[image:11.482.61.426.309.523.2]In terms of the main use of vehicle, goods vehicles are categorised as being used for either ‘hire or reward’ (HR) or for ‘own account’ (OA) transport. Vehicles that were used for HR purposes performed 7 per cent of the total transport activity in both 995 and 00. Given that HR vehicles accounted for only per cent of all relevant vehicles in 995 and 00, it is clear that they were used more intensively than vehicles used mainly for OA transport. Examples of how HR vehicles are working more intensively are illustrated in Figure 8..
Figure 8.5: Efficiency of HR versus OA Vehicles, 00
Source: CSO, Road Freight Transport Survey, various editions.
• Kilometres and Tonnes Carried: Despite the fact that HR vehicles accounted for only per cent of all registered vehicles, they travelled 58 per cent of the total vehicle kilometres and were responsible for 59 per cent of the total weight of goods carried in 00;
• Efficient use of Large HR Vehicles: In 00, the ,000 registered HR vehicles in the two heaviest weight categories carried over 5 per cent of total tonne-km transported. The 0,000 OA vehicles registered in the same weight category transported just 9 per cent of total tonne-km;
ä £ä Óä Îä {ä xä Èä Çä nä
,i}ÃÌÀ>ÌÃ /i i>ÛiÃÌ
>Ìi}Àià ,Õ}«ÌÞ `iÊ/i
ÀiÊÀÊ,iÜ>À` "ÜÊVVÕÌ
• Empty Running: In 00, HR vehicles were empty for 5 per cent of the kilometres travelled; OA vehicles were empty for 0 per cent of the time;
• Idle Time: In 00 HR vehicles were idle for 9 per cent of the time during any one survey week compared to 5 per cent of vehicles used mainly for OA purposes.
This analysis indicates that HR trucks were used more intensively between 995 and 00 than OA trucks. HR vehicles have larger carrying capacities; carry heavier loads, spent more time on the road and less time being empty or idle.
8.5.5 average Fleet Size
In Ireland the road freight industry is characterised by a large number of small companies. There are about 5,000 licensed haulage operators in Ireland. As outlined in Section 8., evidence suggests that about 55 per cent of all operations are one vehicle firms with just four per cent of all operations having ten or more vehicles. The average Irish fleet size of three has changed little between 995 and 00. As with Ireland, about half of all operators in the UK have just one vehicle, with the number of operators with large fleets being relatively small. In 00, less than one per cent operators had fleets of over 00 vehicles. These operators, however, owned per cent of all registered goods vehicles. The number of goods vehicle operators in the UK has fallen from ,000 in 99 to 0,000 in 00 with the effect that the average fleet size has increased steadily, from . vehicles to .9 vehicles.5
8.5.6 traffic Congestion and Infrastructure
The productivity benefits accrued from there being more vehicles with larger carrying capacities may be lost if deliveries are delayed because of traffic congestion and poor infrastructure. Industry feedback suggests that traffic congestion, particularly in the Dublin region, is having a negative influence on productivity. Indeed, data from the Dublin Transport Office (DTO) indicates that average car journey times during peak morning traffic in the city increased by seven minutes between 00 and 00, while additional data published in this year’s Annual Competitiveness Report (ACR) measuring the average peak-hour speed of cars and motorcycles, ranks Dublin 8th out of 0 cities. Bottlenecks in the access to major ports and road arteries can add significantly to the journey times for goods transport, and infrastructure such as the Dublin Port Tunnel should increase the efficiency of transport through the port.
5
8.6 Conclusions
The purpose of this chapter is to provide an assessment of the productivity performance of the Irish road freight sector. Our results suggest that productivity in the sector increased by per cent between 995 and 00, mainly due to increases in carrying capacity with larger trucks being used, but also because of improvements in capital efficiency with increased load factors and improvements in logistics and supply chain management techniques. Despite the improvement, when compared with the UK, we estimate that the productivity performance of the Irish road freight sector to be only 70 per cent of the UK level. Irish goods vehicles have smaller carrying capacities, are emptier for longer, travel fewer kilometres and have lower average laden factors. In addition, the sources of the increase in Ireland’s productivity improvements differ greatly from that observed in France and Germany where the road freight industry has been able to extract greater efficiencies than in Ireland.
Future productivity growth in Ireland’s road freight sector will depend on the industries ability to extract such efficiencies. One area of future research is to determine the extent to which productivity growth is held back by the industry structure. In particular, would greater firm size allow for a better use of ICT and a reduction in empty running, and what role could a co-ordinating body (such as a professional or governmental body) usefully play in facilitating this? A further area of investigation could be the impact of congestion on productivity, for instance through looking at the trends in deliveries per day. The broader influence of infrastructure on productivity could also be examined, for instance by considering issues such as the provision of dedicated freight infrastructure (including the new Dublin Port Tunnel), or the possible impact of any expansion of rail freight on road freight productivity. Finally, the general role of further improvements in the road network and the experience on mainland Europe in this regard are also factors to be considered
Notes
The Road Freight Transport Survey covers Irish registered vehicles with an unladen weight of two tonnes and over. All activity of goods vehicles within the scope of the survey were engaged in the carriage of goods on the public road. Excluded therefore, was activity such as site work off the public road or work of a mainly service nature (e.g. carriage of personnel to or from places of work). The survey also includes international road transport (see Note for definition of internationalisation).
Internationalisation, or international trade within an Irish context, is the carriage of goods by road by Irish registered goods vehicles between two places located in two different countries. International journey’s accounted for per cent of total tonne-km transported in 00.
For this calculation we left out the smallest category of vehicle (000-5000kg) because there is a disproportionately large number of ‘own account’ vehicles registered in this category when compared to the ‘hire or reward’ category. Since many of these vehicles are small jeeps and vans, we felt that many of these vehicles are not representative of the typical road freight vehicle, and thus would make the performance of the ‘own account’ vehicles appear worse that it actually is.
5 Data on tonne-km (output) was taken directly from the Road Freight Transport Survey. Additional unpublished data from the survey was also made available to us and has been incorporated into our calculations. Employment data (input) for 995 was not available from the CSO and is based on Forfás estimates. Data for 99 997 and 998 was available from the CSO but has been unofficially adjusted by CSO. Employment data for 00 is confidential and cannot be referenced publicly by Forfás. We are extremely grateful to Ken Moore and Caitriona O’Brien from the CSO for helping us compile the data used in this chapter
A more detailed outline of Ireland’s comparative performance relative to the UK will be available in a more detailed version of this chapter that is due to be released in 007. 7 The two heaviest weight categories are 0,00 – ,500 kg and over ,500 kg.
8 “Transport and Environment: Facing a Dilemma TERM 005: Indicators Tracking Transport and Environment in the European Union”, European Environment Agency 00. Available online: www.iiiee.lu.
9 The regions defined in the Road Freight Transport Survey are the NUTS regions of Ireland. An example of a NUTS Region is the ‘South West’ region which contains the counties of Cork and Kerry.
0 The Department for Transport in the UK produced a ‘Telematics Guide’ report that provides information on how the road freight industry can use ICT to promote greater efficiency within the industry. This report, in addition to a number of other reports that examine how factors like skills and equipment can also improve efficiency, are available online on the Department for Transport’s ‘Freight Best Practice’ website. Available at: www. freightbestpractice.org.uk
Glanbia installed BT Cellnets ‘Pinpoint Fleet Management System’, which uses TRACKER Networks Communicator technology. The telematics system allows Glanbia to monitor its vehicles around the clock by recording essential data such as vehicle location, mileage and speed, fuel consumption, driver hours and the temperature or goods in transit.
Agriculture = ‘Agriculture products and live animals’, ‘Foodstuff and animal fodder’ and ‘Fertilisers’. Manufacturing = ‘Petroleum products’, ‘Metal products’, ‘Chemicals’ and ‘Machinery and transport equipment’. Building and Construction = ‘Building materials and crude manufacturing’, ‘Ores and metal waste’ and ‘Solid mineral fuels’. Mixed = ‘Mixed loads’.
See Section 8. for an explanation of hire and reward and own account vehicles.
An estimation of the average fleet size in Ireland was calculated by dividing the number of vehicles licensed for hire or reward by the number of licensed operators. Data was sourced from the Department of Transport, Ireland.
5 Department for Transport, UK (00), Road Freight Statistics 2005.
‘Urban Transport Benchmarking’. Available online: www.transportbenchmarks.org. 7 Department of Environment, Heritage and Local Government data on ‘Mechanically
58
references
CSO (99), Road Freight Transport Survey 1995, Central Statistics Office, Cork.
CSO (00), Road Freight Transport Survey 2003, Central Statistics Office, Cork.
Laoide-Kemp, D. and O’Keefe, D. (00), “Traffic Information Needs of the Freight Industry”. Presented to the International Road Haulage Association’s Annual Conference in Rochestown Park Hotel, Cork, Ireland, 7th March 00. Available online: www.arup.ie/publications.htm.
McKinsey (00), “Reaching Higher Productivity Growth in France and Germany: Sector Case – Road Freight”, excerpt drawn from Reaching Higher Productivity Growth in France and Germany,
published by McKinsey Global Institute. Available online: www.mckinsey.com/knowledge/ mgi/.
Moylan, M., Oulton, N. and Vass, J. (997), “Labour Productivity in Transport and Communications: International Comparisons”, NIESR Discussion Paper, No.7, London.
NCC (00), Annual Competitiveness Report 2006, National Competitiveness Council, Forfás, Dublin.