B
EER: BEtter Evaluation as Ranking
Miloˇs Stanojevi´c
ILLC
University of Amsterdam [email protected]
Khalil Sima’an
ILLC
University of Amsterdam [email protected]
Abstract
We present the UvA-ILLC submission of the BEERmetric to WMT 14 metrics task. BEER is a sentence level metric that can incorporate a large number of features combined in a linear model. Novel con-tributions are (1) efficient tuning of a large number of features for maximizing corre-lation withhuman system ranking, and (2) novel features that give smoother sentence level scores.
1 Introduction
The quality of sentence level (also called segment level) evaluation metrics in machine translation is often considered inferior to the quality of corpus (or system) level metrics. Yet, a sentence level metrics has important advantages as it:
1. provides an informative score to individual translations
2. is assumed by MT tuning algorithms (Hop-kins and May, 2011).
3. facilitates easier statistical testing using sign test or t-test (Collins et al., 2005)
We think that the root cause for most of the diffi-culty in creating a good sentence level metric is the sparseness of the features often used. Consider the n-gram counting metrics (BLEU (Papineni et al., 2002)): counts of higher order n-grams are usu-ally rather small, if not zero, when counted at the individual sentence level. Metrics based on such counts are brittle at the sentence level even when they might be good at the corpus level. Ideally we should have features of varying granularity that we can optimize on the actual evaluation task: relative ranking of system outputs.
Therefore, in this paper we explore two kinds of less sparse features:
Character n-grams are features at the sub-word level that provide evidence for translation ad-equacy - for example whether the stem is cor-rectly translated,
Abstract ordering patterns found in tree factor-izations of permutations into Permutation Trees (PETs) (Zhang and Gildea, 2007), in-cluding non-lexical alignment patterns. The BEERmetric combines features of both kinds (presented in Section 2).
With the growing number of adequacy and or-dering features we need a model that facilitates ef-ficient training. We would like to train for opti-mal Kendallτ correlation with rankings by human evaluators. The models in the literature tackle this problem by
1. training for another similar objective – e.g., tuning for absolute adequacy and fluency scores instead on rankings, or
2. training for rankings directly but with meta-heuristic approaches like hill-climbing, or 3. training for pairwise rankings using
learning-to-rank techniques
Approach (1) has two disadvantages. One is the inconsistency between the training and the testing objectives. The other, is that absolute rankings are not reliable enough because humans are better at giving relative than absolute judgments (see WMT manual evaluations (Callison-Burch et al., 2007)). Approach (2) does not allow integrating a large number of features which makes it less attractive.
Approach (3) allows integration of a large num-ber of features whose weights could be determined in an elegant machine learning framework. The output of learning in this approach can be either a function that ranks all hypotheses directly (global ranking model) or a function that assigns a score
to each hypothesis individually which can be used for ranking (local ranking model) (Li, 2011). Lo-cal ranking models are preferable because they provide absolute distance between hypotheses like most existing evaluation metrics.
In this paper we follow the learning-to-rank ap-proach which produces a local ranking model in a similar way to PRO MT systems tuning (Hopkins and May, 2011).
2 Model
Our model is a fairly simple linear interpolation of feature functions, which is easy to train and simple to interpret. The model determines the similarity
of the hypothesish to the reference translation r by assigning a weightwito each featureφi(h, r).
The linear scoring function is given by:
score(h, r) =X
i
wi×φi(h, r) =w~ ·φ~
2.1 Adequacy features
The features used are precision P, recall R and F1-scoreF for different counts:
Pfunction,Rfunction,Ffunction on matched
func-tion words
Pcontent,Rcontent,Fcontent on matched content
words (all non-function words)
Pall,Rall,Fall on matched words of any type
Pchar n−gram,Rchar n−gram,Fchar n−gram
matching of the character n-grams
By differentiating function and non-function words we might have a better estimate of which words are more important and which are less. The last, but as we will see later the most important, adequacy feature is matching character n-grams, originally proposed in (Yang et al., 2013). This can reward some translations even if they did not get the morphology completely right. Many met-rics solve this problem by using stemmers, but us-ing features based on character n-grams is more robust since it does not depend on the quality of the stemmer. For character level n-grams we can afford higher-order n-grams with less risk of sparse counts as on word n-grams. In our exper-iments we used character n-grams for size up to 6 which makes the total number of all adequacy features 27.
2.2 Ordering features
To evaluate word order we follow (Isozaki et al., 2010; Birch and Osborne, 2010) in representing reordering as a permutation and then measuring the distance to the ideal monotone permutation. Here we take one feature from previous work – Kendall τ distance from the monotone permuta-tion. This metrics on the permutation level has been shown to have high correlation with human judgment on language pairs with very different word order.
Additionally, we add novel features with an even less sparse view of word order by exploiting hierarchical structure that exists in permutations (Zhang and Gildea, 2007). The trees that represent this structure are called PETs (PErmutation Trees – see the next subsection). Metrics defined over PETs usually have a better estimate of long dis-tance reorderings (Stanojevi´c and Sima’an, 2013). Here we use simple versions of these metrics:
∆count the ratio between the number of different
permutation trees (PETs) (Zhang and Gildea, 2007) that could be built for the given per-mutation over the number of trees that could be built if permutation was completely mono-tone (there is a perfect word order).
∆[ ] ratio of the number of monotone nodes in a PET to the maximum possible number of nodes – the lenght of the sentencen.
∆<> ratio of the number of inverted nodes ton
∆=4 ratio of the number of nodes with branching factor 4 ton
∆>4 ratio of the number of nodes with branching factor bigger than 4 ton
2.3 Why features based on PETs?
PETs are recursive factorizations of permutations into their minimal units. We refer the reader to (Zhang and Gildea, 2007) for formal treatment of PETs and efficient algorithms for their construc-tion. Here we present them informally to exploit them for presenting novel ordering metrics.
h2,4,1,3i
2 h2,1i h1,2i
5 6 4
1 3
(a) Complex PET
h1,2i h2,1i
2 1
h2,1i
4 3
(b) PET with inversions
h2,1i h2,1i h2,1i 4 3
2 1
(c) Fully inverted PET Figure 1: Examples of PETs
node and one monotone. The nodes are decorated by operators that stand for a permutation of the direct children of the node.
PETs have two important properties that make them attractive for observing ordering: firstly, the PET operators show the minimal units of ordering that constitute the permutation itself, and secondly the higher level operators capture hidden patterns of ordering that cannot be observed without fac-torization. Statistics over patterns of ordering us-ing PETs are non-lexical and hence far less sparse than word or character n-gram statistics.
In PETs, the minimal operators on the node stand for ordering that cannot be broken down any further. The binary monotone operator is the sim-plest, binary inverted is the second in line, fol-lowed by operators of length four likeh2,4,1,3i (Wu, 1997), and then operators longer than four. The larger the branching factor under a PET node (the length of the operator on that node) the more complex the ordering. Hence, we devise possi-ble branching feature functions over the operator length for the nodes in PETs:
• factor 2 - with two features: ∆[ ] and∆<>
(there are no nodes with factor 3 (Wu, 1997)) • factor 4 - feature∆=4
• factor bigger than 4 - feature∆>4
All of the mentioned PETs node features, except
∆[ ]and∆count, signify the wrong word order but
of different magnitude. Ideally all nodes in a PET would be binary monotone, but when that is not the case we are able to quantify how far we are from that ideal binary monotone PET.
In contrast with word n-grams used in other metrics, counts over PET operators are far less sparse on the sentence level and could be more reliable. Consider permutations 2143 and 4321
and their corresponding PETs in Figure 1b and 1c. None of them has any exact n-gram matched
(we ignore unigrams now). But, it is clear that
2143is somewhat better since it has at least some words in more or less the right order. These “ab-stract n-grams” pertaining to correct ordering of full phrases could be counted using ∆[ ] which would recognize that on top of the PET in 1b there is the monotone node unlike the PET in 1c which has no monotone nodes at all.
3 Tuning for human judgment
The task of correlation with human judgment on the sentence level is usually posed in the following way (Mach´aˇcek and Bojar, 2013):
• Translate all source sentences using the avail-able machine translation systems
• Let human evaluators rank them by quality compared to the reference translation
• Each evaluation metric should do the same task of ranking the hypothesis translations • The metric with higher Kendallτ correlation
with human judgment is considered better Let us take any pair of hypotheses that have the same referencer where one is better (hgood) than
the other one (hbad) as judged by human evaluator.
In order for our metric to give the same ranking as human judges do, it needs to give the higher score to the hgood hypothesis. Given that our model is
linear we can derive:
score(hgood, r)> score(hbad, r)⇔
~
w·φ~good >w~ ·φ~bad⇔ ~
w·φ~good−w~ ·φ~bad>0⇔ ~
w·(φ~good−φ~bad)>0
~
w·(φ~bad−φ~good)<0
~
φgood −φ~bad and the negative training instance would have feature valuesφ~bad−φ~good. This trick was used in PRO (Hopkins and May, 2011) but for the different task:
• tuning the model of the SMT system • objective function was an evaluation metric Given this formulation of the training instances we can train the classifier using pairs of ses. Note that even though it uses pairs of hypothe-ses for training in the evaluation time it uhypothe-ses only one hypothesis – it does not require the pair of hy-potheses to compare them. The score of the classi-fier is interpreted as confidence that the hypothesis is a good translation. This differs from the major-ity of earlier work which we explain in Section 6.
4 Experiments on WMT12 data
We conducted experiments for the metric which in total has 33 features (27 for adequacy and 6 for word order). Some of the features in the metric depend on external sources of informa-tion. For function words we use listings that are created for many languages and are distributed with METEOR toolkit (Denkowski and Lavie, 2011). The permutations are extracted using ME-TEOR aligner which does fuzzy matching using resources such as WordNet, paraphrase tables and stemmers. METEOR is not used for any scoring, but only for aligning hypothesis and reference.
For training we used the data from WMT13 hu-man evaluation of the systems (Mach´aˇcek and Bo-jar, 2013). Before evaluation, all data was low-ercased and tokenized. After preprocessing, we extract training examples for our binary classifier. The number of non-tied human judgments per lan-guage pair are shown in Table 1. Each human judgment produces two training instances : one positive and one negative. For learning we use regression implementation in the Vowpal Wabbit toolkit1.
Tuned metric is tested on the human evaluated data from WMT12 (Callison-Burch et al., 2012) for correlation with the human judgment. As base-line we used one of the best ranked metrics on the sentence level evaluations from previous WMT tasks – METEOR (Denkowski and Lavie, 2011). The results are presented in the Table 2. The pre-sented results are computed using definition of
1https://github.com/JohnLangford/ vowpal_wabbit
language pair #comparisons
cs-en 85469
de-en 128668
es-en 67832
fr-en 80741
ru-en 151422
en-cs 102842
en-de 77286
en-es 60464
en-fr 100783
[image:4.595.356.476.62.174.2]en-ru 87323
Table 1: Number of human judgments in WMT13
language pair
BEER
with paraphrases
BEER
without
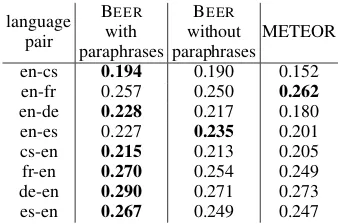
paraphrasesMETEOR en-cs 0.194 0.190 0.152 en-fr 0.257 0.250 0.262 en-de 0.228 0.217 0.180 en-es 0.227 0.235 0.201 cs-en 0.215 0.213 0.205 fr-en 0.270 0.254 0.249 de-en 0.290 0.271 0.273 es-en 0.267 0.249 0.247 Table 2: Kendallτ correleation on WMT12 data
Kendall τ from the WMT12 (Callison-Burch et al., 2012) so the scores could be compared with other metrics on the same dataset that were re-ported in the proceedings of that year (Callison-Burch et al., 2012).
The results show that BEER with and without paraphrase support outperforms METEOR (and almost all other metrics on WMT12 metrics task) on the majority of language pairs. Paraphrase sup-port matters mostly when the target language is English, but even in language pairs where it does not help significantly it can be useful.
5 WMT14 evaluation task results
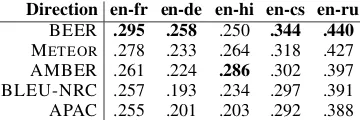
In Table 4 and Table 3 you can see the results of top 5 ranked metrics on the segment level evalua-tion task of WMT14. In 5 out of 10 language pairs BEER was ranked the first, on 4 the second best and on one third best metric. The cases where it failed to win the first place are:
• against DISCOTK-PARTY-TUNEDon * - En-glish except Hindi-EnEn-glish. DISCO TK-PARTY-TUNED participated only in evalua-tion of English which suggests that it uses some language specific components which is not the case with the current version of BEER
[image:4.595.330.499.207.319.2]Direction en-fr en-de en-hi en-cs en-ru BEER .295 .258 .250 .344 .440
METEOR .278 .233 .264 .318 .427
[image:5.595.91.271.62.122.2]AMBER .261 .224 .286 .302 .397 BLEU-NRC .257 .193 .234 .297 .391 APAC .255 .201 .203 .292 .388
Table 3: Kendallτcorrelations on the WMT14 hu-man judgements when translating out of English.
Direction fr-en de-en hi-en cs-en ru-en
DISCOTK-PARTY-TUNED .433 .381 .434 .328 .364
BEER .417 .337 .438 .284 .337
REDCOMBSENT .406 .338 .417 .284 .343
REDCOMBSYSSENT .408 .338 .416 .282 .343
METEOR .406 .334 .420 .282 .337
Table 4: Kendall τ correlations on the WMT14 human judgements when translating into English.
did not have the data to tune our metric for Hindi. Even by treating Hindi as English we manage to get high in the rankings for this language.
From metrics that participated in all language pairs on the sentence level on average BEER has the best correlation with the human judgment.
6 Related work
The main contribution of our metric is a linear combination of features with far less sparse statis-tics than earlier work. In particular, we employ novel ordering features over PETs, a range of char-acter n-gram features for adequancy, and direct tuning for human ranking.
There are in the literature three main approaches for tuning the machine translation metrics.
Approach 1 SPEDE (Wang and Manning, 2012), metric of (Specia and Gim´enez, 2010), ROSE-reg (Song and Cohn, 2011), ABS met-ric of (Pad´o et al., 2009) and many oth-ers train their regression models on the data that has absolute scores for adequacy, fluency or post-editing and then test on the ranking problem. This is sometimes called pointwise approach to learning-to-rank. In contrast our metric is trained for ranking and tested on ranking.
Approach 2 METEOR is tuned for the ranking and tested on the ranking like our metric but the tuning method is different. METEOR has a non-linear model which is hard to tune with
gradient based methods so instead they tune their parameters by hill-climbing (Lavie and Agarwal, 2008). This not only reduces the number of features that could be used but also restricts the fine tuning of the existing small number of parameters.
Approach 3 Some methods, like ours, allow training of a large number of parameters for ranking. Global ranking models that di-rectly rank hypotheses are used in ROSE-rank (Song and Cohn, 2011) and PAIR met-ric of (Pad´o et al., 2009). Our work is more similar to the training method for local rank-ing models that give score directly (as it is usually expected from an evaluation metric) which was originally proposed in (Ye et al., 2007) and later applied in (Duh, 2008) and (Yang et al., 2013).
7 Conclusion and future plans
We have shown the advantages of combining many simple features in a tunable linear model of MT evaluation metric. Unlike majority of the previous work we create a framework for training large number of features on human rankings and at the same time as a result of tuning produce a score based metric which does not require two (or more) hypotheses for comparison. The features that we used are selected for reducing sparseness on the sentence level. Together the smooth features and the learning algorithm produce the metric that has a very high correlation with human judgment.
For future research we plan to investigate some more linguistically inspired features and also ex-plore how this metric could be tuned for better tun-ing of statistical machine translation systems.
Acknowledgments
This work is supported by STW grant nr. 12271 and NWO VICI grant nr. 277-89-002.
References
Alexandra Birch and Miles Osborne. 2010. LRscore for Evaluating Lexical and Reordering Quality in MT. InProceedings of the Joint Fifth Workshop on Statistical Machine Translation and MetricsMATR, pages 327–332, Uppsala, Sweden, July. Association for Computational Linguistics.
[image:5.595.74.303.178.241.2](Meta-) Evaluation of Machine Translation. In
Proceedings of the Second Workshop on Statistical Machine Translation, StatMT ’07, pages 136–158, Stroudsburg, PA, USA. Association for Computa-tional Linguistics.
Chris Callison-Burch, Philipp Koehn, Christof Monz, Matt Post, Radu Soricut, and Lucia Specia. 2012. Findings of the 2012 Workshop on Statistical Ma-chine Translation. In Proceedings of the Seventh Workshop on Statistical Machine Translation, pages 10–51, Montr´eal, Canada, June. Association for Computational Linguistics.
Michael Collins, Philipp Koehn, and Ivona Kuˇcerov´a. 2005. Clause Restructuring for Statistical Machine Translation. In Proceedings of the 43rd Annual Meeting on Association for Computational Linguis-tics, ACL ’05, pages 531–540, Stroudsburg, PA, USA. Association for Computational Linguistics.
Michael Denkowski and Alon Lavie. 2011. Meteor 1.3: Automatic Metric for Reliable Optimization and Evaluation of Machine Translation Systems. In
Proceedings of the EMNLP 2011 Workshop on Sta-tistical Machine Translation.
Kevin Duh. 2008. Ranking vs. Regression in Ma-chine Translation Evaluation. InProceedings of the Third Workshop on Statistical Machine Translation, StatMT ’08, pages 191–194, Stroudsburg, PA, USA. Association for Computational Linguistics.
Mark Hopkins and Jonathan May. 2011. Tuning as Ranking. InProceedings of the 2011 Conference on Empirical Methods in Natural Language Process-ing, pages 1352–1362, Edinburgh, Scotland, UK., July. Association for Computational Linguistics.
Hideki Isozaki, Tsutomu Hirao, Kevin Duh, Katsuhito Sudoh, and Hajime Tsukada. 2010. Automatic Evaluation of Translation Quality for Distant Lan-guage Pairs. InProceedings of the 2010 Conference on Empirical Methods in Natural Language Pro-cessing, EMNLP ’10, pages 944–952, Stroudsburg, PA, USA. Association for Computational Linguis-tics.
Alon Lavie and Abhaya Agarwal. 2008. METEOR: An Automatic Metric for MT Evaluation with High Levels of Correlation with Human Judgments. In
Proceedings of the ACL 2008 Workshop on Statisti-cal Machine Translation.
Hang Li. 2011. Learning to Rank for Information Re-trieval and Natural Language Processing. Synthesis Lectures on Human Language Technologies. Mor-gan & Claypool Publishers.
Matouˇs Mach´aˇcek and Ondˇrej Bojar. 2013. Results of the WMT13 Metrics Shared Task. In Proceed-ings of the Eighth Workshop on Statistical Machine Translation, pages 45–51, Sofia, Bulgaria, August. Association for Computational Linguistics.
Sebastian Pad´o, Michel Galley, Dan Jurafsky, and Christopher D. Manning. 2009. Textual Entail-ment Features for Machine Translation Evaluation. In Proceedings of the Fourth Workshop on Statis-tical Machine Translation, StatMT ’09, pages 37– 41, Stroudsburg, PA, USA. Association for Compu-tational Linguistics.
Kishore Papineni, Salim Roukos, Todd Ward, and Wei-Jing Zhu. 2002. BLEU: A Method for Automatic Evaluation of Machine Translation. InProceedings of the 40th Annual Meeting on Association for Com-putational Linguistics, ACL ’02, pages 311–318, Stroudsburg, PA, USA. Association for Computa-tional Linguistics.
Xingyi Song and Trevor Cohn. 2011. Regression and Ranking based Optimisation for Sentence Level MT Evaluation. In Proceedings of the Sixth Workshop on Statistical Machine Translation, pages 123–129, Edinburgh, Scotland, July. Association for Compu-tational Linguistics.
Lucia Specia and Jes´us Gim´enez. 2010. Combining Confidence Estimation and Reference-based Metrics for Segment-level MT Evaluation. InNinth Confer-ence of the Association for Machine Translation in the Americas, AMTA-2010, Denver, Colorado. Miloˇs Stanojevi´c and Khalil Sima’an. 2013.
Eval-uating Long Range Reordering with Permutation-Forests. In ILLC Prepublication Series, PP-2013-14. University of Amsterdam.
Mengqiu Wang and Christopher D. Manning. 2012. SPEDE: Probabilistic Edit Distance Metrics for MT Evaluation. In Proceedings of the Seventh Work-shop on Statistical Machine Translation, WMT ’12, pages 76–83, Stroudsburg, PA, USA. Association for Computational Linguistics.
Dekai Wu. 1997. Stochastic inversion transduction grammars and bilingual parsing of parallel corpora.
Computational linguistics, 23(3):377–403.
Muyun Yang, Junguo Zhu, Sheng Li, and Tiejun Zhao. 2013. Fusion of Word and Letter Based Metrics for Automatic MT Evaluation. In Proceedings of the Twenty-Third International Joint Conference on Artificial Intelligence, IJCAI’13, pages 2204–2210. AAAI Press.
Yang Ye, Ming Zhou, and Chin-Yew Lin. 2007. Sen-tence Level Machine Translation Evaluation As a Ranking Problem: One Step Aside from BLEU. In
Proceedings of the Second Workshop on Statistical Machine Translation, StatMT ’07, pages 240–247, Stroudsburg, PA, USA. Association for Computa-tional Linguistics.