Munich Personal RePEc Archive
The Determinants of Inflation in Egypt:
An Empirical Study (1991-2012)
El Baz, Osama
The Egyptian Center for Economic Studies
12 May 2014
The Determinants of Inflation in Egypt: An Empirical Study
(1991-2012)
Osama El-Baze
Research Analyst, The Egyptian Center for Economic Studies
[email protected], Mob. 01208375315
Abstract
This paper investigated the determinants of inflation in the Egyptian economy. Using annual data, covering the period (1991-2012), a Vector Auto Regression Model (VAR) was estimated. The results of the empirical model confirmed that inflation rate responds positively in the first period following shocksto itself,domestic liquidity growth rate,output gap, exchange rate depreciation, and world food prices.Also, expectations seemed to play an important role as inflation rate responds positively to a shock in itself in the first year following the shock, which reinforces the idea that inflationary expectations will generate more inflation.In the short runinflation is explained mostly by its own fluctuationsfollowed by output gap, domestic liquidity growth rate, and nominal depreciation of the Egyptian pound against the US dollar, while in a 5-year horizon about 56% ofinflation dynamics can be attributed to factors other than inflation expectations " itself".
1.
Introduction:
Inflation as a phenomenon has witnessed remarkable changes starting from mid-eighties of the last century. Inflation rates have become less persistent, less responsive to supply side shocks. The importance of demand pull inflation as a determinant of inflation has decreased due to efficient monetary policies conducted by central banks all over the world, which aim at anchoring inflation expectations at lower levels. Inflation expectations appeared to be more influential on inflation rather than output gap, these changes constitute in the new economic literature what is called "Inflation Dynamics" (Ali. 2011).
Low inflation is crucial for macroeconomic stability as evidenced by countryexperiences, since high inflation in general hurt macroeconomic stability mainly through lower levels of domestic savings by deeply negative real interest rates, lower capital accumulation due to increased uncertainty, and also real appreciation of the exchange rate due to wide inflation differentials against the country's major trading partners can have a negative impact on export competitiveness.
The recent acceleration of inflation has triggered renewed interest in exploring the main factors that are driving prices in Egypt. It is known that price stability is crucial for macroeconomic stability in order to ensure social stability, as January, 25th revolution was mainly fueled by inferior social and economic status of the poor, who felt being marginalized and unable to participate in the growth process. That's why inclusive growth has become an important objective. Over the past three years several strikes have been put in place as the Egyptian workers called for wage adjustment, that’s why price stability is important as the persistency of high inflation rates can erode the nominal adjustments in wages.
In fact, according to law no. 88 of 2003 of the Central Bank, Banking Sector and Monetary System in Egypt, the CBE is responsible for the formulation and implementation of the monetary policy, with price stability being the primary objective. The inflation rate in Egypt recorded 7.11 percent in 2012, which could be justified by the tendency of the CBE to tighten monetary policy after the January 25th revolution in order to strengthen the financial system and to preserve overall confidence in the Egyptian economy (Hosny, 2014).
In this context, this paper focuses on investigating inflation dynamics in Egypt during the period (1991-2012) in order to identify the main determinants of inflation in the Egyptian economy, and the extent to which “Inflation Dynamics” in Egypt is different from or similar to those witnessed by empirical studies on other economies.
The paper consists of six sections as follows: First: Introduction. Second: Literature Review and theoretical background. Third: Recent developments in monetary policy in Egypt. Fourth: Econometric Methodology and expected results. Fifths: Empirical analysis and interpretation of results. Sixths: Conclusion and policy implications.
2.
Theoretical& Literature Review
In the literature, there are three main concepts that are commonly known to explain inflation dynamics and price setting, which are the traditional Phillips curve, the New Keynesian Phillips Curve (NKPC), and the hybrid NKPC(Moriyama. 2011).
The traditional Phillips curve relates inflation to some cyclical indicator and lagged
values of inflation. It implies that inflation is a backward-looking phenomenon, produced by adaptive expectations or by price-setting behavior based on a backward-looking rule of thumb. While the traditional Phillips curve is subject to considerable theoretical criticism, the empirical evidence indicates that it describes the post-war inflation in the United States and Europe reasonably well. The traditional Phillips curve can be expressed as follows:
𝛑
t=
β
𝛑
t-1+
γ
Y
t*
required.Alevel of real output below potential “negative output gap”, has the opposite implication (Claus. 2000).
The New Keynesian Phillips curve relates inflation to the output gap and a “cost -push” effect influenced by expected inflation. Inflation under this formulation is a forward-looking phenomenon:
𝛑
t=
β
E
t𝛑
t-1+
γ
Y
t* +
ε
t =γ
Y
t*+
γ∑ β
iE
tY*
t+i+
ε
tWhere: y* is the output gap, εtis a white noise error term, interpreted as
supplyshocks, andEindicates the (rational) expectation operator. Equation (1) suggests that inflation at period t only depends on the current output gap and the (rationally) expected output gap in the future(t+i).
One of the most important policy implications derived from the New Keynesian Phillips Curve (NKPC) is that the central bank can achieve disinflation without elevating unemployment rate beyond the natural rate, or very low sacrifice ratio. This is a direct result of the forward looking property of the NKPC. If the central bank is committed to achieve a zero output gap target after period t and its commitment is highly credible to the private sector, inflation in period t+1 would decline to zero regardless of the actual level of inflation at period t.
The NKPC was criticized as it does not explain persistency of inflation (Rabanal and Rubio-Ramirez2003). In order to overcome this drawback,inflation in the hybrid NKPCdepends on the weighted sum of its lag and the rationally expected future value:
𝛑
t= (1-
θ
)
𝛑
t-1+
θ
E
t𝛑
t+1+ γ Y*
t+
ε
tUnder this formulation, inflation is no longer independent from its past value in the hybrid NKPC. The solution of the hybrid NKPC is rewritten as follows:
π
t=
𝟏−𝜽𝜽
π
t-1+
𝜸𝜽
∑
∞𝒊=𝟎𝑬𝒕
Y*
t+i+
ε
tIf the central bank is targeting a zero inflation at period t+1, the central bank must keep output below its potential for a while to reduce the inflationinherited from period t . The required decline in the present value of the output gap is:
∑∞𝒊=𝟎𝑬𝒕 Y* t+i= −
( 𝟏−𝜽) 𝜸 πt
When inflation has inertia, in general, the central bank cannot achieve disinflation without elevating unemployment rate above its natural level, suggesting that the central bank faces a trade-off between disinflation and increasing unemployment. Therefore, estimating the degree of inflation inertia is crucial for the central bank to be able to implement anappropriate disinflation policy.
Moriyama(2011)estimated the degree of inflation inertia in Egypt and its determinants using the cross country data consisting of over 100 countries. Inflation inertia in Egypt was found to be relatively higherthan that in other countries and high inflation persistency is attributed tothe lack of countercyclical macroeconomic policy and high fiscal deficit.Almonsour (2010)investigated the short run dynamics of that short run dynamics in inflation in Yemen using a structural vector auto-regression model (SVAR) and concluded that the short run dynamics in inflation in Yemen could be explained mostly by its own fluctuations, followed by international prices and money supply.
There are other studies which argued that prudent monetary policies are not enough to guarantee price stability, if not supported by a reasonably strong fiscal position.
El-Sakka and Ghali (2005) ; (Fanizza and Soderling 2006) and (Helmy. 2008)found that not only did persistent budget deficit and sources of its financing produce inflationary pressures through their impact on monetary aggregates and public expectations, but also high inflation then had a feedback effect pushing up budget deficit.Unaddressed fiscal issues are a key reason why Egypt’s exchange rate peg did not hold.These empirical studies did not deny the importance of the monetary policy, but suggested that fiscalpolicy and public debt dynamics merit a particularly prominent place in the context of ensuring price stability.
Helmy (2008) concluded thatstrengthening the fiscal position by reducing the budget deficit, net government debt and credit to the government, is crucial forsupporting monetary policy in curbing inflationary pressures in Egypt. In order to keep inflation at low levels, the government needs to spend in such a way that it also increases economic growth. Introducing greater exchange rate flexibility would make monetary policy an effective tool for liquidity management.
3.
Recent developments in monetary policy in Egypt:
•
The first period (1980s): The dominance of the government
on economicactivities:
The eighties of the last century were characterized by the government control oneconomic activity and the lack of efficiency in the distribution of economic resources as a result of the suspension of market mechanisms. These economic circumstances had led to many internal and external imbalances at the economic level and resulted in a continuous increase in the aggregate demand, which was not compatible with the levels of the aggregate supply. The above mentioned factors had increased the inflation rates significantly to record the highest levels during the period (1980-2009) as inflation rates had increased to reach 31% in 1987.
solely responsible forexplaining about 82% of the changes in inflation in that period(Ali. 2011).
•
The second period 1990s: The Economic reform and
structural AdjustmentProgram:
On the contrary, inflation rates had witnessed their lowest levels during the second period in 1990s as a result of many economic reforms that have been adopted in line with the Economic Reform and Structural Adjustment Program (ERSAP) which was adopted in cooperation with the International Monetary Fund and the World Bank to combat aggregate demand and reduce inflation. This program had successfully reduced inflation rates to reach their lowest level in 1999 when it reached 1%.
The monetary policies which have been adopted in 1990s were mainly aim at achieving the highest levels of price stability and controlling the increases in domestic liquidityusing indirect monetary instruments rather than direct monetary instruments. The changesin inflation dynamics in this period were mainly driven by the changes in the realexchange rate, which was capable of explaining around 70% of the changes in inflation rates during this period.
During 1990 through 2005, with the exception of 1996/1997, the CBE has focused on achieving two main objectives, namely, price stability and exchange rate stability. The monetary policy, however, exhibited inconsistencies, particularly during 1992/1993-1996/1997. In 1992/1993, besides price and exchange rate stability, the CBE planned to achieve different conflicting objectives. While the CBE aimed at controlling the monetary expansion by adopting a contractionary monetary policy, it also called for a reduction of the interest rate on the Egyptian pound in order to encourage investment and promote economic growth by implementing an expansionary monetary policy (Moursi. 2007).
Between 1996 and 2005, the CBE’s operational target was excess reserves of banks, and given the strong link between monetary aggregates and inflation, growth in M2 was the intermediate target. The CBE used various quantitative and price instruments at different points in time to achieve its multiple objectives, which led to a lack of consistency in monetary policy objectives (Almashaat. 2008).
Despite the liberalization of the pound in 2003, the CBE has continued to maintainexchange rate stability as one of its key objectives during the following years, 2004 and 2005.It is more or less difficult now to construe how the CBE plans to bring about exchange ratestability without frequently resorting to direct control.
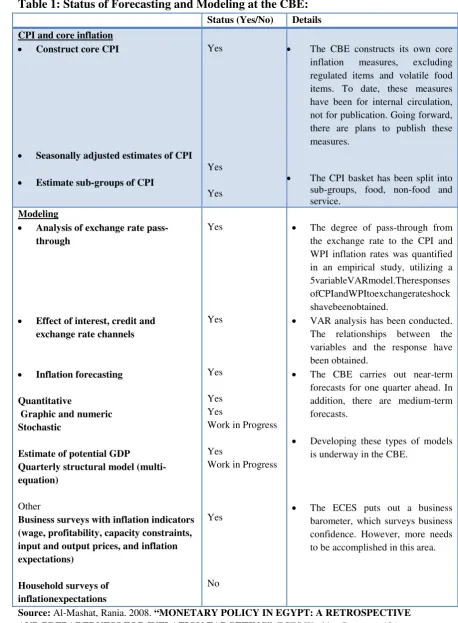
Table 1: Status of Forecasting and Modeling at the CBE:
Status (Yes/No) Details
CPI and core inflation
• Construct core CPI
• Seasonally adjusted estimates of CPI
• Estimate sub-groups of CPI
Yes
Yes
Yes
• The CBE constructs its own core inflation measures, excluding regulated items and volatile food items. To date, these measures have been for internal circulation, not for publication. Going forward, there are plans to publish these measures.
• The CPI basket has been split into sub-groups, food, non-food and service.
Modeling
• Analysis of exchange rate pass-through
• Effect of interest, credit and exchange rate channels
• Inflation forecasting
Quantitative
Graphic and numeric Stochastic
Estimate of potential GDP
Quarterly structural model (multi-equation)
Other
Business surveys with inflation indicators (wage, profitability, capacity constraints, input and output prices, and inflation expectations)
Household surveys of inflationexpectations Yes Yes Yes Yes Yes
Work in Progress
Yes
Work in Progress
Yes
No
• The degree of pass-through from the exchange rate to the CPI and WPI inflation rates was quantified in an empirical study, utilizing a 5variableVARmodel.Theresponses ofCPIandWPItoexchangerateshock shavebeenobtained.
• VAR analysis has been conducted. The relationships between the variables and the response have been obtained.
• The CBE carries out near-term forecasts for one quarter ahead. In addition, there are medium-term forecasts.
• Developing these types of models is underway in the CBE.
• The ECES puts out a business barometer, which surveys business confidence. However, more needs to be accomplished in this area.
Source: Al-Mashat, Rania. 2008. “MONETARY POLICY IN EGYPT: A RETROSPECTIVE
Recently, empirical studies argued that central banks are usually more forward-looking under inflation targeting regimes as compared to other monetary policy frameworks. (Hosny, 2014)used a two-step Heckman procedure to test the behavior of the monetary policy in Egypt, results confirmed that monetary policy in Egypt became more forward-looking after 2005M7, currency depreciation exerted an upward pressure on the CBE’s short-term interest rate over this period, and the Egyptian revolution of January 25th, 2011 has forced the CBE to tighten monetary policy in order to strengthen the financial system and to preserve confidence in the Egyptian economy. This indicates a healthy transition of the CBE toward an effective inflation targeting regime.
The Monetary Policy Committee (MPC), in its meeting held on December 5, 2013 decided to cut the overnight deposit rate, overnight lending rate, and the rate of the CBE's main operations by 50 basis points to 8.25 percent, 9.25 percent,and 8.75 percent, respectively. The discount rate was also cut by 50 basis points to 8.75 percent as they thought that the downside risks to domestic GDP combined with the persistently negative output gap since 2011 will limit upside risks to the inflation outlook going forward.
4.
Econometric Analysis:
•
Econometric Methodology:
Based upon the traditional Phillips curve which relates inflation to both the lagged values of inflation and output gap, it can be represented by the following equation:
𝛑t = β𝛑t-1 + γYt*
In this paper a Vector Auto-Regression (VAR)model will be used to investigate the main determinants of inflation and to analyze the short run dynamic relationships between inflation and its determinants.
•
Variables:
The empirical model uses annual data, covering the period (1991-2012), to identify the main determinants of inflation in the Egyptian economy. The model includes the following variables:
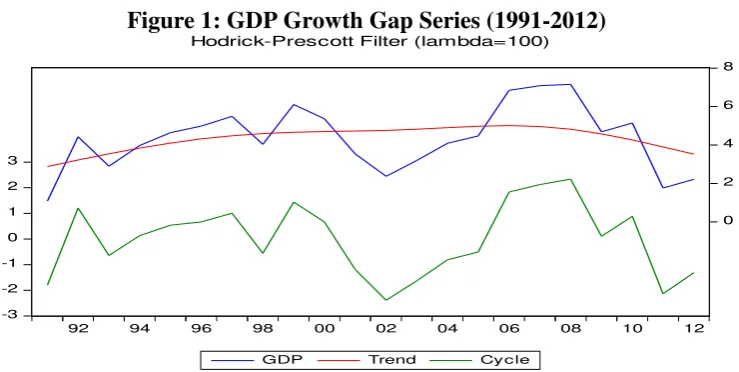
• GDPGAP: the GDP growth gap, calculated using the Hedrick-Prescott filter.
• M2_RTAE: money supply “domestic liquidity” growth rate, to represent the monetary stance.
• EXDEP:the rate of depreciation of the Egyptian pound against the US dollar.
• GDPD:is the GDP deflator, which represents domestic inflation rateor the rate of price change in the economy as a whole.
• WINFFOOD: world food prices are used to measure the effect of fluctuations in world food prices on domestic inflation.The logarithm to the base (e) was taken (Ln) and then the first difference.
Variables are ordered as follows: (WINFFOOD, GDPGAP, EXDEP, M2_RATE,GDPD). The ordering of variables can be justified as follows:
• Foreign inflation is exogenous to the system and thus affects alldisturbances to GDP growth gap, nominal appreciation/depreciation, money supply growth, and inflation.
• Demand shocks affect disturbances of the variables other than foreign inflation.
• Money supply will be affected by shocks to GDP growth and nominal
exchange rate as the central bank usually respond to fluctuation in output gap and exchange rates using monetary policy rules, and in this case the policy variable is M2.
• Domestic inflation will be affected by changes in money supply growth rate.
•
Expected Results:
As for the expected results of the empirical model, First: inflation rate is expected to respond positively to an output "GDP growth" gapshock; as a positive output gap increases inflationary pressures in the economy as Sustained periods of above trend growth are expected to be associated with above-average inflation pressures, while sustained periods of below-trend growth will be expected to be associated with unusual disinflation pressures (Claus. 2000) and (Cituand Twaddle. 2003). Second: inflation rate is expected to respond positively to a sock in money supply growth rate.
Third: inflation rate is expected to positively respond to a shock in itself, as inflationary expectations in developing countries are not anchored at lower levels mainly due to lower levels of credibility of economic policies. Fourth: inflation rate is expected to positively respond to the depreciation of the domestic currency, mainly due to the exchange rate pass-through effect. Fifth: inflation rate is expected to positively respond to a shock in world food prices.
5.
Empirical Analysis:
•
Estimating the output gap:
Figure 1: GDP Growth Gap Series (1991-2012)
[image:10.595.124.466.328.462.2]Source: Researcher’s calculations.
Figure 2: The relationship between output gap and Inflation (1980-2012)
Source: Researcher’s calculations.
• Testing for stationarity: the stationarity of all variables was tested using the Augmented Dickey-Fuller (ADF) unit root test. All variables were found to be integrated of order one, with the exception of WINFFOODwhich is integrated of order two. results can be summarized in the following table:
Table 2: ADF unit root test
Variable Order of Integration t-Statistic Significance Level
WINFFOOD I(2) -5.976 0.01, 0.05, 0.10
GDPGAP I(1) -6.208 0.01, 0.05, 0.10
M2_RATE I(1) -4.881 0.01, 0.05, 0.10
EXDEP I(1) -5.019 0.01, 0.05, 0.10
GDPD I(1) -6.941 0.01, 0.05, 0.10
Source: Researcher’s calculations.
-3 -2 -1 0 1 2 3
0 2 4 6 8
92 94 96 98 00 02 04 06 08 10 12
GDP Trend Cycle
Hodrick-Prescott Filter (lambda=100)
0 5 10 15 20 25
• For the estimation of the empirical VAR model, only 1 lagwas included based on the Akaike information criterion.
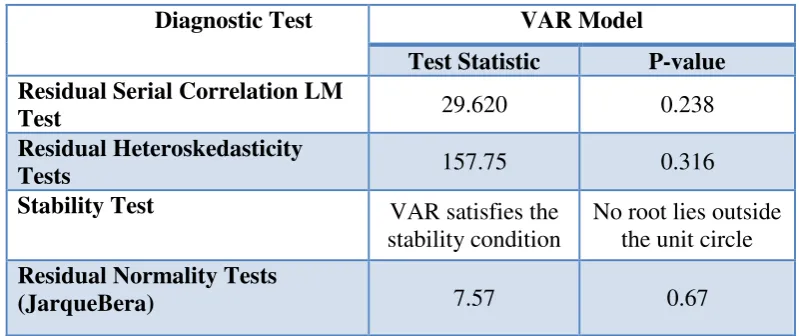
[image:11.595.97.497.206.374.2]• Diagnostic tests were applied to ensure the validity of the results. Autocorrelation, hetroscedasticity, normality, and stability tests were conducted. The results of these tests confirm that the model does not suffer any autocorrelation, hetroscedasticity, normality or stability problems. The results of these tests can be summarized in the following table:
Table 3: Diagnostic tests for the VAR model
Diagnostic Test VAR Model
Test Statistic P-value
Residual Serial Correlation LM
Test 29.620 0.238
Residual Heteroskedasticity
Tests 157.75 0.316
Stability Test VAR satisfies the
stability condition
No root lies outside the unit circle
Residual Normality Tests
(JarqueBera) 7.57 0.67
Source: Researcher’s calculations.
•
Interpretation of empirical results:
The results of the empirical model should answer two main questions:
1. How inflation will respond to a particular shock in money supply "domestic liquidity" growth rate, exchange rate depreciation, output gap, world food prices, and to itself ?
2. What are the main factors that could be responsible for inflation dynamics in the Egyptian economy?
The results of the VAR model could be interpreted using two main analytic tools, namely, impulse response functions (IRFs) and variance decompositions (VDs). These tools can help answering the two questions mentioned earlier.
1.
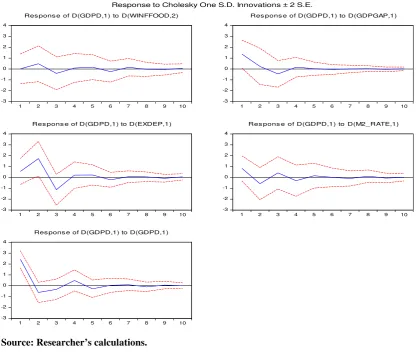
The response of inflation to different shocks:
The results of the empirical model metplausible expected results, as inflation rate responds positively in the first period following shocksto itself,domestic liquidity growth rate,output gap, exchange rate depreciation, and world food prices. Also expectations seemed to play an important role, as inflation rate responds positively to a shock in itself in the first year following the shock, which reinforces the idea that inflationary expectations begets more inflation.
Table 4: Impulse Response Functions (IRFs)
Period D(WINFFOOD,2) D(GDPGAP,1) D(EXDEP,1) D(M2_RATE,1) D(GDPD,1)
1 0.015937 1.374095 0.545791 0.829395 2.438220
(0.68129) (0.64379) (0.59744) (0.57532) (0.39553)
2 0.484312 0.240378 1.728340 -0.577611 -0.61597 (0.82621) (0.83542) (0.79288) (0.73728) (0.46831)
Source: Researcher’s calculations
Figure 3: Impulse ResponseFunctions (IRFs)
Source: Researcher’s calculations.
2.
Determinants of Inflation:
The determinants of inflation can be visualizedusing the variance decomposition of inflation which indicates the variables that can be responsible for inflation dynamics.
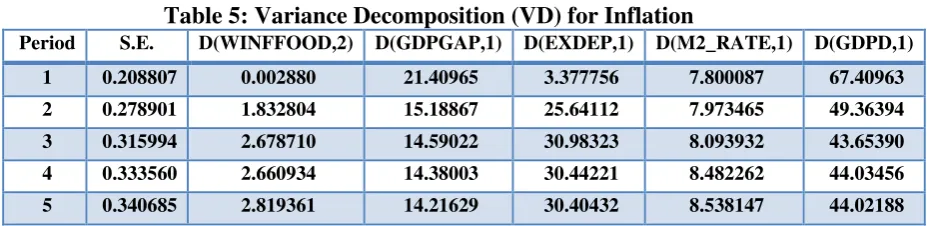
I will investigate inflation dynamics in both one and five- year time horizons. In a 1- year horizon, inflation is explained mostly by its own fluctuations (67.4%), followed by output gap (21.4%), domestic liquidity growth rate (7.8%), nominal depreciation of the Egyptian pound against the US dollar (3.4%). In a 5-year horizon, inflation is explained mostly by its own fluctuations (44%) followed by nominal depreciation of -3 -2 -1 0 1 2 3 4
1 2 3 4 5 6 7 8 9 10
Res pons e of D(GDPD,1) to D(WINFFOOD,2)
-3 -2 -1 0 1 2 3 4
1 2 3 4 5 6 7 8 9 10
Res pons e of D(GDPD,1) to D(GDPGAP,1)
-3 -2 -1 0 1 2 3 4
1 2 3 4 5 6 7 8 9 10
Res pons e of D(GDPD,1) to D(EXDEP,1)
-3 -2 -1 0 1 2 3 4
1 2 3 4 5 6 7 8 9 10
Res pons e of D(GDPD,1) to D(M2_RATE,1)
-3 -2 -1 0 1 2 3 4
1 2 3 4 5 6 7 8 9 10
Res pons e of D(GDPD,1) to D(GDPD,1)
[image:12.595.89.506.244.601.2]the Egyptian pound against the US dollar (30.4%), output gap (14.2%), domestic liquidity growth rate (8.5%), and world food prices (2.8%).It means that in a 1- year horizon about 32.6% of inflation dynamics can be attributed to factors other than inflation expectations" itself", while in a 5-year horizon about 56% ofinflation dynamics can be attributed to factors other than inflation expectations(See table 5below).
Table 5: Variance Decomposition (VD) for Inflation
Period S.E. D(WINFFOOD,2) D(GDPGAP,1) D(EXDEP,1) D(M2_RATE,1) D(GDPD,1)
1 0.208807 0.002880 21.40965 3.377756 7.800087 67.40963
2 0.278901 1.832804 15.18867 25.64112 7.973465 49.36394
3 0.315994 2.678710 14.59022 30.98323 8.093932 43.65390
4 0.333560 2.660934 14.38003 30.44221 8.482262 44.03456
5 0.340685 2.819361 14.21629 30.40432 8.538147 44.02188
Source: Researcher’s calculations.
These results are relatively similar to thosefound by other empirical studies. Almonsour (2010) concluded that the short run dynamics of inflation in Yemen can be explained mostly by its own fluctuations, followed by international prices and money supply. Within a one-year intervalabout 67.79% of inflation dynamics can be explained by inflation itself, while within a five-year interval shocks to money supply, domestic demand, exchange rate, and international prices explain about 60 % of inflation dynamics in Yemen.
6.
Conclusion and Policy Implications:
Inflation in Egypt is driven mostly by its own dynamics, followed by domestic liquidity, world food prices, output gap, and the rate of depreciation of the Egyptian pound against the US dollar.
Limiting exchange rate depreciation stabilizes prices in the short run. The findings imply that the authorities should remain vigilant in assessing the potential impact of foreign prices on the dynamics of inflation, in this regard; slowing the rate of depreciation would help limit the extent of imported inflation in the short run. In the long run, however, loss of international reserves will make it difficult to maintain a stable exchange rate.
modeling and forecasting abilities to be able to conduct a forward looking monetary policy.More counter-cyclical monetary policy associated with establishing nominal anchor to stabilize inflation expectation and fiscal consolidation is a key for the central bank to reduce the costs of disinflation.
References:
Ali, Heba . 2011. “Inflation Dynamics: The Case of Egypt”. MPRA Paper No. 36331 . Available at:http://mpra.ub.uni-muenchen.de/36331/
Al-Mashat, Rania. 2008. “MONETARY POLICY IN EGYPT: A RETROSPECTIVE AND PREPAREDNESS FOR INFLATION
TARGETING”. ECES Working Paper no. 134. Cairo, Egypt: Egyptian Center for Economic Studies.Available at:
http://www.eces.org.eg/Uploaded_Files/%7BB74FAF1E-964B-43D2-BE84-20B1DBE5080E%7D_ECESWP-134.pdf
Almounsor, Abdullah. 2010. “Inflation Dynamics in Yemen: An Empirical Analysis”. IMF Working Paper No. 144.Washington, D.C.:International Monetary Fund. Availableat:http://www.imf.org/external/pubs/ft/wp/2010/wp10144.pdf
Cerra, v. and S.Chaman.2000."Alternative Methods of Estimating Potential Output and the Output Gap: An Application to Sweden". IMF Working Paper No. 59. Washington, D.C.: International Monetary
Fund.Availableat:http://www.imf.org/external/pubs/ft/wp/2000/wp0059.pdf
Citu, Florin and Twaddle, James. 2003. "The output gap and its role in monetary policy decision-making". Reserve Bank of Newzeland: Bulletin Vol. 66 No. 1. Available at:
http://www.rbnz.govt.nz/research_and_publications/reserve_bank_bulletin/2003/2003 mar66_1citutwaddle.pdf
Claus, Iris. 2000. " Is the output gap a useful indicator of inflation?".Reserve Bank of Newzeland.Discussion Paper no.5.Available at:
http://www.rbnz.govt.nz/research_and_publications/discussion_papers/2000/dp00_5.p df
El-Sakka, M.I.T., and Khalifa H. Ghali. 2005. "The sources of inflation in Egypt: A Multivariatecointegration analysis". Review of Middle East Economics and
Finance,volume 3, issue 3, article 6, December.
Fanizza, Domenico, and LudvigSoderling. 2006." Fiscal determinants of inflation: A primer for the Middle East and North Africa". IMF Working Paper, no. 216. Washington, D.C.: International Monetary Fund. Available at:
https://www.imf.org/external/pubs/ft/wp/2006/wp06216.pdf
Helmy, Omneia. 2008."THE IMPACT OF BUDGET DEFICIT ON INFLATION IN EGYPT".
Studies.Available at: http://www.eces.org.eg/Uploaded_Files/%7B91B21DC3-76AD-4478-B364-D188F2B47CA0%7D_ECESWP141.pdf
Hosny, Amr. 2014. "Is Monetary Policy In Egypt Backward or Forward
Looking?".ERF 20th AnnualConference. Cairo, Egypt: Economic Research Forum. Available at:
http://www.erf.org.eg/CMS/uploads/pdf/ERF20AC_AmrSadekHosny.pdf
Iakova, Dora. 2007."Flattening of the Phillips Curve: Implications for Monetary Policy". IMF Working Paper No. 76. Washington, D.C.:International Monetary Fund.Available at:
http://www.imf.org/external/pubs/ft/wp/2007/wp0776.pdf
Moriyama, Kenji. 2011."Inflation Inertia in Egypt and its Policy
Implications".IMF Working Paper No. 160. Washington, D.C.:International Monetary Fund.Available at:
https://www.imf.org/external/pubs/ft/wp/2011/wp11160.pdf
Moursi, T. and M. El Mossallamy. 2007. "Effect of some recent changes in
Egyptian monetary policy: Measurement and evaluation". ECES Working Paper no. 122. Cairo, Egypt: Egyptian Center for Economic Studies.Available at: