Abstract— Currently information technology covers almost all aspects in our life, so that it considered as an essential requirement for organizations to be in harmony with e- government concept. Information technology considered as an essential way to enhance performance. E-government in Jordan still need an effective e-governance model to work in harmony with the corporate governance model, so as to improve the performance of organizations. This research investigates Jordanian public sector readiness to implement IT Governance concepts, in order to enhance Performance in Jordanian public sector organizations. Quantitative method is adopted for answering the research questions. For data collection, questionnaire was used after the selection of the targeted population and samples. Different statistics methods were utilized to analyze the collected data; also different statistical tools were used, such as SPSS 15 and SmartPLS 2.0, through a field survey of 26 organizations in Jordanian public sector. The first finding of this research indicates that there is an existence of the relationship between IT Governance and its Pillars: accountability, transparency, participation, and predictability, the second finding indicates that there is a relationship between IT Governance and Performance. This kind of research is very important for Jordanian public sector to take benefits from implementation of the above concepts in order to increase performance.
Index Terms— IT Governance, Performance, Accountability, Transparency, Participation, Predictability
I. INTRODUCTION
IT-governance is defined as" the use of information and communication technologies in public administrations to improve public services and democratic processes and to strengthen support to policies" (Henderson and Venkatraman, 1999). Cameron (2006) mentioned that IT governance is about assigning decision rights and creating an accountability framework that encourage desirable behaviors in the use of information and technology. According to Sam (2004) IT-governance is the Use of information and communication technologies to support good governance. IT Governance is an expression used to explain the use of organizational processes to make decisions about how to get and deploy IT resources and competencies (Henderson and Venkatraman, 1993).
Manuscript Manuscript received Jul 17,2010 . Author is Minwer M. Wraikat. He is instructor in Yarmook university and JAF institute for
technology, Amman - Jordan 00962-777 - 410520 ; fax: 5370685 ; e-mail: jusafe2001@ yahoo.com.
II. IT GOVERNANCE PILLARS
According to Asian Development Bank (1998) the most important pillars of governance are the followings: accountability, transparency, predictability, Participation. In the following sections there will be a brief description about each one of the pillars and its importance as follows: A. Accountability (ACC)
According to Mulgan R. (2000) Accountability explain the relationship between two parties in which one party, the holder of accountability, has the authority to search for information about, to investigate and to inspect the behavior of another party, the giver of accountability. Accountability is a concept which should be determined in context: who is
accountable to whom and for what? (Scott. C, 2000).
Accountability is the capacity to call officials to account for their actions.
B. Transparency (TRA)
“Transparency is the deliberate attempt to make available all legally releasable information—whether positive or negative in nature—in a manner that is accurate, timely, balanced, and unequivocal, for the purpose of enhancing the reasoning ability of publics and holding organizations accountable for their actions, policies and practices.” Transparency also entails low-cost access to relevant and material information (Asian Development Bank, 1998). According to Balkin (1999) Transparency divided into three types: informational transparency, participatory transparency, and accountability transparency.
C. Participation (PAR)
Friedman (2006) argued that Participatory governance is illustrated as a regulatory framework which is used to run public affairs and it is not exclusively assigned to government and the public administration, but also engage in co-operation between state institutions and civil society groups. It is noticed that the participation of people in giving feedback, making policy in order to make suitable decisions is very important in any organization. Participation needed to obtain reliable information and to serve as reality check and watchdog for the stakeholders.
D. Predictability (PRE)
According to Asia group (1998) Predictability can be obtained from laws and regulations that are obvious, known previously, and uniformly and effectively enforced. When there is no enough predictability, it will make difficulties for public officials to plan for the provision of services and is an excellent reason for nonperformance. According to OECD (2008) the rule of law refers to the institutional procedure of setting, understanding and executing laws and other regulations.
Information Technology Governance Role in Enhancing
Performance: A Case Study on Jordan Public Sector
III. ORGANIZATION'S PERFORMANCE
Performance can be defined as the capability of an entity to produce results in a dimension determined a priori (Laitinen, 2002). Measuring and improving performance is a key to ensuring the successful implementation of organization strategy (Laitinen, 2002). When financial and non- financial measures are included in the same performance model, managers can survey performance in several areas simultaneously in order to facilitate efficient strategic decision making. IT Governance Institute (2003) emphasized that, the main benefit of IT governance is to help IT activities, to guarantee that IT’s performance achieve the following objectives:
Aligning IT with enterprise and realizing the expected benefits.
Making IT as an enabler to the enterprise.
Accountable use of IT resources.
Suitable management of IT-related risks. IV. NON FINANCIAL METRICS
The traditional dimensions and measures used in executive decision making to measure the performance of an organization are financial. most opinions prefer the non-financial measures because of some disadvantages of financial measures. Some of financial measures disadvantages are encourage short-termism, a lack of strategic focus, and local optimization; they also encourage managers to minimize any variance from the standard rather than seeking continual improvement, and they fail to provide information on what customers want and how competitors are performing (Neely, 1999). According to Kaplan (1984) the financial measures generated by traditional cost accounting systems provide an inadequate summary of a company's manufacturing operations. Today's global competition requires that non-financial measures - on quality, inventory levels, productivity, flexibility, deliverability, and employees. Also be used in the evaluation of a company's manufacturing performance. According to Drury (1990) new performance measures are the non-financial and concentrate on the following factors such as quality, reliability, and flexibility and delivery performance. Bhimani (1994) also claimed that the importance of considering non-financial information is very important and that practical proof proposes a rising role for this kind of information in enterprise management. Non financial benefits may come as an improvement of customer satisfaction, reduced defects, increased market share.
V. THE RESEARCH MODEL
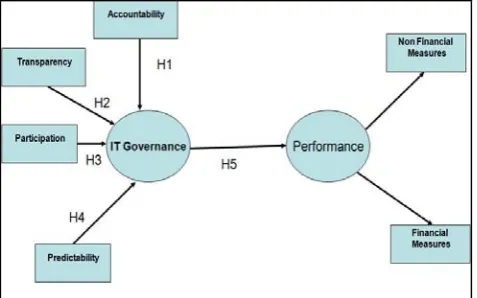
According to the previous studies, IT Governance (ITG) and Performance, researcher suggest and develop a model to indicate the relationship between these elements. In this study the researcher study how the IT Governance enhance the performance in the public sector organizations. Performance of the organization studied as a dependent variable from one side with the IT Governance as an independent variable. Some researchers study one or some of IT Governance (ITG) pillars. In this research a comprehensive study achieved which take into consideration the entire integrated IT Governance (ITG) pillars. They were searched as the independent variables as shown in figure 1 as follows: Accountability (ACC),
Participation (PAR), Transparency (TRA), and Predictability (PRE). Performance of any organization is the capability to achieve objectives. There are two features taken into consideration when measuring the performance of any organization: financial measures which are mainly discuss the profit that organization can achieve and non-financial measures which discuss measures other than financial that organization may achieve such as customer satisfaction, quality enhancement …etc. Figure 1 shows our research model, which is divided into two sections: the first section discuss the relationship between IT governance from one side and its pillars accountability, transparency, participation, and predictability from another side. The second section discuss the relationship between IT Governance as an independent variable and the Performance as a dependent variable. The researchers select the Jordanian Public Sector and try to prove these relationships.
VI. RESEARCH HYPOTHESES
Hypothesis 1: There is a significant relation between IT Governance and Accountability.
Hypothesis 2: There is a significant relation between IT Governance and Transparency.
Hypothesis 3: There is a significant relation between IT Governance and Participation.
Hypothesis 4: There is a significant relation between IT Governance and Predictability.
[image:2.595.305.544.460.609.2]Hypothesis 5: There is a significant relation between IT Governance and Performance.
Figure 1 Research Model Elements(This figure shows all hypotheses, IT Governance pillars and performance measures)
VII. RESEARCH METHODOLOGY AND ANALYSIS
To test the proposed research model, researcher adopted the survey method for data collection, and examined our hypotheses by applying the partial least squares (PLS) and path analysis method.
A. Measurement and Data Collection
divided into two major kinds : quantitative and qualitative which refer to the type of the data gathered and the investigation that is used on that (Yin, 1994).
B. The Sample of the study
Enhancing the Jordanian public sector performance considered as one of the most important issues that government concentrate on. Jordan consider one of the most active countries in the middle east that has a large evolution in the information technology ,which is mainly used to enhance the quality of services that introduced through different types of agencies . Researcher chose in his study the Jordanian public sector as the target population because there are a lot of IT projects executed yearly in different type of organization, so it is suitable to investigate it, Because the e-government in Jordan has a good infrastructure and go forward in advance steps in most organizations and their services, so it is very important to see also how IT Governance is vital in enhancing the public sector performance. There were 26 organizations had been chosen as samples for this study questionnaire was prepared in both English and Arabic languages and distributed to the targeted people on these organizations.
organizations.
VIII. OPERATIONALISATION OF THE INDEPENDENT VARIABLES
A. SPSS Technique
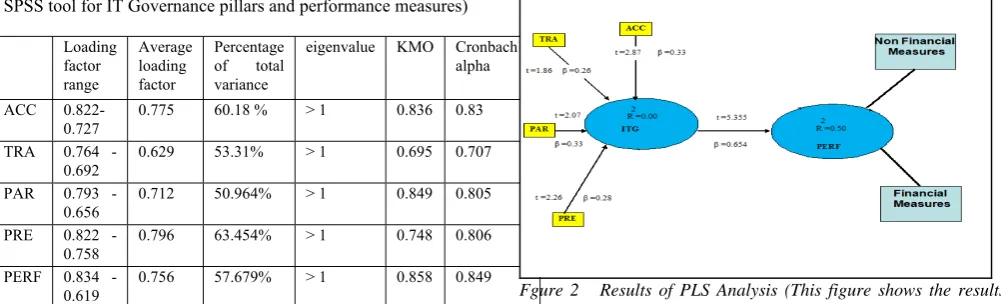
[image:3.595.45.546.555.707.2]As indicated by Referring to some authors, whom they explained the importance of IT Governance (ITG) pillars and its importance in enhancing performance of organizations , particularly non –financial. The researchers use in this phase SPSS tools to check the reliability of the data. Each pillar of ITG and performance were analyzed. According to the following elements: The Factor analysis which showed a one-factor solution of each construct) construct , the loading factor range with average loading , total variance percentage , eigenvalue, Kaiser-Meyer-Olkin (KMO) Measure of Sampling Adequacy which describe if the sample is enough to achieve the test, reliability was calculated based on Cronbach’s alpha. all results are shown in table 1.
Table. I SPSS Results (This table shows the results obtained by SPSS tool for IT Governance pillars and performance measures)
Loading factor
range
Average loading factor
Percentage of total variance
eigenvalue KMO Cronbach’s alpha
ACC 0.822-0.727
0.775 60.18 % > 1 0.836 0.83 TRA 0.764
-0.692
0.629 53.31% > 1 0.695 0.707
PAR 0.793 - 0.656
0.712 50.964% > 1 0.849 0.805 PRE 0.822 -
0.758
0.796 63.454% > 1 0.748 0.806 PERF 0.834 -
0.619
0.756 57.679% > 1 0.858 0.849
B. Partial Least Squares (PLS) Product Indicator Approach For Measuring Interaction
To solve difficulties that face traditional methods such effects of measurement error, researcher in this study use product indicator approach in conjunction with Partial Least Squares (PLS). The predictor, moderator, and dependent variables
used with traditional methods, viewed with the PLS method as latent variables (i.e., constructs) which cannot be measured directly. in PLS product Each set of indicators reflecting their underlying construct (i.e., latent variable) then submitted to PLS for estimation resulting in a more accurate assessment of the underlying latent variables and their relationships. According to (Chin W. and Gopal A., 1995) The PLS procedure become a well-known and use among IS researchers in recent years because of its ability to model latent constructs under conditions of non-normality and small to medium sample sizes. PLS is similar to regression as a components-based structural equations modeling technique, but simultaneously models the structural paths (i.e., theoretical relationships among latent variables) and measurement paths (i.e., relationships between a latent variable and its indicators). Rather than assume equal weights for all indicators of a scale, the PLS algorithm allows each indicator to vary in how much it contributes to the composite score of the latent variable indicators with weaker relationships to related indicators and the latent construct are given lower weightings(Chin,W. et al., 1996). In this sense, PLS is more preferable than other techniques such as regression which assume error free measurement (Lohmöller, 1989). PLS is considered as a suitable technique for explaining complex relationships (Fornell C. and Yi, 1992). According to Chin (1998) PLS was used as technique which allows latent constructs to be modeled either as formative or reflective indicators. Additionally it makes minimal demands in terms of sample size to validate a model compared to alternative structural equation modeling techniques. The researcher use in the analysis SmartPLS 2.0 tool project which is located at the school of business at the University of Hamburg in Germany. SmartPLS 2.0 can be used in business research for the creation of path model and the measurement using partial least square approach. SmartPLS 2.0 redesigned to use java Eclipse platform technology. SmartPLS allows creating and measuring a path model and evaluating the results. As indicated by Ringle & Wende, (2005) there are also additional functionalities can easily add them to the SmartPLS 2.0 java Eclipse Plug-ins (. All results of SmartPLS 2.0 that made to this research are shown in figure2 .
Fgure 2 Results of PLS Analysis (This figure shows the results obtained by SPSS tool for IT Governance and performance measures)
A number of techniques used to assess the hypotheses of the model. the first method is the overall coefficient of determination (R square value ) which is An indicator to measure the degree that the model fits the data, if the value of R-square close to 1.0, this indicates that the model
accounted for almost all of the variability with the variables determined in the model. And if the R-Squared is 0.0, this means that one term doesn't assist you to know the other term. The second technique is using standardized estimation coefficients (beta). Standardized regression coefficients (beta coefficients, beta weights) are usually used in quantitative social sciences. They are used for many purposes: selecting variables, determining the relative importance of explanatory variables, comparing the effect of changing different variables, and so forth (Johan, .B , 1994). When the value of beta closes to zero, it means that the relationship is weak, but when the value of beta increased, this means the relationship is strong. Table 6 shows the results of the evaluation test for the data used in building research model.
X. ANALYSIS OF MEASUREMENT MODEL (Result of ITG construct)
Four hypotheses were presented with respect to this construct. Each one of these hypotheses has a number of independent parameters; namely accountability, transparency, participation and prediction. These parameters were hypothesized to have relationships with dependent variables IT Governance. The associations were tested and the results were interpreted and conclusions are made.
A.IT Governance and Accountability
There is a significant relation between IT Governance and accountability
H1: ITG and ACC: ITG = £ (ACC)
Accountability was hypothesized to be positively associated with IT Governance. According to the questionnaire results and SmartPLS analysis, beta was found to equal 0.33 which indicates the existence of positive significant relationship between accountability and ITG, and the t-value of the hypothesized model was significant with a value of 2.87. This indicated that accountability is part of IT Governance which corresponds with the writings of a large number of authors, such as La Porte M. et al. (2000), Asian Development Bank(1998) , Mulgan R.(2000) who considered accountability to be the most important factor in the IT Governance pillars. The coefficient of determination (R Square) of the accountability was equal to 0.61, which means that 61 % of the total variance in accountability was accounted for the IT Governance.
B.IT Governance and transparency
There is a significant relation between IT Governance and transparency
H2: ITG and ACC: ITG = £ (TRA)
Transparency was hypothesized to be positively associated with IT Governance. According to the questionnaire results and SmartPLS analysis, beta was found to equal 0.26 which indicates the existence of positive significant relationship between accountability and ITG, and the t-value of the hypothesized model was significant with a value of 1.86 at 0.1 significance level. This indicated that transparency is
part of IT Governance which corresponds with the writings of a large number of authors, (Diamond Douglas and Verrecchia., 1991), Rawlins (2006), Johnston (1997), (Benjamin E. Hermalin and Michael S. Weisbach., 2007) who considered transparency to be one of the most important factor in the IT Governance pillars The coefficient of determination (R Square ) of the transparency was equal to 0.53, which means that 53 % of the total variance in accountability was accounted for the IT Governance.
C. IT Governance and Participation
There is a significant relation between IT Governance and participation
H3: ITG and PAR: ITG = £ (PAR)
Participation was hypothesized to be positively associated with IT Governance. According to the questionnaire results and SmartPLS analysis, beta was found to equal 0.33 which indicates the existence of positive significant relationship between participation and ITG, and the t-value of the hypothesized model was significant with a value of 2.07. This indicated that participation is part of IT Governance which corresponds with the writings of a large number of authors, such as Richard Heeks (1998), Friedman (2006), Richard Heeks (1998) and Robin Mansell (1998) who considered participation to be one of the most important pillars of the IT Governance. The coefficient of determination (R Square) of the participation was equal to 0.51, which means that 51% of the total variance in the participation was accounted for the IT Governance
D.IT Governance and Predictability
There is a significant relation between IT Governance and predictability
H4: ITG and PRE: ITG = £ (PRE)
XI. STRUCTURAL MODEL
With an adequate measurement model and an acceptable level of multicolinearity, the proposed hypotheses were tested with PLS. The results of the analysis are depicted in Figure 2 and summarized in Table 2 and table 3.
A.Performance and its relation with IT Governance
There is a significant relation between ITG and Performance
H5: ITG and PERF: PERF = £ (ITG) Performance was hypothesized to be positively associated
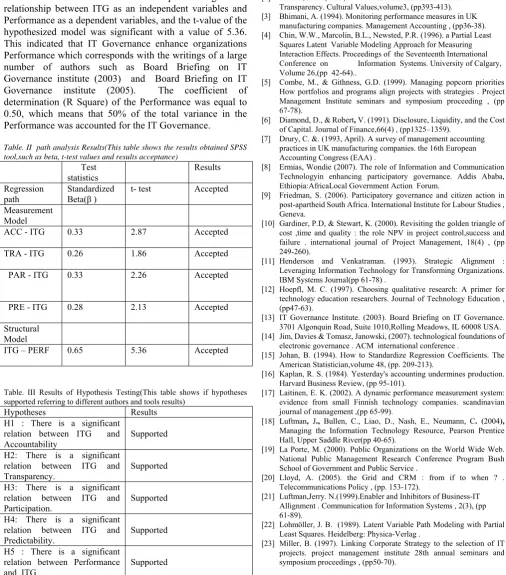
[image:5.595.43.550.212.788.2]with ITG .According to the SmartPLS which analyze path analysis and results were obtained, beta was found to equal 0.65 which indicates the existence of positive significant relationship between ITG as an independent variables and Performance as a dependent variables, and the t-value of the hypothesized model was significant with a value of 5.36. This indicated that IT Governance enhance organizations Performance which corresponds with the writings of a large number of authors such as Board Briefing on IT Governance institute (2003) and Board Briefing on IT Governance institute (2005). The coefficient of determination (R Square) of the Performance was equal to 0.50, which means that 50% of the total variance in the Performance was accounted for the IT Governance.
Table. II path analysis Results(This table shows the results obtained SPSS tool,such as beta, t-test values and results acceptance)
Test statistics
Results
Regression path
Standardized Beta(β )
t- test Accepted
Measurement Model
ACC - ITG 0.33 2.87 Accepted
TRA - ITG 0.26 1.86 Accepted
PAR - ITG 0.33 2.26 Accepted
PRE - ITG 0.28 2.13 Accepted
Structural Model
ITG – PERF 0.65 5.36 Accepted
Table. III Results of Hypothesis Testing(This table shows if hypotheses supported referring to different authors and tools results)
Hypotheses Results H1 : There is a significant
relation between ITG and Accountability
Supported
H2: There is a significant relation between ITG and Transparency.
Supported
H3: There is a significant relation between ITG and Participation.
Supported
H4: There is a significant relation between ITG and Predictability.
Supported
H5 : There is a significant relation between Performance and ITG
Supported
XII. CONCLUSIONS
Firms should take into considerations the importance of IT governance and its pillars accountability, transparency, participation and predictability in enhancing their performance. Given the importance of IT Governance in today’s world—and even more so in future we hope that our findings will be useful to others and urge them to support next researches in the IT Governance field, and its role in enhancing the Information Technology Portfolio Management.
REFERENCES
[1] Asian Development Bank. (1998). Annual report
[2] Balkin, J. M. (1999). How Mass Media Simulate Political Transparency. Cultural Values,volume3, (pp393-413).
[3] Bhimani, A. (1994). Monitoring performance measures in UK manufacturing companies. Management Accounting , (pp36-38).
[4] Chin, W.W., Marcolin, B.L., Newsted, P.R. (1996). a Partial Least Squares Latent Variable Modeling Approach for Measuring
Interaction Effects. Proceedings of the Seventeenth International Conference on Information Systems. University of Calgary, Volume 26,(pp 42-64)..
[5] Combe, M., & Githness, G.D. (1999). Managing popcorn priorities How portfolios and programs align projects with strategies . Project
Management Institute seminars and symposium proceeding , (pp 67-78).
[6] Diamond, D., & Robert, V. (1991). Disclosure, Liquidity, and the Cost
of Capital. Journal of Finance,66(4) , (pp1325–1359).
[7] Drury, C. &. (1993, April). A survey of management accounting practices in UK manufacturing companies. the 16th European Accounting Congress (EAA) .
[8] Ermias, Wondie (2007). The role of Information and Communication Technologyin enhancing participatory governance. Addis Ababa, Ethiopia:AfricaLocal Government Action Forum.
[9] Friedman, S. (2006). Participatory governance and citizen action in post-apartheid South Africa. International Institute for Labour Studies , Geneva.
[10] Gardiner, P.D, & Stewart, K. (2000). Revisiting the golden triangle of cost ,time and quality : the role NPV in project control,success and failure . international journal of Project Management, 18(4) , (pp 249-260).
[11] Henderson and Venkatraman. (1993). Strategic Alignment : Leveraging Information Technology for Transforming Organizations. IBM Systems Journal(pp 61-78) .
[12] Hoepfl, M. C. (1997). Choosing qualitative research: A primer for technology education researchers. Journal of Technology Education , (pp47-63).
[13] IT Governance Institute. (2003). Board Briefing on IT Governance. 3701 Algonquin Road, Suite 1010,Rolling Meadows, IL 60008 USA. [14] Jim, Davies & Tomasz, Janowski, (2007). technological foundations of
electronic governance . ACM international conference .
[15] Johan, B. (1994). How to Standardize Regression Coefficients. The American Statistician,volume 48, (pp. 209-213).
[16] Kaplan, R. S. (1984). Yesterday's accounting undermines production. Harvard Business Review, (pp 95-101).
[17] Laitinen, E. K. (2002). A dynamic performance measurement system: evidence from small Finnish technology companies. scandinavian journal of management ,(pp 65-99).
[18] Luftman, J., Bullen, C., Liao, D., Nash, E., Neumann, C. (2004),
Managing the Information Technology Resource, Pearson Prentice Hall, Upper Saddle River(pp 40-65).
[19] La Porte, M. (2000). Public Organizations on the World Wide Web. National Public Management Research Conference Program Bush School of Government and Public Service .
[20] Lloyd, A. (2005). the Grid and CRM : from if to when ? . Telecommunications Policy , (pp. 153-172).
[21] Luftman,Jerry. N.(1999).Enabler and Inhibitors of Business-IT Allignment . Communication for Information Systems , 2(3), (pp 61-89).
[22] Lohmöller, J. B. (1989). Latent Variable Path Modeling with Partial Least Squares. Heidelberg: Physica-Verlag .
[24] Mulgan, R. (2000). ‘Accountability’: an ever-expanding concept? Public Administration , (pp560–569).
[25] Neely, A. (1999). The performance measurement revolution: Why now andwhat next? International Journal of Operations & Production Management , (pp203-230).
[26] OECD (2008). Transparency and Predictability for Investment Policies Addressing National Security Concerns : a Survey of Practices, annual report.
[27] Paul, Sturges. (2004). Corruption, Transparency and a Role for ICT? International Journal of Information Ethics ,(volume 4).
[28] Raghupathi, W. (2007). Corporate Governance of IT, ACM international conference, Volume 50, No. 8, (pp 94-99).
[29] Schein, E. (1996). Three Cultures of Management : The Key to Organizational Learning. Harvard Business Review, Sloan Management Review .
[30] Scott. C. (2000). Accountability in the regulatory state. Journal of Law and Society ,
(pp 38-60).
[31] Somuah , S. (2004). E-Governance For Transparency, Accountability & Effectiveness of The Public Service [Power Point Slides] Retrieved from Web Site http:// unpan1.un.org.