A Study on Improving the Strength of Sub Grade
Soil by using Polypropylene Fiber
Manisha Devi1, Akash Batra2, Pappu Sharma3 1
M.Tech Scholar, Civil Department, Indus Institute of Engg. And Technology-Jind, 126102, India 2
Assistant professor, Civil Department, Indus Institute of Engg. And Technology-Jind, 126102, India 3
Assistant professor, Civil Department, Indus Institute of Engg. And Technology-Jind, 126102, India
Abstract: Expansive Silt soil with low plasticity is encountered in most parts of Haryana state and the preliminary investigation shows that it has poor engineering properties. Traditional stabilizers like cement, lime and others have been efficient and effective in soil stabilization but their rising cost and negative impact to the environment has led to research into Polypropylene (PP) fiber to be used as an alternative in soil stabilization. The study investigated the properties of expansive silt soil with low plasticity when stabilized by Polypropylene (PP) fiber. The research covered grading test, Plasticity Index (PI), Liquid limit, Shear strength, Maximum dry density and Optimum moisture content, California Bearing Ratio (CBR). First particles size distribution was determined from grading test, secondly varying percentages (0.10%, 0.15%, 0.20%) of Polypropylene (PP) fiber was used to stabilize clay silt soil and then PI and CBR were determined. Two soil sample are taken in this study from the different place of the Jind districts of Haryana. The CBR was carried out using Maximum Dry Density (MDD) and Optimum Moisture Content (OMC) from graph of dry density against moisture content obtained from proctor test. The trend indicated that California Bearing Ratio increased with increase the percentage of Polypropylene (PP) fiber. The CBR value % are increased 5.54% to 8.66% after reinforcing the soil sample -1 with 0.20% Polypropylene (PP) fiber and in soil sample -2 it increased 5.61% to 8.22%.The shear strength of the soil sample -1 are increased 0.86kg/cm3 to 2.29kg/cm3 and in soil sample -2 it increased 0.82kg/cm3 to 1.76kg/cm3 .
Keywords: Silt Soil With Low Plasticity, Stabilizers, Polypropylene (PP) Fiber, Dry Density , Moisture Content, CBR.
I. INTRODUCTION
Soil stabilization is used to strengthen road surfaces by enhancing the weight bearing capabilities of in-situ subsoil, sands and other waste materials. There are two primary objectives of soil stabilization; one is to enhance the California bearing ratio of soils that are in-situ from four to six times, the other is to create solid base and sub-base courses by improving the in-situ materials. Soil stabilization in the past depended mainly on the binding properties of clay soils and cement products, the technique was used is the ‘Rammed earth technique’ with lime, however now green technology techniques are introduced; some of the typical examples of green technologies are: bio-polymers, synthetic-polymers, enzymes, surfactants, calcium chloride, sodium chloride and more. These techniques create hydrophobic surfaces that prevents road failure by preventing the frost or water from penetrating the soil to the treatment layer. Soil stabilization is an effective and reliable technique for altering important soil properties.
Several reinforcement methods are available for stabilizing expansive soils such as stabilization with chemical additives, rewetting, soil replacement, compaction control, moisture control, surcharge loading and thermal methods. These techniques have wide application in areas like construction of road, slope stabilization, railway embankments, and so on. Soils are generally stabilized to increase their strength and durability or to prevent erosion and dust formation in soils.
The main aim is the creation of a soil material for the designed life of the engineering project. The properties of soil vary a great deal at different places. Various methods are employed to stabilize soil and the method should be verified in the lab with the soil material before applying it in the field.
A. Statement of the Problem
B. Objectives of the Study
1) To determine the optimum moisture content, maximum dry density, shear strength for the original sample that is without additives.
2) To determine the maximum dry density, optimum moisture content, shear strength for the percentages of 0%,0.10%, 0.15%, 0.20% polypropylene fibers
3) To compare the results obtained between the original sample and the optimum sample with admixtures.
C. Scope of Study
A comparison is conducted between the sample with admixtures and the original sample, based on lab experiments that were conducted in I.I.E.T geotechnical lab. These experiments are: Specific gravity of soil, Liquid limit, Plastic limit, Proctor compaction test and shear box test ,Unconfined compression test. The sample was obtained I.I.E.T, Kinana, Jind then additives of polypropylene fibers was mixed with the sample, after that several tests were made on the original sample and sample with additives. The experiments were taken place in I.I.E.T geotechnical laboratory. The results obtained from the experiments will help a lot the construction sites in determining the precise percentage of additives.
II. LITERATURE REVIEW
Stabilization is one of the methods of treating the expansive soils to make them fit for construction. Variety of stabilizers may be divided into three groups (Petry 2002): (a) traditional stabilizers (lime, cement etc.), (b) by-product stabilizers (fly ash, quarry dust, phosphor-gypsum, slag etc.) and (c) non-traditional stabilizers (sulfonated oils, potassium compounds, polymer, enzymes, ammonium chlorides etc.). Disposal of large quantities of industrial by products as fills on disposal sites adjacent to industries not only requires large space but also create a lot of geo-environment problems.
Sharma et al. (1992) studied stabilization of expansive soil using mixture of fly ash, gypsum and blast furnace slag. They found that fly ash, gypsum and blast furnace slag in the proportion of 6: 12: 18 decreased the swelling pressure of the soil from 248 kN/m2 to 17 kN/m2 and increased the unconfined compressive strength by 300%.
Srivastava et al. (1997) studied the change in micro structure and fabric of expansive soil due to addition of fly ash and lime sludge from SEM photograph and found changes in micro structure and fabric when 16% fly ash and 16% lime sludge were added to expansive soil. Srivastava et al. (1999) have also described the results of experiments carried out to study the consolidation and swelling behaviour of expansive soil stabilized with lime sludge and fly ash and the best stabilizing effect was obtained with 16% of fly ash and 16% of lime sludge.
Pandian et al. (2001) had made an effort to stabilize expansive soil with a class –F Fly ash and found that the fly ash could be an effective additive (about 20%) to improve the CBR of Black cotton soil (about 200%) significantly.
Turker and Cokca (2004) used Class C and Class F type fly ash along with sand for stabilization of expansive soil. As expected Class C fly ash was more effective and the free swell decreased with curing period. The best performance was observed with soil , Class C fly ash and sand as 75% , 15% and 10% respectively after 28 days of curing.
Satyanarayana et al. (2004) studied the combined effect of addition of fly ash and lime on engineering properties of expansive soil and found that the optimum proportions of soil: fly ash: lime should be 70:30:4 for construction of roads and embankments.
Phani Kumar and Sharma (2004) observed that plasticity, hydraulic conductivity and swelling properties of the expansive soil fly ash blends decreased and the dry unit weight and strength increased with increase in fly ash content. The resistance to penetration of the blends increased significantly with an increase in fly ash content for given water content. They presented a statistical model to predict the undrained shear strength of the treated soil.
III. MATERIAL AND METHODOLOGY
Based on the objectives and the previous chapter, the steps and procedures explained in this chapter. All the tests were done in I.I.ET laboratory and all the results were recorded and a comparison was made on the two samples and analysis of the effects of stabilizer was made to determine which percentage is the optimum.
A. Soils
B. Polypropylene fiber (PP)
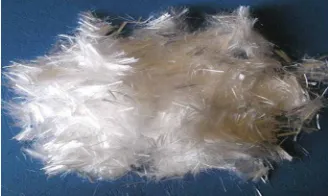
[image:3.612.224.388.172.270.2]Polypropylene is the first stereo regular polymer to have achieved industrial importance. The fibers from Polypropylene were introduced to the textile arena in the 1970s and have become an important member of the rapidly growing family of synthetic fibers. Today Polypropylene enjoys fourth spot behind the “big three” fibre classes, i.e. polyester, nylon and acrylic. However, as opposed to other commodity fibers, its use as apparel and household textiles has been rather limited; the bulk of the fiber produced is used for industrial applications. A thermoplastic polymer used in a wide variety of applications. It is an addition polymer made via chain-growth polymerization from the monomer propylene.
Fig 3.1 Polypropylene fiber (PP)
C. Wter
Potable tap water is used for experimental work. Although the water itself is often not considered when dealing with materials that go into the production of concrete, it is an important ingredient. Typically, 150 to 200 kg/m3 of water are used. The old rule of thumb for water quality is “If you can drink it, you can use it in concrete,” although good-quality concrete can be made with water that is not really potable. Indeed, more bad concrete is made by using too much drinkable water than by using the right amount of undrinkable water. The water employed in the mixtures was taken from the Indus institute of engineering technology.
D. Characteristics of the Soils Used
The index properties of these soils include the consistency limit, liquid limit, plastic limit and shrinkage limit as given below:
E. Plasticity Index
Plasticity index (IP) is the range of moisture content over which a soil exhibits plasticity. It is the numerical difference between the
liquid limit (WL) and the plastic limit (WP). Thus,
IP = WL – WP
When either WL or WP cannot be determined, the soil is called as non-plastic (NP). When the plastic limit is equal to or greater than
liquid limit, the plasticity index is reported as zero.
F. Liquidity Index
Liquidity index (IL) is defined as the ratio of the difference between the natural water content of a soil and its plastic limit to its
plasticity index.
( ) ×
Where WN is the water content of the soil in natural condition
The liquidity index of a soil indicates the nearness of its water content to its liquid limit. When the soil is at its liquid limit, its liquidity index is 100% and it behaves as a liquid. When the soil is at the plastic limit, its liquidity index is zero. Negative values of the liquidity index indicate water content smaller than the plastic limit. The soil is than in solid (desiccated) state. The liquidity index is also known as Water-plasticity ratio.
G. Consistency Index
Consistency Index (IC) is defined as the ratio of the difference between the liquid limit and the natural water content of a soil to its
= ( − ) ×
Where WN is the water content of the soil in natural condition
H. Specific Gravity
The specific gravity (G) of soil is defined as the ratio of the unit weight of a given volume of solids to the unit weight of an equal volume of water at 4°C. The formula for specific gravity can be given
by-=
Where,
G = Specific Gravity of the soil sample
γs = Unit weight of the soil sample
γw = Unit weight of the water at 4oC
The specific gravity of solids for most of the natural soil fall in range of 2.65 to 2.80, it is determined with the help of Pycnometer bottle.
I. Preparation of samples
Following steps are carried out while mixing the fiber to the soil-
1) All the soil samples are compacted at their respective maximum dry density (MDD) and optimum moisture content (OMC), corresponding to the standard proctor compaction tests
2) Content of fiber in the soils is herein decided by the following equation:
Where, ρf = ratio of fiber content
Wf = weight of the fiber
W = weight of the air-dried soil
3) The different values adopted in the present study for the percentage of fiber reinforcement are 0%, 0.10%, 0.15%, 0.20%.
4) In the preparation of samples, if fiber is not used then, the air-dried soil was mixed with an amount of water that depends on the OMC of the soil.
5) If fiber reinforcement was used, the adopted content of fibers was first mixed into the air-dried soil in small increments by hand, making sure that all the fibers were mixed thoroughly, so that a fairly homogenous mixture is obtained, and then the required water was added.
IV. TEST PROGRAMME AND PROCEDURE
Detailed investigations are carried out on two different soils collected from jind. Initially experiments were conducted to find out gradation, liquid limit, plastic limit and the plasticity index of these soils. Specific gravity of these soils is determined using Pycnometer bottle. After assessing the index properties, proctor compaction tests were conducted to find out the optimum moisture content (OMC) and maximum dry density (MDD) for the soils and for soil mixed with different types of soil stabilizers. Polypropylene fiber were used for soil stabilization.
The CBR tests were conducted to evaluate the behavior of soils and soil mixed with different type of soil stabilizers .
A. Grain size Distribution
Take the portion of the soil passing 4.75 mm IS sieve. Oven dry it at 105 to 1100C. Weigh it to 0.1% of the total mass. Sieve the soil trough the nest of fine sieves, the sieves should be agitated so that the sample rolls in irregular motion over the sieves. However, no particles should be pushed through the sieve. Take the material retained on various sieves in a mortar. Rub it with rubble pestle, but do not try to break individual particles. Reserve the material through the nest of sieves. A minimum of 10min of shaking is required if a mechanical shaker is used. Collect the soil fraction retained on each sieve in a separate container. Take the mass. Determine the percentage retained, cumulative percentage retained, and the percentage finer, based on the total mass taken in step (1).
Calculation
Total weight of the sample = W gm.
Weight retained on 75 micron sieve (air-dried) = W1
[image:5.612.217.399.210.360.2]% of material passing through 75 micron sieve = ( )×
Figure 4.1 Hand Sieve Shaker
B. Specific Gravity Test
The specific gravity of soil is frequently required for computation of several quantities such as void ratio, degree of saturation, unit weight of solids and unit weight of soil in various states. It is determined using a Pycnometer bottle as per IS: 2386 (Part 3) 1963. The Pycnometer bottle is shown in figure 5.2. The Specific gravity is dimension less.
Figure 4.2 Pycnometer Bottle
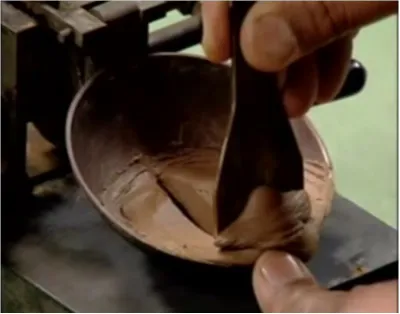
C. Procedure
The procedure involves weighing first an empty, dried Pycnometer bottle, say, of weight (W1). Next about 300 gm of soil is placed
in the Pycnometer which is weighed again (W2). Remaining part of the bottle is then filled with water and stirred with a glass rod.
The Pycnometer is gradually filled with water carefully removing the entrapped air. Vacuum pump is also some time used to expel entrapped air. The Pycnometer with the soil is filled up to the top with water and weighed (W3).
Finally, the Pycnometer is emptied completely, cleaned and weighed after filling with water up to the top (W4).
Specific Gravity = ( ( ) ( )
)
W1 = weight of empty pycnometer bottle
W2 = weight of pycnometer bottle half filled with soil
[image:5.612.228.389.443.571.2]W4 = weight of pycnometer bottle filled with water
D. Liquid Limit Test
Liquid Limit is the water content in percentage, at which the two sides of a groove cut in the soil sample contained in the cup of a Casagrande device would touch over a length 0f 12mm after 25 impacts. The procedure of test is summarized as follow as per IS 2720: Part 5 (1985):
[image:6.612.207.407.380.537.2]About 120 gm of an air-dried sample passing through 425 µ IS sieve is taken in a dish and mixed with distilled water to form a uniform paste. A portion of this paste is placed in the cup of the liquid limit device, and the surface is smoothened and leveled with a spatula to a maximum depth of 1 cm. A groove is cut through the sample along the symmetrical axis of the cup, preferably in one stroke, using a standard grooving tool. IS: 2720-Part 5 recommends two types of grooving tools: (1) Casagrande’s tool, (2) ASTM tool. In this study, Casagrande’s tool has been used. The Casagrande’s tool cuts a groove of width 2 mm at the bottom, 11 mm at the top and 8 mm deep. After the soil pat has been cut by a proper grooving tool, the handle is turned at a rate of 2 revolutions per second until the two parts of the soil sample come into contact at the bottom of the groove along a distance of 12 mm. The groove should close by a flow of the soil, and not by slippage between the soil and the cup. When the groove closes by a flow, it indicates the failure of slopes formed on the two sides of the groove. The soil in the cup is again mixed, and the test is repeated until two consecutive tests give the same number of blows. About 20 gm of soil near the closed groove is taken for water content determination. The soil in the cup is transferred to the dish containing the soil paste and mixed thoroughly after adding more water. The soil sample is again taken in the cup of the liquid limit device and the test is repeated. The liquid limit is the water content at which the soil is sufficiently fluid to flow when the device is given 25 blows. As it is difficult to get exactly 25 blows for the sample to flow, the test is conducted at different water contents so as to get blows in the range of 15 to 35. A plot is made between the water content as ordinate and the number of blows on log-scale as abscissa. The plot is approximately a straight line. The plot is known as flow curve. The liquid limit is obtained, from the plot, corresponding to 25 blows; the liquid limit is expressed as the nearest whole number. The apparatus used for liquid limit test is given in Figure 5.3
Figure 4.3 Liquid Limit Test
E. Direct shear test
This test is used to find out the cohesion (c) and the angle of internal friction (φ) of the soil, these are the soil shear strength parameters. Determination of shear strength parameters of a silty or sandy soil at known density and moisture content. The shear strength is one of the most important soil properties and it is required whenever any structure depends on the soil shearing resistance. The test is conducted by putting the soil at OMC and MDD inside the shear box which is made up of two independent
parts. A constant normal load (ς) is applied to obtain one value of c and φ. Horizontal load (shearing load) is increased at a constant
rate and is applied till the failure point is reached. This load when divided with the area gives the shear strength ‘τ’ for that particular normal load. The equation goes as follows:τ = c + σ*an (φ)
Fig 4.4 Direct shear test
V. RESULTS & DISCUSSIONS
A series of tests have been conducted in the laboratory for evaluation of different selected soil mixed With Polypropylene(PP) fiber. Detailed experimental procedure has been explained in chapter 5. Experimental results and their analyses are presented in this chapter as per testing program. All the tests have been conducted as per the relevant guidelines of IS codes, IRC and MORTH specifications. Results are presented considering and comparing the effects of various soil admixtures on CBR value of the selected soils in the following sequence:
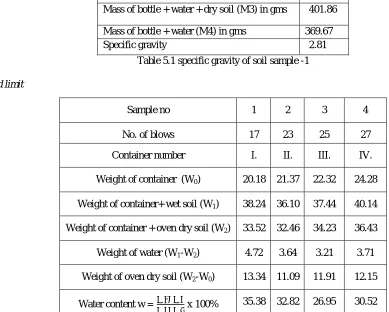
A. Specific Gravity
Sample number 1
Mass of empty bottle (M1) in gms 128.41
Mass of bottle + dry soil (M2) in gms 178.41
Mass of bottle + water + dry soil (M3) in gms 401.86
Mass of bottle + water (M4) in gms 369.67
[image:7.612.178.434.339.455.2]Specific gravity 2.81
Table 5.1 specific gravity of soil sample -1
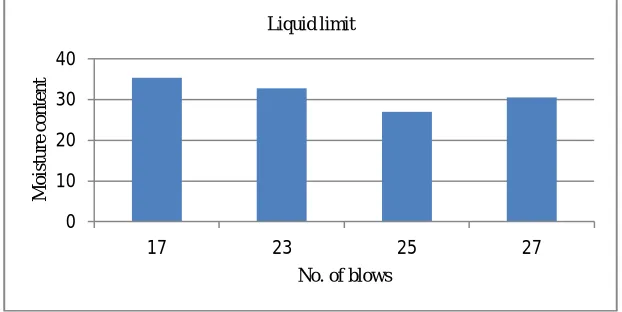
B. Liquid limit
Sample no 1 2 3 4
No. of blows 17 23 25 27
Container number I. II. III. IV.
Weight of container (W0) 20.18 21.37 22.32 24.28
Weight of container+ wet soil (W1) 38.24 36.10 37.44 40.14
Weight of container + oven dry soil (W2) 33.52 32.46 34.23 36.43
Weight of water (W1-W2) 4.72 3.64 3.21 3.71
Weight of oven dry soil (W2-W0) 13.34 11.09 11.91 12.15
Water content w= x 100% 35.38 32.82 26.95 30.52
[image:7.612.83.472.392.704.2]Fig.5.3 liquid limit of soil sample -1 Liquid limit as obtained from graph = 26.95
C. Direct Shear Test
Volume of shear box 90 cm3
Maximum dry density of soil 1.91 gm/cc
Optimum moisture content of soil 12.6 %
Weight of the soil to be filled in the shear box 1.91x90 = 171.9 gm
Weight of water to be added (12.6/100) x171.9 = 21.66g
Sample no
Normal stress(kg/cm2)
Proving ring reading
Shear load (N) Shear load(kg)
Shear
stress(kg/cm2)
1 0.5 78 300.50 30.40 0.86
2 1 122 468.64 47.82 1.34
3 1.5 166 636.61 64.96 1.82
[image:8.612.122.457.533.729.2]4 2 209 800.95 81.73 2.29
Table 6.12 Shear strength of soil reinforced with 0.20% PP fiber
0 10 20 30 40
17 23 25 27
M
o
is
tur
e
co
nt
ent
No. of blows Liquid limit
0 0.5 1 1.5 2 2.5
0 0.5 1 1.5 2
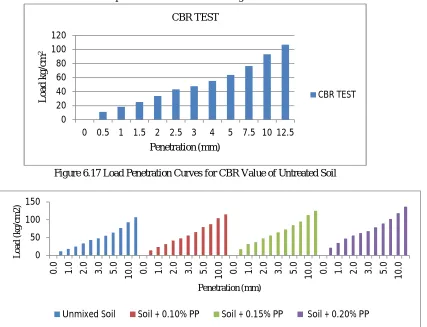
D. Result of CBR Value
[image:9.612.111.538.113.440.2]The CBR Value of selected soils and mixing with polypropylene (PP) fiber separately in varying proportions from 0% to 0.20% are determined. Figure 6.7 to 6.14 shows the load penetration curves for obtaining CBR values of various soil mixes.
Figure 6.17 Load Penetration Curves for CBR Value of Untreated Soil
Figure 6.18 Load Penetration Curves for CBR Value of Soil sample -1 reinforced with varying % of PP fiber
V. CONCLUSION AND FUTURE WORK
A. The selected soils belong to ML (silts of low plasticity) and SM (silty sand) types of soils.
B. The sand content in the ML and SM soils is found to be 26.5% and 73.5% respectively. The PI of ML soil is 3.36 and SM soil is non-plastic.
C. With the addition of SCBA in ML type soil the liquid limit and plasticity index decreases but on addition of RHA liquid limit increases and plasticity index decreases.
D. With addition of SCBA and RHA liquid limit of SM type soil increases but plasticity index cannot be determined because soil is a non-plastic soil.
E. The MDD of selected soils decreases and OMC of the soils increases with the addition of SCBA as well as RHA.
F. The addition of SCBA and RHA causes more reduction in MDD of ML type soil than SM type soil.
G. The addition of SCBA and RHA causes increase in OMC of the selected soil. OMC of ML type soil increases more when SCBA is added but when RHA is added OMC of SM type soil increases more.
H. CBR value of both soils increased with increasing proportion of and SCBA and RHA in the soil. The increase in CBR with same proportion of admixtures is more in case of SCBA than RHA.
I. The results of the study shows that waste materials both SCBA and RHA are suitable for enhancing properties of the soils that are generally available in Haryana which also decrease the environmental pollution causes by these two.
J. Recommendations for Further Research
1) The study can be carried out using other additives such as cement, fibers, bagasse ash and recron fiber etc.
0 20 40 60 80 100 120
0 0.5 1 1.5 2 2.5 3 4 5 7.5 10 12.5
L o a d kg/ cm 2 Penetration (mm) CBR TEST CBR TEST 0 50 100 150 0
.0 1.0 2.0 3.0 5.0
1
0
.0 0.0 1.0 2.0 3.0 5.0
1
0
.0 0.0 1.0 2.0 3.0 5.0
1
0
.0 0.0 1.0 2.0 3.0 5.0
1 0 .0 L o ad (kg /c m 2) Penetration (mm)
2) The study can be carried out using additives separately. It can be conducted on lime- rice husk ash mix, lime- fly ash mix, cement-rice husk ash mix etc.
3) The present study has been carried on soils from plain terrain. The same study can be conducted on soils from hilly terrain.
4) The study is carried out through proctor compaction and CBR tests. It can be extended with tests such as unconfined compressive tests and tri-axial tests.
5) The study is carried out OMC. It can be extended with tests by increasing more water than OMC like 2% water + OMC, 4% water + OMC etc.
6) The study can be conducted by adding different varying dose rate of SCBA and RHA i.e. 15%, 20, 25% etc.
REFERENCE
[1] Arora K.R. (2008), Soil Mechanics and Foundation Engineering, Standard Publishers Distributers, New Delhi, Seventh Edition.
[2] Alavéz-Ramírez, R., Montes-García, P., Martínez-Reyes, J., Altamirano-Juárez, D. C., Gochi-Ponce, Y. (2012). The use of sugarcane bagasse ash and lime to
improve the durability and mechanical properties of compacted soil blocks
[3] Khanna S.K. & Justo C.E. (2011), “Highways Engineering,” Published by Nem Chand & Bros, Roorkee.
[4] O’ Flaherty C.A. (1988), “Highways,” Third Edition Vol.2 “Highway Engineering” Edward Arnold, London.
[5] Martin Rogers (2003), “Highways Engineering,” Published by Blackwell Publishing Ltd
[6] IS: 1498-1970, “Classification and Identification of Soils for General Engineering Purposes”
[7] IS 2720: Part 3: 1980 Methods of Test for Soils (Determination of Specific Gravity)
[8] IS 2720: Part 4: 1985 Methods of Test for Soils (Grain Size Analysis)
[9] IS 2720: Part 5: 1985 Methods of Test for Soils (Determination of Liquid and Plastic Limit)
[10] IS 2720: Part 7: 1980 Methods of Test for Soils (Determination of Water Content-Dry Density Relation Using Light Compaction)
[11] IS 2720: Part 8: 1983 Methods of Test for Soils (Determination of Water Content-Dry Density Relation Using Heavy Compaction)
[12] IS 2720: Part 16: 1987 Methods of Test for Soils (Laboratory Determination of CBR)