Air Quality Index Class prediction using Data
Mining Techniques
Shaheen Usmani1, Amit K. Manjhvar2
1, 2
Department of CSE & IT, Madhav Institute of Technology & Science, Gwalior (M.P), India
Abstract: India, Being a developing country focuses on industrial and personal development. An increasing number of industries and vehicles produces various harmful chemicals as their byproducts. Nowadays the fresh air of the environment is getting polluted due to the generation of various harmful particles, biological molecules, and other poisonous elements.Air pollution can be determined by the organisations with using Index based parameter of Air Quality.Index holds several parameters for poisionous and harmful elements contains in apolluted air. In this research work, the main focus is on scrutiny of air pollution data of delhi by using data mining techniques and also build an efficient model for class wise prediction of air pollution data.
Keywords: Data Mining, Support Vector Machine, Generalized Linear Model (GLM), Recursive Partitioning and regression tree (RPART), Air pollution.
I. INTRODUCTION
In India the advancement in the field of industrialization and urbanization is very rapidly and the level of air pollution is been increasing to high level. Air pollution can be defined as existence or initiation of a liquid, solid, and gases in the environment which have noxious effects on human health’s and animals and environment. Two types of sources responsible for air pollution namely are natural sources and and different types of human activities.
However, mostly air pollutants are generated due to human activities like fossil fuels, coal, and oil, the release of noxious gases and materials from industeries and vehicles. Such harmful substances are carbon dioxide, nitrogen dioxides, carbon monoxide, Sulphur oxide, solid particles, benzene.
Currently supervising and scrutinizing air quality level is a very crucial issue to have a good and healthful life, and it also very important task.
By applying data mining techniques air quality level can be analyzed, so that apt actions can be taken for reduction of air pollution. And Data mining can be used for air pollution prediction of AQI levels and also for forecasting of AQI. AQI is a “Air Quality index”, it holds a numerical value which shows the level of pollution in regions or area.
Data mining is an approach of excerpting essential knowledge from very huge amount of data set. The main purpose behind the Data mining methods is to mine the information data from a large collection of data and change it into an explainable framework for additional use. Data mining can be used for Prediction, forecasting, Classification and Optimization and for generating frequent patterns set.
II. LITERATURE REVIEW
In 2017 Ranjana Waman Gore et.al., proposed an approach in which Naïve Bayes and J48 classification algorithm are used for analyzing the air quality levels. The accuracy of dataset by using Naïve Bayes was 86.66% and the accuracy with J48 decision tree algorithm was 91.99%. And author also justify that J48 algorithm gives more accurate results than Naïve Bayes algorithm[1]. In 2018 Dr. Sandhya P proposed a method in which author aim is to predict the PM2.5 by using random forest, Naïve Bayes, and decision tree algorithm[2].
In 2018 Bonny Paulose et.al., proposed mainly focused on analysis of air quality of Delhi and also find the reason behind the pollutants that cause air pollution by using K-means clustering algorithm. And the author showed that AnandVihar, RkPuramand, Punjabi Bagh are one of the mostly polluted regions[3].
III. RESEARCH METHODOLOGY
In this research paper three classifiers are used for analyzing and predicting the air quality levels. Figure 2. Shows the proposed methodology of research work.
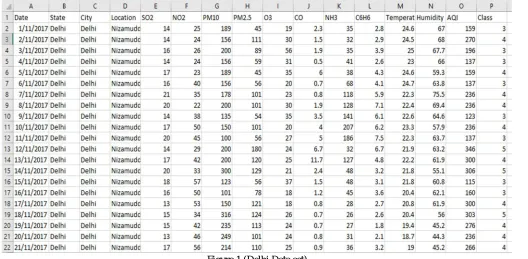
A. Dataset
The data is collected from Central Pollution Control Board (CPCB) and data.gov.in. This dataset contains the attributes are Sulphur dioxide (SO2), Nitrogen dioxide (NO2), Particulate Matter (PM10 and PM2.5), Ozone (O3), Carbon monoxide (CO), Ammonia (NH3),
Benzene(C6H6), Temperature and Humidity. From these attributes AQI value is calculated. Air quality Index can be calculated as
The equation for calculating the sub-index (I) for a contaminant concentration (Cc) I = [(Ih-Il)/(Bh-Blow)] (Cc-Blow) +Il
Where,
Bh ->Breaking point concentration larger or equal to given concentration Blow ->Breaking point concentration lesser or equal to given concentration Ih -> AQI value according to Bh
Il -> AQI value according to Blow Cc -> Contaminant concentration
AQI= Max of sub index (SO2, NO2, PM10, PM2.5, O3, CO, NH3, C6H6)
Figure.1 (Delhi Data set)
After that dataset is divided into 5 classes according to the range of AQI.
[image:2.612.49.577.301.560.2]IV. PROPOSED METHODOLOGY
Figure.2 ( Workflow of Proposed Methodology)
1) Data Collection: Raw Data generated every year contains lots of information about the air pollution, in this work data of few areas of delhi are gathered.
2) Data Preprocessing: This step makes the data ready to be processed. Processes include handling of noisy values, removal of redundant values. Selection of proper attributes, etc.
3) Data Splitting: For training of the model certain amount of data is required.similarly for testing and validation the remaining amount of data is provided. Data Splitting includes the ratio in which training data and testing data is separated.
4) Classification: Classification is the process of classifying data into class labels. These labels are generated on the basis of parameters[6].
5) Prediction: Predictive approaches are applied to determine the valid functions on the basis of their continuity[6]. The classification and predictive approaches tested for air pollution data are as follows:
a) RPART: RPART is a “Recursive Partitioning and Regression Tree”. The RPART approach classifies the data on regression models. It includes 2 step procedure, the output can be depicted as a binary tree.
b) Generalized Linear Model:Generalised linear model, applicable to the data contains numerical as well as the continuous target variable. The approach computes the response of the explanatory variable by modeling a linear function along with the error term associations.
V. EXPERIMENT
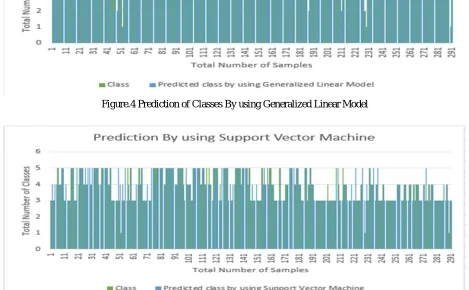
Figure no. 3,4 and 5 shows the prediction of class on the basis of SO2, NO2, PM10, PM2.5, O3, CO, C6H6, NH3, or AQI and
Temperature and humidity by using the Recursive Partitioninng & Regression Tree (RPART), Support Vector Machine and Generalized Linear model.
[image:4.612.69.546.110.769.2]Figure.3 Prediction of Classes By Using Recursive Partitioning & Regression Tree
[image:4.612.106.549.155.289.2]Figure.4 Prediction of Classes By using Generalized Linear Model
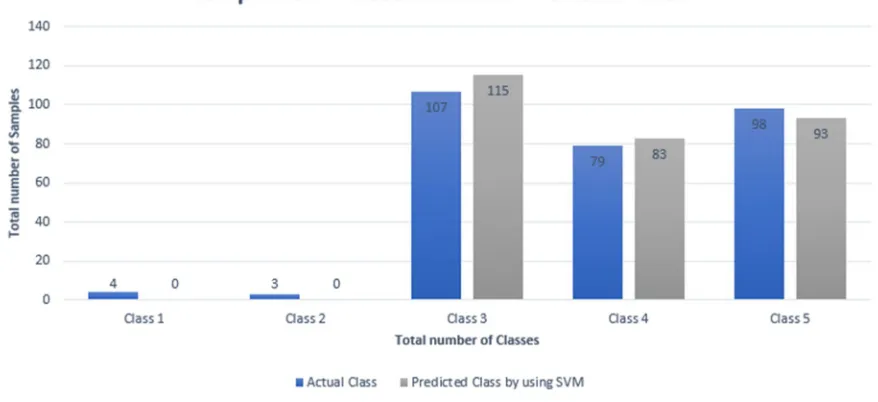
[image:4.612.71.540.405.695.2]Figure no. 6, 7, 8 describes the comparison among actual and predicted class by using above described three classification algorithms.
[image:5.612.94.513.117.271.2]Figure. 6 Comparison between Actual & Predicted Class using Recursive Partitioning & Recursive Partitioning
Figure.7 Comparison between actual and Predicted classes by using Generalized Linear Model
[image:5.612.91.523.320.462.2] [image:5.612.87.526.510.711.2]VI. RESULTS
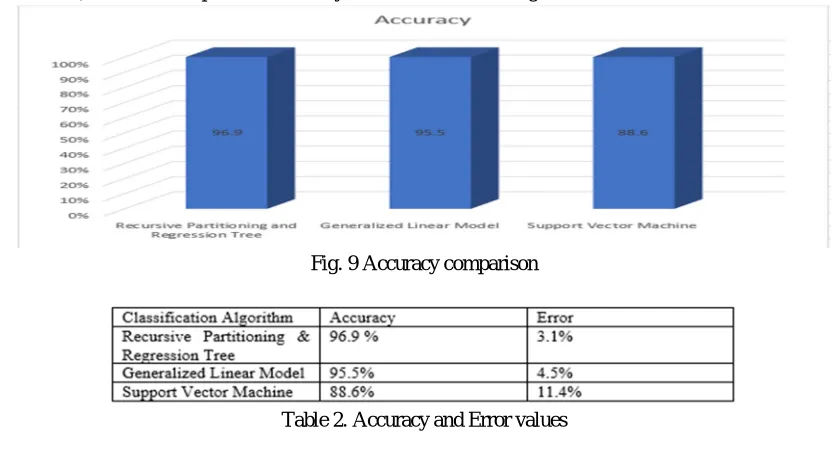
Figure number 9 depicts the accuracy of Recursive Partitioning & Regression Tree, Support Vector Machine and Generalized Linear Model classifier, and table 2 depicts the accuracy and error values among these classifiers.
Fig. 9 Accuracy comparison
Table 2. Accuracy and Error values
VII. FUTURE WORK
The accuracy of this model can be more enhanced or increased by using existing optimization techniques by slight parameters tuning or feature selection algorithms and by using machine learning approaches. These classifiers can also give more accurate results on India air pollution data set.
VIII. CONCLUSION
Now-a-days air pollution is increasing very rapidly in India and it is very harmful to human beings and animals also for our environment. That’s why analysis of air pollution is necessary. In this research work three classifiers are used namely are Recursive partitioning & Regression Tree (RPART), Generalized Linear model and Support Vector machine. The accuracy of Recursive Partitioning& Regression Tree is 96.9% and error rate is 3.1%, and the accuracy of Generalized Linear model and Support vector machine are 95.5% and 88.6%. Hence this study shows that Recursive partitioning & regression tree is more accurate in comparison of other two classifier for prediction of class label according to the values of SO2, NO2, PM10, PM2.5, O3, CO, C6H6, NH3, AQI.
REFERENCES
[1] R. W. Gore and D. S. Deshpande, "An approach for classification of health risks based on air quality levels," 2017 1st International Conference on Intelligent Systems and Information Management (ICISIM), Aurangabad, 2017, pp. 58-61.
[2] Sandhya, P. (2018). Ensemble learning on forecasting fine grained pollutant levels in air using random forest, naive bayes, decision tree algorithms. International Journal of Civil Engineering and Technology. 9. 303-312.
[3] Paulose, Bonny & Sabitha, Sai & Punhani, Ritu & Sahani, Ishaan. (2018). Identification of Regions and Probable Health Risks Due to Air Pollution Using K-Mean Clustering Techniques. 1-6. 10.1109/CIACT.2018.8480232.
[4] Ranjana Waman Gore, Deepa S. Deshpande, “Air Data Analysis for Predicting Health Risks”, IJCSN - International Journal of Computer Science and Network, Volume 7, Issue 1, January 2018.
[5] W. Wang, W. Shen, B. Chen, R. Zhu and Y. Sun, "Air Quality Index Forecasting Based on SVM and Moments," 2018 5th International Conference on Systems and Informatics (ICSAI), Nanjing, 2018, pp. 851-855.
[6] Aditya C R, Chandana R Deshmukh, Nayana D K, Praveen Gandhi Vidyavastu"Detection and Prediction of Air Pollution using Machine Learning Models", International Journal of Engineering Trends and Technology (IJETT), V59(4),204-207 May 2018. ISSN:2231-5381. www.ijettjournal.org. published by seventh sense research group.
[7] Kaur, Gaganjot & Gao, Jerry & Chiao, Sen & Lu, Shengqiang & Xie, Gang. (2018). Air Quality Prediction: Big Data and Machine Learning Approaches. International Journal of Environmental Science and Development. 9. 8-16. 10.18178/ijesd.2018.9.1.1066.
[8] Rubal & Kumar, Dinesh. (2018). Evolving Differential evolution method with random forest for prediction of Air Pollution. Procedia Computer Science. 132. 824-833. 10.1016/j.procs.2018.05.094.