An Approach to Identify Bike Sharing Segments
using Clustering Methodology
Rahul Singh
M. Tech Student, Department of Civil Engineering, Maulana Azad National Institute of Technology, Bhopal, India
Abstract: Station-based bike sharing is an upcoming trend in mobility, which has been spreading since 2015. Unlike the more
scientifically explored car sharing, the usage patterns and behaviors of bike sharing customers are yet to be analyzed. This presumably discovers better ways to attract customers as well as adaptions of the business model in order to increase bike utilization and therefore the profit of the bike providers. As most of the customer’s journey, from registration to bike reservation and the ride itself, is digitally traceable, large datasets are available allowing for understanding of customers' needs and motivations. Based on these datasets of an bike provider operating in a Bhopal city we propose a customer clustering that identifies four different customer segments, which enables multiple conclusions to be drawn for business development and improving the problem-solution fit of the bike sharing model.
Index Terms: clustering, customer segments, business model, bike sharing.
I.INTRODUCTION
Vehicle sharing concepts are increasingly spreading in India and around the world, providing on-demand mobility for customers while tackling the problem of crowded streets and lacking parking spots in metropolitan areas. The main idea of these business models is the simplicity of sharing individual vehicles with other customers in order to save costs and increase flexibility. Station based bike sharing is a recent variation of this idea and can already be found in multiple big Indian cities. The advantages of vehicle sharing are that it is supposed to reduce air and noise pollution in urban environments. The station based bike sharing services analyzed in this paper are characterized by providing their service in a mobile app and offering the flexibility to pick up and leave bike in any publicly accessible location in the respective business area. The opposite of station based would be a free-floating model. The usage costs of the service consist of price per minute or price per kilometer, whichever is cheaper, as well as a reduced price per minute for parking. The expenses per day are limited by a fixed cost restraint.
For our research we received trip and customer information from one bike-sharing provider based in Bhopal. Apart from the costs per ride, further information was provided covering details on reservation and usage of the bike as well as anonymized customer data including gender and age. According to Kotler and Armstrong [7], there are four major segmentation variables for consumer markets: geographic, demographic, psychographic and behavioral. Based on the available data, we will analyze which variables are best suited for customer segmentation in the bike sharing business using clustering algorithms. Therefore, the specific research question is: RQ How can bike sharing customers be segmented?
To approach this question, three further sub-questions were defined: RQ 1 Which data workflow is necessary for effective clustering? RQ 2 Which customer segments can be derived from clustering? RQ 3 How can the customer profiles be used for business development?
II.RELATEDWORK
III.CLUSTERINGMETHODS
Both customer segmentation and clustering aim to create separate groups from a set of objects, such that the variance within a group is minimal and the variance between groups is maximal [13]. The clustering-based customer segmentation approach based on Sarstedt’s and Mooi’s suggestions requires selecting a suitable clustering algorithm, preparing the data and visually investigating the data in order to determine the clustering parameters [14].
A.Hierarchical Clustering
Hierarchical clustering is one of the main clustering techniques used in data analysis. It builds on a binary tree of the data that successively merges similar groups of data points. Therefore, a measure of similarity between objects has to be determined. In our study, we use the Euclidian distance measure. There are two types of hierarchical clustering strategies:
1) Agglomerative Clustering (Bottom-Up): Clusters are sequentially formed from objects. At first, each object represents an individual cluster. According to their similarities the clusters are then merged. The two clusters closest in their similarity are iteratively merged until all of the data is contained in a single cluster. In this case, the hierarchy of clusters is established from the bottom up (Fig. 1).
2) Divisive Clustering (Top-Down): First, all objects are merged into a single cluster. In the next step, the single cluster is recursively split up, until each object represents an individual cluster (Fig. 1).
[image:2.612.138.479.331.502.2]If a cluster is on a higher level of the hierarchy, it always encloses all clusters from a lower level. This applies to both agglomerative and divisive clustering, as we can see in Fig. 1. Hence, there is no possibility of reassigning an object to another cluster, if the object is already assigned to a certain cluster [14].
Fig. 1: Agglomerative and divisive clustering (adapted from [14])
B.Partitioning Clustering
Another clustering method is partitioning clustering. There is a broad spectrum of different procedures, but the most widely used is the k-means algorithm [15]. Compared to the hierarchical clustering, the k-means method follows a different approach. It uses the within-cluster variation to form homogeneous clusters. The clustering process starts with objects that are randomly assigned to a pre-determined number of clusters, and then are successively reassigned to minimize the within-cluster variation. The affiliation of objects to clusters can change during the clustering process and is therefore non-hierarchical.
C.Chosen Clustering Approach
Hierarchical clustering has the advantage of not having to predetermine a number of clusters. It rather provides guidance for choosing a reasonable number of clusters for other clustering algorithms. However, hierarchical clustering is not suitable for large datasets due to performance constraints. Partitioning clustering is more performant than hierarchical approaches and can therefore also be used for larger datasets, but requires a fixed number of clusters as input.
IV.DATAWORKFLOW
A.Data Preparation and Tool
[image:3.612.215.372.241.442.2]For effectiveness and efficiency in data analysis one should follow a structured workflow for data preparation. This ensures the data quality by reducing mistakes and furthermore enabling replicability. Fig. 2 shows the necessary structure of a data workflow [14]. The data workflow covers entering, cleaning, describing and transforming the data. For describing the bike usage, a dataset covering one season from April 22, 2018 to October 20, 2018 was provided by the considered bike sharing operator [4]. A further dataset contains information on gender and age of each customer. Every entry in the first dataset includes information about a trip or a reservation. The data is presented in the form of Excel spreadsheets, with one file per month. Given the large size of about 53,000 entries in total, a cleaning and further processing of the data in Excel was not feasible. The software KNIME [16] proved to be suitable for the intended preparation and analysis steps. It is freely available and offers manifold functions for gathering, cleaning and transforming data. A script performing all steps was created, starting with loading and joining the datasets and finishing with an output containing all results of the entire analysis.
[image:3.612.64.552.491.729.2]Fig. 2: Data workflow (adapted from [14])
Table 1: Variables after data preparation
Segmentation categories Variables from
customer dataset Variables from ride dataset Constructed variables
Demographic Age (in years)
Gender (m/f) N/A N/A
Geographic N/A
Start longitude
Start latitude
Start zip code
End longitude
End latitude
End zip code
Behavioral N/A
Usage time (in min) Distance driven (in m) Park time (in min) Cost per ride (in Euro)
Free minutes used
Time between rides (in h) Day of week
Total revenue per customer (in Euro)
The first step after loading the data is to clean the dataset. This is necessary to remove faulty records, e.g. with missing coordinates, unrealistically high average speed values or a deviation between stated and computed duration. These may be caused, for example, by the absence of a GPS signal or failed or duplicated transmissions of information to the server.
Afterwards, the description of data follows. This step makes use of different graphs, tables and statistics to better understand the data. Detailed results of the description step follow in the next chapter.
A transformation of the data constitutes the next step of the data workflow. Two types of transformation are distinguished: variable specification (modify or create variables) and scale transformation (changing variable values for comparability with other variables). Variable specification includes the computation of additional fields that are needed for the analyses like total trip costs per customer and time between rides, meaning the time passing until a customer uses an bike again or until the end of the season, whichever occurs first. Scale transformation in form of normalization is necessary for the clustering and is described later on.
B.Visual Investigation
The visual investigation of data is essential for an initial analysis and the development of a cluster analysis. For this, we use the Business Intelligence and Analytics software Tableau [17]. First, we need to identify which characteristics should be depicted in the customer segmentation. This influences the choice of clustering variables.
The variables listed in Table 1 are ready for use after the data preparation and could be considered in further cluster analysis. Psychological data could not be derived from the given dataset and is therefore not available for this analysis.
The number and choice of variables for a clustering analysis can vary. Based on the variables above, one can segment customers using only variables of a single category or using a mixture of categories, e.g. time between rides, age and distance driven. The most revealing variables defining a ride are distance driven and usage time; therefore we concentrate on these to characterize the ride behavior.
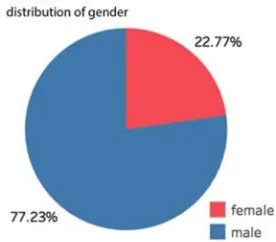
[image:4.612.234.372.398.519.2]Fig. 3 shows that more than three quarters of the bike-sharing customers are male, so interesting gender-related differences might exist to target in segmentation.
Fig. 3: Gender of the bike-sharing customers
[image:4.612.206.441.585.715.2]However, the distribution of ride lengths in meter per gender displayed in Fig. 4 proves that gender hardly has any influence on usage patterns, which is why we excluded this variable from further considerations.
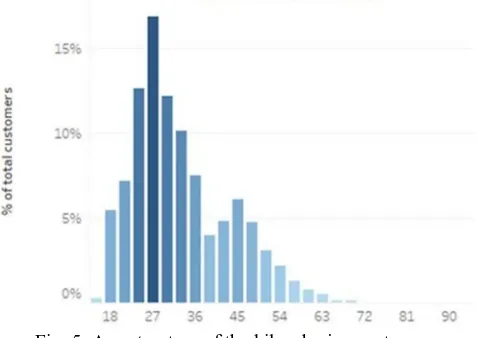
A more decisive variable is age, as most customers are in their late twenties, but there is also a significant peak of customers between 45 and 50 years old, who tend to cover longer distances in a single ride and could be addressed in a different manner. The age structure of the bike-sharing customers can be seen in Fig. 5.
Fig. 5: Age structure of the bike-sharing customers
The analysis of geographic differences in rental behavior showed a high concentration around the city center. Further examinations of the geographic distributions could target a potential correlation between public transport stations and bike rentals, but are beyond the scope of this paper.
V.DATA CLUSTERING
A. Determination Of Cluster Variables
To define differentiated customer clusters, the choice of clustering variables is of utmost importance. For the optimal selection of cluster variables, multiple requirements have to be considered. We followed the guidelines of Sarstedt and Mooi [14] for validation of the variables.
1) Are the variables sufficient to differentiate between the segments? Are the variables adequate to form unique clusters?: Our main goal is to segment user groups, understand their background and tasks and improve their value for the bike-sharing provider. Only some characteristics are useful to identify relevant differences between the customers. The ride data contains a number of date and time columns indicating a start and stop time for the reservations and rides. To segment the customers by their value, it is less important to know when they are driving, but rather how frequently they are driving. Therefore, the time between rides is used as a clustering variable. The way of addressing a customer may vary depending on his age, hence age was included as a variable for clustering. To understand the customer backgrounds and their tasks, not only the ride frequency is relevant, but also the average distance driven or the respective usage time. In order to fulfill the goals of a profit-oriented company, the revenue per customer is an important metric for differentiating the customer segments and is included in the clustering. With the five clustering variables time between rides, age, distance driven, usage time and revenue per customer, both behavioral and demographic segmentation categories are covered. Next, it has to be verified that the chosen cluster variables are compliant with further clustering requirements.
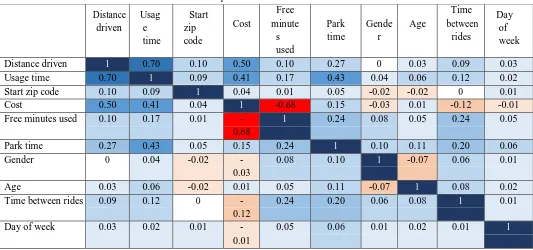
2) Is there a strong correlation between the clustering variables: If two or more clustering variables have a strong correlation, they distort the clustering as they exhibit a higher emphasis than other factors. Strong correlation is defined by a correlation coefficient larger than 0.9. To calculate this coefficient, we make use of Spearman’s rho correlation. This correlation coefficient for variables is measured on an ordinal scale and reflects the intensity of the monotone relationship between two variables. The correlation matrix in Table 2 shows a relatively high correlation between distance driven and usage time, so that only distance driven was included in the clustering. Between the other chosen variables, no critical correlation can be observed.
4) Is the underlying data basis of high quality?: Data quality is ensured by the data preparation workflow, which was introduced before.
Table 2: Spearman’s rho correlation matrix
Distance driven
Usag e time
Start zip code
Cost
Free minute
s used
Park time
Gende r
Age
Time between
rides
Day of week
Distance driven 1 0.70 0.10 0.50 0.10 0.27 0 0.03 0.09 0.03
Usage time 0.70 1 0.09 0.41 0.17 0.43 0.04 0.06 0.12 0.02
Start zip code 0.10 0.09 1 0.04 0.01 0.05 -0.02 -0.02 0 0.01
Cost 0.50 0.41 0.04 1 -0.68 0.15 -0.03 0.01 -0.12 -0.01
Free minutes used 0.10 0.17 0.01
-0.68
1 0.24 0.08 0.05 0.24 0.05
Park time 0.27 0.43 0.05 0.15 0.24 1 0.10 0.11 0.20 0.06
Gender 0 0.04 -0.02
-0.03
0.08 0.10 1 -0.07 0.06 0.01
Age 0.03 0.06 -0.02 0.01 0.05 0.11 -0.07 1 0.08 0.02
Time between rides 0.09 0.12 0
-0.12
0.24 0.20 0.06 0.08 1 0.01
Day of week 0.03 0.02 0.01
-0.01
0.05 0.06 0.01 0.02 0.01 1
B. Determination Of The Quantity Of Clusters
To define the number of clusters, hierarchical clustering can provide guidance. The dendrogram resulting from this clustering method gives visual information on the distances, at which clusters or objects are combined. The greater the distance is until two clusters are combined, the greater the differences between these clusters are. To obtain distinct clusters, a solution is derived from the dendrogram in which an additional combination of clusters or objects would only occur at a greatly increased distance [14]. The dendrogram (Fig. 6) used to determine the quantity of clusters is created applying a hierarchical clustering algorithm with Euclidian distance measures and average linkage. Due to set size restrictions of the expensive hierarchical clustering, we randomly drew a set of 100 customers from the filtered dataset.
Fig. 6: Dendrogram
[image:6.612.144.528.481.647.2]C. Clustering
[image:7.612.119.485.255.366.2]Before conducting the clustering itself, some preliminary preparations have to be done. The ride data is grouped by the customers’ unique identifier. The chosen aggregation methods display both the riding behavior on average and in total as well as customer demographics. These include age, most frequent day of use, total created revenue, total number of rides, average distance driven and the average time between rides. As the cluster variables originate from different categories and differ in their scale, they could distort the analysis without normalization. The therefore required Normalizer node in KNIME converts all values into double values between 0 and 1. After clustering, the values are denormalized using the normalization model from this Normalizer node. The next step is the clustering itself. For this purpose, a k- means node is configured to create four clusters according to the distance-based decision rule described in the previous section. Inputs are the normalized customer data and the clustering variables age, time between rides, average ride distance and revenue per customer. In preparation for the visualization in a scatterplot, colors are assigned to the clusters. The 3D scatterplot (Fig. 7) displays value characteristics of individual customers in a three-dimensional Cartesian coordinate system, allowing to depict three of the four clustering variables at the same time. As the values are color-coded by clusters, we can cover another dimension, but to visualize all clustering dimensions, two scatterplots are necessary.
Fig. 7: Scatterplots of the clustering
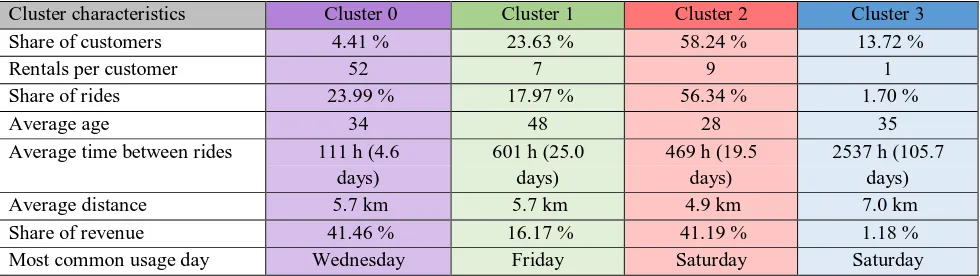
Table 3: Characteristics of the clusters
Cluster characteristics Cluster 0 Cluster 1 Cluster 2 Cluster 3
Share of customers 4.41 % 23.63 % 58.24 % 13.72 %
Rentals per customer 52 7 9 1
Share of rides 23.99 % 17.97 % 56.34 % 1.70 %
Average age 34 48 28 35
Average time between rides 111 h (4.6 days)
601 h (25.0 days)
469 h (19.5 days)
2537 h (105.7 days)
Average distance 5.7 km 5.7 km 4.9 km 7.0 km
Share of revenue 41.46 % 16.17 % 41.19 % 1.18 %
Most common usage day Wednesday Friday Saturday Saturday
A first visual investigation of Cluster 0 shows that it is a rather small cluster with a large age span, low average distances, but very frequent ride behavior creating high individual revenues. Cluster 1 and 2 are similar in average distance, frequency and revenue, but differ in the age of their members, as Cluster 1 contains customers around 40 and above, while Cluster 2 contains the younger drivers. The average distance covers low to high distances, but the members drive less frequently than the members of Cluster 0 and therefore generate less individual revenue. Cluster 3 has remarkably high times between rides and thus low individual revenues. The other factors, age and average distance driven, are scattered. For a detailed analysis of the clusters, the customers were grouped by the respective clusters. Here, the aggregation methods created both cluster summarizing as well as customer- profiling columns. The characteristics of each cluster and the customers within can be seen in Table 3. We introduce the following names for the clusters:
1) Cluster 0: Power Users
2) Cluster 1: Casual Users Generation X+ (Gen X+)
3) Cluster 2: Casual Users Generation Y (Gen Y)
[image:7.612.62.552.406.544.2]D. Validation
A similar clustering approach was conducted for another bike-sharing provider in a different German city with a comparable price and business model, which can be found at five out of six bike-sharing providers in Germany ([1], [3], [4], [5], [6]). The dataset covered one season with the same information on rides, but without the age of the customers. Therefore, only the three remaining clustering variables of time between rides, distance driven and revenue per customer were used for clustering. Abiding by the decision to use four clusters, the result was, similar to the cluster setup in this paper, one Power Users cluster, two Casual Users clusters and one One- time Users cluster. Due to the missing age of the customers, the separation of the Casual Users clusters was not age-based, but dependent on the number of rentals. To examine the universal validity and reproducibility of the previously described clustering, the two Casual Users clusters of the two setups were combined to form one. It could be seen that the percentages of the cluster distribution were very similar. This proves that the clustering and its outcome is representative for bike- sharing in major German cities using a similar business model.
VI.IMPACT FOR BUSINESS DEVELOPMENT
The Power Users are a very small, but highly active user group that tends to use the bike on weekdays, which suggests the conclusion that they use the sharing service for their travel to work or other appointments. The Casual Users are separated into two clusters, one containing younger members around 28 years old belonging to the generation Y, whereas the other one contains older customers around 48 years old, which we categorized as generation X+. Both customer segments use the bike presumably for leisure activities, as the rentals occur irregularly, but mostly on weekends. The One-Time Users only tried the sharing service once, leading to a particularly high average time between rides, however exhibiting a longer average distance than the other segments. We use the BCG- matrix [18] to analyze the current state and create a strategy for the considered bike-sharing company. The BCG-matrix (Fig. 8) consists of two axes displaying the share of annual revenue (x-axis) and the share of annual rides (y-axis) in order to assess the customer potential. The size of the bubbles in the matrix is dependent on the revenue of the segment.
Fig. 8: Customer segments transferred into a BCG-matrix
This 2x2 matrix contains four different fields:
1) Cash Cows: The Power Users are generating despite their small number of members more than 40% of the total revenue. For these profitable customers, no bigger investments are needed, but the aim is to keep them in this category and maximize the returns.
2) Stars: This field contains the Casual Users Gen Y. This segment has the largest share of annual rides, but also the most members. They are accountable for another 40% of the total revenue. The target should be to increase the rides per customer and consequently the share of revenue.
3) Poor Dogs: The Casual Users Gen X+ and the One-time Users are classified as Poor Dogs. These customers generate rather low total revenues. Although the Casual Users Gen X+ and Gen Y have few differences in their ride behavior, the Gen X+ segment has far fewer members and is therefore classified differently. In the case of One-time Users, the marginal annual revenue originates from a minimal number of annual rides. As only negligible growth of rides per customer is expected, this segment has a low priority for investments.
5) Product: The company offers an bike-sharing service mainly consisting of the bike themselves and the supporting app. To meet potential differences in taste, especially between Gen Y and Gen X+ users, the sharing operator could offer various bike models. Mobile phone cradles for the bike provide visibility of the current ride status and navigation possibilities, which might be particularly interesting for the non-Power-Users. Concerning the app, gamification approaches targeting the Casual Users and honoring the Power Users are possible. This could include for example the collection of achievements or points to reach different levels and unlock new functionalities like longer reservation times. If the sharing provider cooperates with local partners, even physical rewards like a free coffee for early-riders are possible.
6) Price: A possible differentiation in the price model is the introduction of a flat rate model for Power Users, which could even include public transportation to create an all- round-mobility-package and improve the flexibility and certainty of transportation. Other opportunities are discounts targeting different interests of the segments. Both Casual Users and One-Time Users are mainly driving on Friday and Saturday, so that special weekend-packages for upselling could attract them. Power Users, on the other hand, may be interested in reduced prices during rush hour, to promote the usage of bike-sharing for traveling to work.
7) Place: The location of the bike is only adaptable to a certain degree, as the basis of the considered sharing model is a station based system. A selective placement of bike is therefore only possible after service operations and will not be regarded in this paper. The main points of contact are the website and the app. In order to address Casual Users and increase convenience, the app could be integrated into mobility aggregator apps offering different transportation services. Other channels used are Facebook, Twitter and Instagram as well as mail, telephone and Skype, which are only staffed at certain times. To answer at least the basic questions of inexperienced users in a 24/7 manner, chatbots could be used for first level support and interactive reproduction of the FAQs.
8) Promotion: For this component, we developed promotional strategies for bidirectional communication between customer and provider, for the special case of customer retention and for the communication between customers. Depending on the customer segment affiliation of a user, differentiated content marketing is feasible. By publishing relevant and high-quality content, the sharing provider positions itself as an expert in its field. Potential content could be tips and tricks referring to the bike service sent per mail or via in-app notification to motivate further usage. For One-time Users, this could be basic instructions, for Casual Users routes worth trying on weekends and for Power Users tricks to deal with changing weather conditions or hints regarding current traffic situations. The addressees are more likely to identify with the company through this content and conceivably show higher commitment to the business in the long term [19]. A further possible service for Power Users is offering app notifications, when a bike near the current position of the user is available. Targeting Gen Y Users in particular, social media influencers can positively affect the image of the sharing provider and link the usage of bike with a fashionable lifestyle. Derived from the BCG-matrix, the company has a high interest in keeping particularly the Gen Y and Power Users. When customers become less active, several factors can be considered to decide on retrieval measures. Based on the previous ride behavior, the derived customer value and ratings left after a ride, the probability of success and the necessary financial investments of such measures could be estimated. Possible actions are, for example, reduced prices during a certain time for Power Users in order to further encourage the habit of frequent usage. Casual Users could be enticed by granting free minutes, whereas One-Time Users should not be subject to additional investments. Another pillar of the communication strategy is the stimulation of communication between customers. This includes the creation of incentives for promotion of the service among friends as well as opportunities to share individual experiences, pictures and routes driven.
VII.CONCLUSION AND FUTURE WORK
data, the initial segmentation can be expanded to a multi-factor customer classification as suggested by Zu, Wu and Wang [21] that may result in better predictions of customer loyalty and value.
In addition to the customer-centric approach, a geographic analysis regarding the spatial distribution of rentals, also in the context of the surrounding infrastructure, might reveal further information on the demand per area and potential partners of the sharing providers. Possible results include the suggestion of changes to the business area and strategies for the acquisition of new customers.
REFERENCES
[1] Emmy Mobility Concepts GmbH: Emmy Sharing, available at: https://emmy-sharing.de, accessed: 2018-02-06.
[2] Coup Mobility GmbH: COUP, available at: https://joincoup.com/de/berlin, accessed: 2018-02-06.
[3] Energieversorgung Oberhausen Aktiengesellschaft (evo): Evo Sharing, available at: https://www.evo-energie.de/start/, accessed: 2018-02-06.
[4] Stadtwerke Stuttgart GmbH: Stella Sharing, available at: https://stella- sharing.de/, accessed: 2018-02-06.
[5] Stadtwerke Düsseldorf AG: Eddy E-Roller Sharing, available at: https://www.swd-ag.de/privatkunden/strom/eddy-elektroroller-mieten-e- scooter-sharing/,
accessed: 2018-02-06.
[6] MVV Energie AG: MVV E-Roller, available at: https://www.mvv.de/energie/kundenservice/E-Roller/, accessed: 2018- 02-06.
[7] G. Armstrong; P. Kotler: Principles of Marketing, 14th edition, Pearson Education - Prentice Hall, Upper Saddle River, 2011.
[8] K. Bogenberger; J. Müller; S. Schmöller; S. Weikl.: Empirical analysis of free-floating carsharing usage: The Munich and Berlin case, Elsevier Ltd., Amsterdam, 2015.
[9] T. Greiser; D. Mattfeld; P. Vogel: Understanding Bike-Sharing Systems using Data Mining: Exploring Activity Patterns, Elsevier Ltd., Amsterdam, 2011.
[10] K. Bogenberger; S. Weikl: Relocation Strategies and Algorithms for free- floating Car Sharing Systems, Proceedings / 15th International IEEE Conference on
Intelligent Transportation Systems; Anchorage, Alaska, USA; September 16-19, 2012; p. 355-360.
[11] K. Bogenberger; S. Reiss: A Relocation Strategy for Munich’s Bike Sharing System: Combining an operator-based and a user-based Scheme, 19th EURO
Working Group on Transportation Meeting EWGT2016; Istanbul, Turkey; September 5-7 2016; p. 105-114.
[12] B. Agard; C. Morency; M. Trépanier: Typology of carsharing members, 90th Transportation Research Board, Washington, D.C., USA; January 23-27, 2011.
[13] S. Sarin: Market Segmentation and Targeting, in: Wiley International Encyclopedia of Marketing, Wiley-Blackwell, Hoboken, 2011.
[14] E. Mooi; M. Sarstedt: A Concise Guide to Market Research – The Process, Data, and Methods Using IBM SPSS Statistics, Springer-Verlag Berlin Heidelberg,
2014.
[15] A. K. Jain: Data clustering: 50 years beyond K-means, Pattern Recognition Letters 31, Elsevier Ltd., Amsterdam, 2010, p. 651-666.
[16] KNIME AG: KNIME – Open for innovation, available at: https://www.knime.com/, accessed: 2018-01-26.
[17] Tableau Software: Tableau, available at: https://www.tableau.com/, accessed: 2018-01-29.
[18] F. Billing; C. Schawel: Top 100 Management Tool, Gabler Verlag/Springer Fachmedien Wiesbaden GmbH, Wiesbaden, 2011; p. 32- 34.
[19] N. Barret; J. Pulizzi: “Get Content Get Customers” - Turn Prospects into Buyers with Content Marketing, McGraw-Hill Education, New York, 2009.
[20] A. Osterwalder et al.: Value Proposition Design: How to Create Products and Services Customers Want, Wiley-Blackwell, Hoboken, 2014.
![Fig. 1: Agglomerative and divisive clustering (adapted from [14])](https://thumb-us.123doks.com/thumbv2/123dok_us/1237915.649544/2.612.138.479.331.502/fig-agglomerative-divisive-clustering-adapted.webp)
![Fig. 2: Data workflow (adapted from [14])](https://thumb-us.123doks.com/thumbv2/123dok_us/1237915.649544/3.612.215.372.241.442/fig-data-workflow-adapted.webp)