Application of Total Quality Management (TQM)
Techniques in Village Development
Ajay shelke1, Pravin Chaudhari2
1
Mtech Construction Management Research Scholar, VJTI Mumbai 2
Assistant Professor, Civil & Environmental Engineering Department, VJTI Mumbai
Abstract: In India, most of the villages are undeveloped and lacks in basic facilities. The actual condition of facilities in the villages as well as required facilities needs to be studies and assessed. TQM is a management tool of decision making for successfully delivering quality products to the consumers by continuously improving. One of the tool in TQM i.e. Pareto analysis is used in this study to evaluate the factors and to decide factors that are crucial in the growth for the overall growth of the village. Ministry of urban development have introduced liveability index parameter for cities to rank them based on available facilities. Those liveability indices were used to survey two villages, one smart village and other undeveloped village. Using pareto analysis 5 principal facilities required by Bhandarwadi village (Undeveloped) were identified and compared with Hiware Bazar (Smart Village). With proper planning of available funds in Bhandarwadi village, principal facilities can be improved leading to improvement in physical liveablity parameter of the village.
Keywords: Liveability index, Pareto Analysis, smart villages
I. INTRODUCTION
Nowadays as per census 2011 India's 69% population living in rural part. Until now ministry of urban development have given liveability index to only cities but now there is requirement to develop rural India as a smart village. We need to focus more on villages. If we focus only on cities then in future we have to face many problems. Therefore, on the basis of liveability index of cities we have to give or we have to develop villages on the basis of liveability index. The last few decades have seen the world becoming more urbanised. With more than half of the world’s population living in urban areas in 2011 from about 30% in 1950. ‘Liveability’ is one key characteristic that attract a disproportionate amount of the globally-mobile resources (investors, innovators, entrepreneurs, and capital) that are recognised to make positive contributions towards economic growth, economic resilience, global political influence, world agenda-setting power, socio-cultural innovation. To attract more people towards village we have to develop them. Investors will only attract towards villages if they getting some special facilities in village. Livability index will do this work. Liveability is nothing but more qualitative construct representing a set of characteristics that relate to the attractiveness of an area and become a desirable place to live, work, invest, and conduct business. We cannot apply all parameters of cities to village; we have to do some minor changes in that. There can be a number of factors that affects the overall growth of the village as a smart village. Total Quality Management (TQM) which is a management tool of decision making for successfully delivering quality products to the consumers by continuously improving. One of the tool in TQM i.e. Pareto analysis is used in this study to evaluate the factors and to decide factors that are crucial in the growth for the overall growth of the village.
A. Tools and Techniques for Improvement
Over a last few years, 'Village development' in developing countries like India has become an integral part for overall development of nation. India contains a lot of undeveloped villages so there is a lack of development in the rural zones of India. The concept of smart village in the today’s life looks more valuable as there is a faster development of cities occurred which leading to formation of urban jungles, where the population ratio per km of land is way above the desired norms. A smart village is one which will automatically link local production with local procurement and local distribution. So that local business opportunities can be available to local village people.
Following are some development plans conducted in hiware bazar:
1) Watershed Management Plan
2) The Drought Prone Area Program
Smart villages are the need of the development for rural areas to have standard life style in village and technology will offer effective solution. Technological development already exists at the urban area and at the same time lack of modern technologies in rural area. Taking education, skill for development to villages can well guide the energies of the youth as a powerful tool for the nation, and at most the overall development of the country can be possible with the development of the villages only.
B. Case Study
[image:2.612.119.495.257.460.2]First of all we have to select village for our project. Hence we selected two villages one which is smart and another one which is under development or non-developed. So it will be easy to compare between them and again easy to give marks according to that. For this purpose a questionnaire survey of 16 villages were done and 1 village from those 16 villages were taken for actual survey. Actual survey was conducted in order to get an idea about the current situation of the village, facilities that are to be provided in the village for overall development. Bhandarwadi village Tal-Renapur, Dist-Latur was selected from that 16 villages and the smart village selected was Hiware bazaar. Then we have to compare those villages on same environmental condition, same available amenities, same cultural zone, under same economic zone, same seasons, same water availability. The Actual location of the Bhandarwadi village is shown in Figure 1 below.
Figure 1 Google map image of Bhandarwadi village, Tal-Renapur, Dist-Latur
The survey has been started with the permission of Sarpanch of village. For comparison purpose the smart village selected was village Hiware Bazar, Tal & Dist-Ahmednagar. The location of the village is shown below in figure 2.
Figure 2 Google map image of Hiware Bazar, Tal & Dist-Ahmednagar
C. Liveability Index
On the basis of survey, we will gather all data required to prepare livability index parameter. On the basis of information we can give ranking to villages and compare village. Also we can give some suggestions to the villagers to meet their qualities with livability index. Livability index of cities is already developed by government of India and available facilities in the city can be known based on these index. But livability index for villages is yet to be developed. After studying present situation of villages and requirement of smart villages, we will be able to suggest parameters for livability index of villages.The actual work is done step by step. Primary survey of various villages is done for comparison purpose.
D. Formulas For Calculation Of Liveability Index Parameters
According to the data obtained from survey liveability index was defined. 9 Physical parameters of liveability index were considered for the study, They are as follows.
1) Housing and Inclusiveness:
2) Public open spaces
3) Mixed Land Use and Compactness
4) Power Supply
5) Transportation and Mobility
6) Assured Water Supply
7) Waste Water Management
8) Solid Waste Management
9) Reduced Pollution
E. Gap Analysis
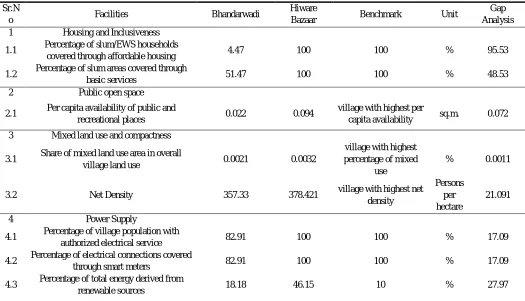
[image:3.612.45.570.427.728.2]The gap analysis was also conducted between the villages for those 9 physical parameters for liveability index. The gap analysis for various factors between two villages Hiware bazar and Bhandarwadi are given in Table 1 below. The benchmark used for the comparison was taken from Ministry of Urban development Government of India.
Table No 1 Gap analysis of Hiware bazar and Bhandarwadi Sr.N
o Facilities Bhandarwadi
Hiware
Bazaar Benchmark Unit
Gap Analysis
1 Housing and Inclusiveness
1.1 Percentage of slum/EWS households
covered through affordable housing 4.47 100 100 % 95.53
1.2 Percentage of slum areas covered through
basic services 51.47 100 100 % 48.53
2 Public open space
2.1 Per capita availability of public and
recreational places 0.022 0.094
village with highest per
capita availability sq.m. 0.072
3 Mixed land use and compactness
3.1 Share of mixed land use area in overall
village land use 0.0021 0.0032
village with highest percentage of mixed
use
% 0.0011
3.2 Net Density 357.33 378.421 village with highest net
density
Persons per hectare
21.091
4 Power Supply
4.1 Percentage of village population with
authorized electrical service 82.91 100 100 % 17.09
4.2 Percentage of electrical connections covered
through smart meters 82.91 100 100 % 17.09
4.3 Percentage of total energy derived from
4.4 Energy consumption per unit - street
lighting 60 57.16
village with lowest per unit consumption kwh per light installat ion 2.84 4.5
Total energy consumption per Capita
6.74 10.441 village with lowest per
capita consumption
kwh per capita
3.701
5 Transportation and Mobility
5.1 Geographical coverage of public transport 0.3 0.358 >=1
Road kms per
square km
0.058
5.2 Availability of public transport 8.57 6.43 >=0.6
Numbe r per 1000 person
-2.14
6 Assured Water Supply
6.1 Household level coverage of direct water
supply connections 56.84 100 100 % 43.16
6.2 Per capita supply of water 61.23 104.41 135 lpcd 43.18
6.3 Percentage of plots with rainwater
harvesting facility 0 0 100 % 0
7 Waste Water Mnagement
7.1 Coverage of Toilets 72.65 100 100 % 27.35
7.2 Coverage of sewerage network and septage 57.26 100 100 % 42.74
7.3 Collection efficiency of sewerage network 0 0 100 % 0
8 Solid Waste Management
8.1 Household level coverage of Municipal
solid waste collection 0 100 100 % 100
9 Reduced Pollution
9.1 Quality of water in public surface water
bodies 100 100 100 % 0
F. Pareto Analysis
Pareto Analysis is a tool in Total Quality Management (TQM). It is a statistical technique in decision-making used for the selection of a limited number of tasks that produce significant overall effect. It uses the Pareto Principle (also known as the 80/20 rule). Which assumes that the large majority of problems (80%) are determined by a few important causes (20%).
Here are steps to identifying the principal facilities one should focus on, using Pareto Analysis:
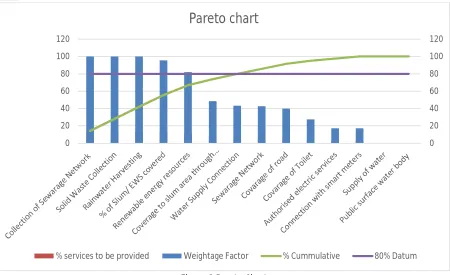
1) A bar chart with problems on the x-axis and count on the y-axis is prepared. Here the required facilities are enlisted on x axis and weightage factor on y axis. This weightage factors were taken from the gap analysis.
2) Bar chart is arranged in descending order of weightage factor so that required facilities with highest count came first.
3) Cumulative count for each cause is calculated and kept in descending order.
4) Cumulative count percentage for each facilities is calculated and placed in descending order.
5) The cumulative count percentage of each cause were plotted on the x-axis and points joined to form a curve.
Figure 3 Parato Chart
From the figure we can conclude that the principal required facilities for the village are 1) Provision of facility for collection of sewerage network.
2) Solid waste collection facility.
3) Rain water harvesting.
4) Coverage to the slum? EWS area
5) Use of renewable energy resources.
G. Cash flow for Bhandarwadi Village
In 2018 Bhandarwadi received Rs.7,54,446 from Government of India, Also Rs.1,59,600 nalpatti was received from villagers. Out of this amount Rs.4,74,854 was spent on development in education, Disabled, women empowerment, backward class, operator. Thus remaining amount for this village is Rs.4,39,192. Thus we can say than about Rs.4,39,192 amount remains in hands of sarpanch for each year. The funds which has not been utilized by the Sarpanch can use the funds for the development of facilities which are obtained above by Pareto analysis. Figure 4 shows the generation of cash flow in Bhandarwadi is shown below.
0 20 40 60 80 100 120
0 20 40 60 80 100 120
Pareto chart
[image:5.612.70.536.545.721.2]II. CONCLUSION
A. By the comparison of parameters between Bhandarwadi village and Hiware bazar by Pareto analysis, it was concluded that 5 principal parameters are required by Bhandarwadi village for the development as smart village.
B. Provision of facility for collection of sewerage network, Solid waste collection facility, Rain water harvesting, Coverage to the slum? EWS area, Use of renewable energy resources were the 5 parameters that was obtained through Pareto analysis.
C. Pareto analysis is a Total Quality Management (TQM) tool can used for finding principal parameters/ facilities that are to be required for a village for further development as smart village.
D. With proper planning of available funds in Bhandarwadi village (Undeveloped), principal facilities can be improved leading to improvement in physical liveablity parameter of the village.
REFERENCES
[1] Ministry of urban development, Government of India. (2017). Livability Standards in Cities.
[2] Rutuja Somwanshi, Utkarsha Shinde patil, Deepali Tule, Archana Mankar, Namdev Ingle, “Study and development of village as a smart village” ISSN 2229-5518, International Journal of Scientific & Engineering Research, Volume 7, Issue 6, June-2016.
[3] Ketaki Chavan, Shrotikamane, Ankita Jadhav, Pankaj Khot, Namdev kamble Chetankumar Nikam, “DETAILED PROJECT REPORT ON SMART VILLAGE KANDALGAON”, ISBN: 9789387793033, 8th national conference on emerging trends in engineering and technologies, 2018.
[4] Moh. Abrar, Krunal Khandelwal,Meet Desai, Nirav Mehta, “Development of Infrastructural Facilities in Vadi Village”, IJIRST –International Journal for Innovative Research in Science & Technology| Volume 3 | Issue 03 | August 2016
[5] Nishant Malooa , Sandhya Seetharamana , Bakul Raob, Dharmendra Kumara , Indrayani Jayant Nishanea,”Standardization of the baseline study to plan for roads and transportation in villages: Case of Chikurde and Bhulane in Maharashtra”, Transportation Research Procedia 17 ( 2016 ) 193 – 202 , ELSEVIER. [6] Ms. Sadavarte S.P., Dr. Zende A.M., Prof. Deshmukh S.S, “Conceptualizing “Smart Village” With Case Study Hiware Bazar: Need of Indian Village