Decision Support using a Multi-Agent System for
Hardware Upgrades in Smart Grids
Ala Shaabana, Sami Syed, Ziad Kobti, and Kemal Tepe
Abstract—Impact of plug-in hybrid electric vehicles (PHEV) on electrical distribution and generation systems is not fully understood. This poses challenges to distribution and generation companies on how to retool their distribution and generation systems to meet and supply increased demand in the future. Further, having unpredictable and uncontrollable generation patterns of renewable energy sources makes it even harder to manage supply and demand in the grid. This paper is one of the first attempts to provide a more realistic simulation environment to help engineers fully understand the impact of including PHEVs and RGs. The simulator provides a grid infrastructure with components modelled as agents. With this simulator, the grid can then be evaluated with different hardware and operating conditions to maximize resources. As such, utilities and generation companies can evaluate and test different strategies to upgrade the infrastructure to improve reliability and generation capacity to effectively meet demand.
Index Terms—Multi-Agent System, Smart Grids, Simulation
I. INTRODUCTION
Traditionally electrical distribution systems (i.e., grids) have been designed to provide energy from large generators to the customers. However, environmental concerns, such as global warming and pollution, force us to utilize small scale distributed renewable generation (RG) as well as the electri-fication of the transportation systems, such as plug-in-hybrid electrical vehicles (PHEV). These new generation techniques and increased demand by PHEVs pose great challenges to the existing grid infrastructure since the energy flow can reverse direction from the customer side to grid. Demand by PHEVs can cause grids to collapse, interestingly PHEV batteries can be utilized as storage and supply electricity back to grid to shave off peak demand. This conflicting and challenging paradigm shift requires new design and control mechanisms in the grid. Recognizing this, an initiative called Smart Grid (SG) has been created to better integrate automation, monitoring and managing all the entities with smart devices and communication infrastructure. SG will eventually allow the management of new distributed RG such as solar panels and wind turbines, and innovative power consumers such as
Manuscript received July 18, 2012; revised August 06, 2012. This work was supported in part by the National Science and Engineering Research Council.
Ala Shaabana is with the University of Windsor’s Computer Science department, Windsor, Canada N9B 3P4 (Phone: 519-992-2134, e-mail: [email protected])
Sami Syed is with the University of Windsor’s Electrical and Computer Engineering department, Windsor, Canada N9B 3P4 (Phone: 519-562-7078, e-mail: [email protected])
Ziad Kobti is with the University of Windsor’s Computer Science de-partment, Windsor, Canada N9B 3P4 (Phone: 519-253-300 ext. 3792 Fax: 519-973-7093, e-mail: [email protected])
Kemal Tepe is with the University of Windsor’s Electrical and Computer Engineering department, Windsor, Canada N9B 3P4 (Phone: 519-253-3000 ext. 3426 Fax: 519-971-3695, e-mail: [email protected])
PHEV. One of the benefits of SG is to curb infrastructure over-loads and temporary energy shortages, called imbalance costs. Imbalance occurs due to unpredictable changes in production and consumption, and imbalance cost is an extra expense for compensating this temporary imbalance between supply and demand.
A. Objectives
Energy imbalance is usually curbed with voltage regula-tion, and when demand increases the voltage drops, hence the imbalance. However, voltage regulation may have negligible effect on power demand, for example electric heaters on a lower voltage simply run longer to deliver the same amount of heat, while devices with electrical motors generate a lower magnetic field and may work longer to complete the same mechanical work. The study done in 2010 by the United State’s Department of Energy’s Pacific Northwest National Laboratory (PNNL) by [1] highlights difficulties of regulating supply and demand with voltage regulation. In recent years, SG has been investigated to effectively match supply and demand. One of such investigations is the work done by James et al. (2006), which suggests an adaptive, intelligent agent-based software system that can provide real-time, two-way communication and decision making between Distributed Energy Resources (DERs) as system nodes. James et al. advocate that the proposed software also enables the ability to create on-the-fly aggregate blocks of capacity for presentation to the energy markets. This and the work done by Schneider et al. suggest building solutions on top of existing grid systems, which may not solve the problem permanently in certain cases.
Inspired work done in SG field by [1] and [2], our objective in this work is to analyse, design, implement and evaluate an approach which models and simulates a dynamic infrastructure of a city wide SG. This model and simulator is designed to provide an SG scenario as close to a real-world scenario as possible using individual agents. The proposed system suggests gradual, hierarchical upgrades to the system as various parameters within the simulation, such as the number of PHEVs on the system. The suggested upgrades change and adapt in cost and power output as time and populations change.
II. RELATED WORK
Dimeas mentioned that the use of multi-agent systems in the control of a microgrid solves a number of specific oper-ational problems. Sweda et al. (2011) created a simulation environment aimed at capturing the activities and decisions of an individual driver who has the option of purchasing an electric vehicle. In this agent based model, the agents are the drivers who can interact with each other to influence the vehicle purchasing behaviour. Each agent is given different attributes such as age, level of anxiety, income, etc.. Vehicle maintenance costs have not been accounted for in this simulation; moreover agents know ahead of time when to replace their vehicles. This simulation helps investors in the PHEV industry acquire knowledge in the demand of electric vehicles in a specific area. Zhi et al. (2011) tried to simulate an electricity market with PHEV penetration by using agents to simulate and model various situations. Each agent has a unique decision making process to plan their daily trips and determine vehicle profiles. The authors concluded that the current electric power structure is capable of accommodating the electric vehicles if appropriate charging strategies are applied. However, they do not account for a continuous increase of electrical vehicle agents within their simulation. Vandael et al. (2011) investigated fulfilling customer de-mands while avoiding infrastructure overloads by reducing imbalance costs. Hence, they proposed a Multi-Agent System (MAS) which utilizes an “intention graph” for expressing the flexibility of a fleet of PHEVs, and consequently help in scheduling their charging in real time to help reduce imbalances.
III. TECHNOLOGIES
In the designed simulation, all entities were implemented using the software agent paradigm. Specifically, the Repast Suite was used in order to implement the multi-agent system. In fact, MAS are often used by researchers to achieve individual intelligence and control [8]. As such, an MAS was implemented in Repast in order to model the interactions between PHEVs, residential zones, industrial zones, grid stations. Further, ”abstract” agents were implemented, which do not have a physical existence in the simulations but can manipulate and control the other agents (like increasing the number of PHEVs or assessing the pollution levels in a certain zone agent). The main agents behind the simulator structure with respect to the simulated entities include:
1. PHEV
2. Households and Industrial
3. Grid Stations
4. Abstract Agents
A. SIMULATION OVERVIEW
The simulation is based on the city of Windsor, Ontario, Canada with a population of approximately 210, 000. We have used a total of 6 types of agents in our simulation.
1) PHEV: PHEVs are an integral part of any smart grid system, as such we have modelled the electric vehicle agents such that they are created every 100 ticks in the
[image:2.595.304.580.136.361.2]simulation world (equivalent to approximately one day in the real world). They move more often during the day than during the night, and hence have power usage that is close to their real-world counterparts. Figure 1 shows the movement algorithm of the electric cars.
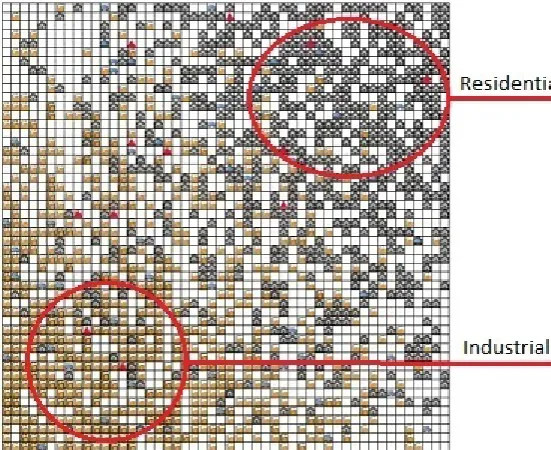
Fig. 2. Industrial and Residential Zone Layout. Note how a chi-squared distribution function was used in order to distribute the residential agents and the industrial agents
2) Industrial and Household zones: In order to create a simulation as close to the real-world as possible, we have used a square function to distribute the residential and industrial cells across the map. As can be seen from Figure 2, the residential cells are more concentrated towards the northeast while the industry cells are more concentrated towards the southwest. In order to generate this formation while making sure they are placed at random within their own zones, we use algorithm 1 for the residential cell placement, and algorithm 2 for the industrial cell placement. Essentially, this algorithm chooses a random value between 1 and the length of the grid side squared for both the x and y coordinates. Once we have a position then the probability of obtaining a higher value will become larger than the probability of obtaining a lower value the next time we apply this function. In other words, there is a higher probability of x (or y) being closer to the length of the grid side. Algorithm 1 and Algorithm 2 function in the same way, however the main difference is that the placement of house agents is dependent on the positions of grid stations, while the placement of industrial agents is dependant on the positions of both houses and grid station.
3) Grid Stations: For the purposes of this paper, we have placed grid stations at random along the grid. This is to accommodate the possibility that the smart grid was not designed with optimal grid station placement in mind. However, in future work it is possible to expand upon this and account for optimal grid station placement in the grid.
Fig. 1. Flow Chart of PHEV movement algorithm
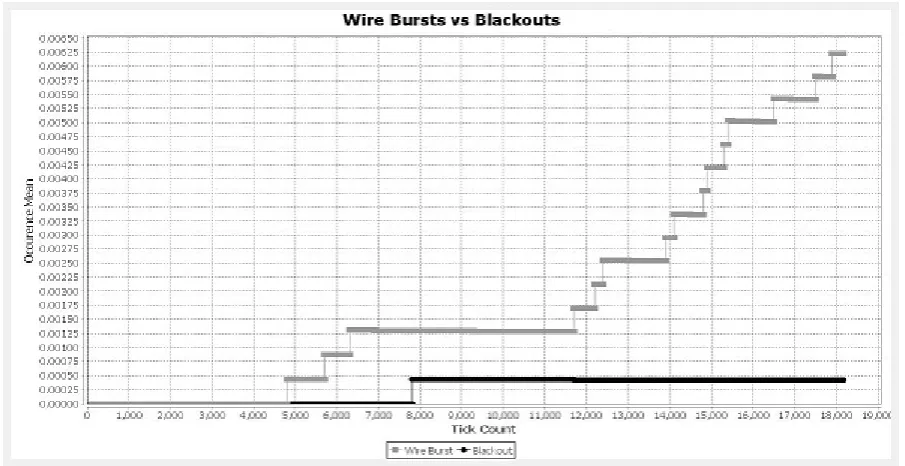
Fig. 3. Wire bursts VS Blackouts. Note how wire bursts continue to occur while blackouts become constant over time.
in the simulation, however they have access to information stored within the other agents, and thus are able to manipu-late them. The first of these is an agent responsible for the electric vehicles in the simulation. Its sole responsibility is to add vehicles to the city at specified time intervals (the most practical interval for experiments was found to be every 100 ticks).
The second abstract agent is the stabilizer agent. This agent monitors the smart grid usage and changes things within the simulation accordingly. For example, if the grid is overloaded, the stabilizer will induce a blackout in an area. In addition to monitoring the other agents, this agent provides room for the expansion of the simulation in future
work, as it allows for the monitoring of the entire system and the agents within it. Algorithm 3 describes the monitoring process and actions taken by the stabilizer when measuring the production and consumption. The stabilizer runs every step.
IV. EXPERIMENTS
[image:3.595.72.525.350.583.2]foreach house agent do Rndα = Random(2,2501);
xα= ceil(Rnd0α.5)-1;
Rndα = Random(2,2501);
yα = ceil(Rnd0α.5)-1;
whilecell(x,y) is occupied by a grid station do Rndα = Random(2,2501);
xα= ceil(Rnd0α.5)-1;
Rndα = Random(2,2501);
yα = ceil(Rnd0α.5)-1;
end
Move house to cell (x, y)
end
Algorithm 1: Residential Placement
foreach industrial agent do Rndα = Random(2,2501);
xα= ceil(Rnd0α.5)-1;
Rndα = Random(2,2501);
yα = ceil(Rnd0α.5)-1;
whilecell(x,y) is occupied by a grid station or by a residential cell do
Rndα = Random(2,2501);
xα= ceil(Rnd0α.5)-1;
Rndα = Random(2,2501);
yα = ceil(Rnd0α.5)-1;
end
Move factory to cell (sideLength-x,sideLength-y)
end
Algorithm 2:Industry Placement
foreach grid stationiαdo
iα.production = iα.consumption;
if iα.production>iα.maxProductionLevel then
iα.production = 0;
iα.blackout = true;
foreach residential cell jα do
jα.blackout = true;
foreach vehicle associated with a housekα
do
kα.blackout = true ;
end end
foreach commercial cellcα do
cα.blackout = true;
end end end
Algorithm 3: Stabilizer Monitoring
8580 MW, making the total power generation 9160 MW. There is a total of 72 grid stations in the entire metro area of Windsor. However, by taking a ratio of the city area and scaling down the total size, we only needed to use 12 grid stations in our simulation, with each covering an area of 15x15 cells and producing approximately 763 MW.
In terms of residential and industrial zones, about 60% (or approximately 1500 cells) is industrial, while about 15% are farms, and the remaining 35% are houses. Hence, the residential area in Windsor is about 51.46 KM2, or 875 cells (we’ve included farms under residential zones). We have taken an average of 5 persons per family, with the density of Windsor being approximately 4100/KM2, our calculations show there are approximately 819 families/KM2. Out of this, 80% of them would be in apartments, townhouses, etc. Hence our densities will be 163 houses/KM2 and 13 apartment buildings/KM2. Following these considerations, we have determined that there are 8 houses and 1 apartment building per cell in a household agent. Thus, we have 1200 industrial cells, and 875 residential cells.
Finally, with regard to power consumptions, we have assumed that homes have a 50 kWh usage. Hence the approximate consumption by a residential cell is:
(1) 400(8 houses)+ 1511(1 apartment building)
= 1911KW
= 1.911M W h
While the power consumption by an average industrial cell can be taken as the difference between generation and consumption. Moreover, we have added an extra 1000 MW for peak situations. Hence the average usage of an industrial cell is approximately 5.4 MW. Further, we have assumed that PHEVs consume about 30 KW for each charge. Therefore, we have assumed 1.911 mWh usage per residential cell, 5.4 MW usage per industrial cell, and 30 KW usage for each PHEV charge.
V. RESULTS
The simulation was run for 8760 simulation-world hours, simulating approximately a year. Results show that there have been 10817 wire bursts and 2211 blackouts. Blackouts usu-ally occur because of grid station failures while wire bursts typically occur because of wiring failures. Once a blackout or a wire burst occurs, we increment their corresponding variables and reflect this change on the simulation. We are thus able to extrapolate the next logical step in upgrading our smart grid. It is evident from our simulation that a wire upgrade is more important than a grid station upgrade to better utilize and sustain the current infrastructure for the city. Further, the simulation also presents when and where the blackouts and/or wire bursts will occur, further triangulating the problematic areas in order to allow for easier upgrade strategies.
from the simulated conditions and from the generated results and graphs, .
The values may be changed and/or expanded to include other hardware upgrades and parameters. Further, these re-sults indicate that a simulation is necessary to realize a better equipped smart grid as calculations and numerical methods alone show the current infrastructure should be able to sustain the power load, but do not show which failures will occur first.
VI. CONCLUSION
We have simulated the smart grid for a real-world city, and used a multi-agent system to better understand and make recommendations to a smart grid. The simulation is able to determine which hardware upgrade is more effective for the current infrastructure. For the purposes of our experi-ments we have checked between wire upgrades and/or grid station upgrades. Simulation results show that the multi-agent system approach is able to show when and where the blackouts and/or wire bursts will occur and make the necessary suggestions based on their frequencies. In the fu-ture, it is possible to investigate how grid station placements will play a role on simulation results. Further, expanding the simulation to include other hardware parameters will also very likely influence the outcome, providing different results and eventually highlight the locations of problematic sections in the grid.
VII. FUTUREWORK
In addition to adding more parameters and more realistic variables to the simulation, the capacity of home residencies (and even PHEVs) to re-inject energy in the network could be considered. It is also possible to evolve the current simulation into an interactive economical system by integrating more intricate agent-agent communications.
VIII. ACKNOWLEDGEMENTS
The authors acknowledge the contributions of the National Sciences and Engineering Research Council (NSERC).
REFERENCES
[1] K. Schneider and F. Tuffner, “Evaluation of conservation voltage reduction (cvr) on a national level,”U.S. Department of Energy, Aug. 2010.
[2] G. James, D. Cohen, R. Dodier, G. Platt, and D. Palmer, “A deployed multi-agent framework for distributed energy applications,” in Proceedings of the fifth international joint conference on Autonomous agents and multiagent systems, ser. AAMAS ’06. New York, NY, USA: ACM, 2006, pp. 676–678. [Online]. Available: http://doi.acm.org/10.1145/1160633.1160752
[3] A. Dimeas and N. Hatziargyriou, “A multiagent system for microgrids,” inIEEE Power Engineering Society General Meeting, 2004., june 2004, pp. 55 – 58 Vol.1.
[4] T. Sweda and D. Klabjan, “An agent-based decision support system for electric vehicle charging infrastructure deployment,” inVehicle Power and Propulsion Conference (VPPC), 2011 IEEE, sept. 2011, pp. 1 –5. [5] Z. Zhou, J. Wang, and A. Botterud, “Agent-based electricity market simulation with plug-in hybrid electric vehicle penetration,” in2011 IEEE Power and Energy Society General Meeting., july 2011, pp. 1 –2. [6] S. Vandael, N. Bouck´e, T. Holvoet, K. De Craemer, and G. Deconinck, “Decentralized coordination of plug-in hybrid vehicles for imbalance reduction in a smart grid,” inThe 10th International Conference on Autonomous Agents and Multiagent Systems - Volume 2, ser. AAMAS ’11. Richland, SC: International Foundation for Autonomous Agents and Multiagent Systems, 2011, pp. 803–810. [Online]. Available: http://dl.acm.org/citation.cfm?id=2031678.2031732
[7] T. H. N. C. North, M.J. and J. Vos, “A declarative model assembly infrastructure for verification and validation,”S. Takahashi, D.L. Sallach and J. Rouchier, eds., Advancing Social Simulation: The First World Congress, Springer, Heidelberg, FRG 2007, 2007.