LIGHT PENETRATION INTO FRESH WATER.
III. SEASONAL VARIATIONS IN THE LIGHT CONDITIONS IN
WINDERMERE IN RELATION TO VEGETATION.
BY W. H. PEARS ALL AND PHILIP ULLYOTT.
{Received 29th May, 1933.)
(With Three Text-figures.)
IN the last paper of this series (Pearsall and Hewitt, 1933) changes in the transparency of the water of Windermere were described. It was shown that the penetration of blue light (5100 A to 4000 A), as measured by the sulphuric acid-iodide method, was very much greater in 1920 than it was in 1932. The present communication deals with the results of observations on changes in the transparency of the water of Windermere throughout the year March, 1932, to March, 1933. The causes of the differences in the light penetration at different times of the year are discussed.
The light-sensitive element used for making the measurements of light intensity was a vacuum potassium-on-copper photoelectric cell (type K.M.V. 6, General Electric
Co., England). As the measuring instrument a neon lamp photometer, modified after the recommendations of Atkins and Poole (1930), was used for the earlier observations (up to May, 1932), but later it was found more convenient to use a thermionic potentiometer (Ullyott, 1933). The spectral sensitivity of the cell, and the arrangement of the potentiometer have already been described (Pearsall and Ullyott, 1933), and all that need be said here is that the particular cell used for the under-water measurements has a maximum sensitivity in the region 4000-4900 A. It therefore measures much the same quality of light as is effective in causing the sulphuric acid-iodide reaction.
In each series of measurements the cell in its water-tight container was lowered into the water, and readings of the light intensity taken at one metre intervals. The photometer was hung from a 6 ft. boom over the side of the Laboratory's launch which was always anchored so that the boom pointed towards the brightest region of the sky. This procedure reduced shading effects to a negligible minimum. A similar photometer was kept on deck in an unshaded position, so that readings of full daylight could be taken whenever necessary. If the conditions of illumination tended to be at all variable, deck readings were taken at each new position of the under-water photometer. In this way it was always possible afterwards to express the under-water readings as percentages of full daylight.
9
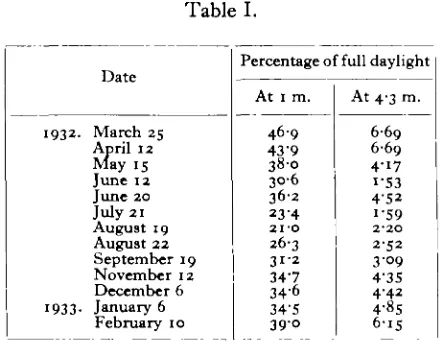
[image:2.595.187.407.334.506.2]them repeat certain constant features of the typical series which have already been described (Pearsall and Ullyott, 1933). Instead, certain series have been chosen for a number of dates during the year, and set out in Table I. Two depths have been selected at which figures for the percentage value of the light intensity are given. The 1 metre readings serve to show what was the transparency of the most superficial layers of the lake water. The second depth, 4-3 metres, represents the lowest limit of the rooted vegetation, and consequently light intensities at this particular depth are of special interest. The dates have been chosen either because the results obtained on them are typical of the month which they represent, or because they illustrate some fundamental point in the yearly cycle of light conditions. For example, the data for June 12th were selected because on that date the maximum number of diatoms was recorded, and those for March 25th because the lake water was at that time at its clearest.
Table I.
Date
1932. March 25
April 12 May 15 June 12 June 20 July 21 August 19 August 22 September 19 November 12 December 6 1933. January 6
February 10
Percentage of full daylight
At 1 m.
46-9
43-9 38-0
3 0 6 3 6 2
23-4
2I-O
26-3
3 1 2
34-7 3 4 6 34'5
3 9 0
At 4-3 m.
6 6 9 669 4-17 i"53 4-52 i-59 2-2O 2-52 3-09 4'35 4-42 4-85 6-iS
Light Penetration into Fresh Water 91
It is now possible to consider the data in greater detail. The figures given in Table I have been plotted as a graph in Fig. 1, which shows clearly the differences in penetration of the light at different times of the year. In March and during the beginning of April the lake water was remarkably clear, but during the latter half of April and the whole of May the transparency of the water gradually decreased, until it reached a minimum in early June. Towards the end of June it became tem-porarily clear again. The decrease in transparency during this period was due to the increasing number of diatoms, and the minimal light penetration in early June was associated with the diatom maximum. A very rapid decrease in diatom numbers occurred during the week June i3th-2Oth, with the result that on June 20th the water was clearer than it had been since the development towards the maximum during the early part of the previous month. After the short period of clearness in June the light penetration was again reduced by a steady increase in numbers of blue-green algae, which occurred during July. The maximum was at the beginning of August, but the algae persisted in decreasing numbers until the end of October, after which the phytoplankton was comparatively scarce.
In Fig. 2 the relative numbers of phytoplankton organisms in the surface 5 metres throughout the year are shown alongside the percentage values for light intensity at 4-3 metres. This correlation shows how clearly the light penetration into the water is associated with the number of organisms present. The results for the light penetration into the water at significant times during the year are given in Fig. 3. The curves for June 12th and July 21st are of special interest, because they illustrate what happens during the diatom maximum and during the blue-green maximum. It is well known that diatoms usually show a fairly uniform depth distribution down to 4-5 metres, whereas the blue-green algae always accumulate close to the surface. The curves for light penetration indicate these differences clearly. This difference in depth distribution of the two plants also explains why minimal percentage light intensities at 1 metre always occur during the blue-green maximum, while minimal percentage light intensities at greater depths can occur equally well during the diatom maximum.
MAR. APR. MAY JUNE JULY AUG. SEPT. OCT. NOV. DEC 1932
+ Light intensity at 4-3 metres; O light intensity at 1 metre
JAN. FEB.
[image:4.595.99.501.120.450.2]1933
Fig. 1. Light intensities at the limit of aquatic vegetation (43 metres) and at a depth of 1 metre in Windermere during the year March, 1932, to March, 1933.
•a
£ 6 MAR. APR. MAY JUNE JULY AUG. 8 E P T . OCT. NOV. DEO JAN. FEB. M.
1932 1933 + Light intensity at 4-3 metres. O Number of phytoplankton organisms.
Fig. 2. Light intensity at the limit of aquatic vegetation (4-3 metres) compared with the numbers of phytoplankton organisms in the top 5 metres. (Windermere, March, 1932, to March, 1933.)
Logarithm of percentage light intensity (uniform diffuse light basis) (H) 0-2 0-4 (K> 0 8 H) Ki M K> h8 2 0
[image:4.595.181.416.504.678.2]During November and December a gradual clearing of the lake water was to be expected, but no specially marked change seemed to occur immediately after most of the blue-green algae had disappeared. During November the littoral vegetation dies down for the winter, and quantities of detritus formed in this way, along with the products of algal decomposition, may have been responsible for the continued turbidity of the water. The rough weather and floods which occurred during the latter half of November and during December probably contributed towards prolonging the effect. In any case, during the whole of January and February a progressive clearing of the lake water took place.
The combined results leave little doubt that the amount of light penetrating down to the limit of rooted vegetation depends very largely on the quantity of phytoplankton in the surface layers of the water. This is specially true during spring and summer. For the rooted vegetation the period of maximum activity is July and August, so that the amount of phytoplankton present at this time will be of the utmost importance. But Fig. 1 shows that during this period the actual per-centage light intensity at 4-3 metres is 1'5-2-5 per cent., whereas, if no blue-green maximum occurred, it would be 4-5 per cent. So it is clear that at precisely the time of greatest activity of the submerged plants, the blue-green algae cut down the light intensity at the limit of vegetation by approximately 50 per cent., and, since light is the factor limiting the downward extent of the aquatic plants, the effect of the presence of the blue-green algae on the limit of vegetation itself cannot fail to be of great importance.
SUMMARY.
1. The penetration of light into Windermere is dependent chiefly on the num-bers of phytoplankton organisms in the epilimnion.
2. It appears that the greatest depth at which rooted aquatic plants can grow must therefore be affected by the abundance of phytoplankton. The rooted plants are most active during July and August. Observations show that at this time the presence of blue-green algae reduces the light intensity at the limit of submerged vegetation (4-3 metres) by more than 50 per cent.
REFERENCES.
ATKINS, W. R. G. and POOLB, H. H. (1930). Biol. Rev. and Biol. Proc. Camb. Phil. Soc. 5, 91-113. BIRGE, E. A. and JUDAY, C. (1929). Trans. Wis. Acad. 24, 509-80.