A Progressive Study on Users Perception and
Satisfaction towards Online Cab Service with
Reference to Coimbatore
Dr. S. M. Yamuna1, R Vijayalakshmi2, K Jeeva Mani3, D Boopathi4, P Ranjith Kumar5
1
M.Com., MBA., M.Phil., PGDCA., PhD, 2B. Com (BPS), 3B. Com (BPS), 4B. Com (BPS), 5B. Com (BPS) Associate Professor, Head, Department of Commerce (U/A), PSG College of Arts and Science, Coimbatore, India.
Abstract: The taxi market has evolved over time and how it has now become an expeditiously growing business in the country. The evolution of on-demand taxis in India happened in early 2014 and 2015. Fundamentally, the growth happened at the cost of radio taxis like Ola cabs, Uber cabs, Meru cabs etc. The popularity of on-demand taxis grew very rapidly because they were able to plug gaps in the intra-city transportation, something the municipal public transport couldn`t do that. The ease of availing a door-door ride through smartphone at a reasonable cost fueled the on-demand taxi market in India. The cab aggregators call themselves a tech company as they don’t own any of the vehicles and charge a commission only for their “match-making” services. The research paper aims to study how Taxi Aggregators have impacted the society through various methods like offering coupons, quality service, mobile applications, air conditioning, educated and skilled drivers, multiple payment options, 24×7 user support, electronic fare meters, GPS enabled vehicles, etc. and what has resulted in its growth which leads it to be called as a disruptor.
Keywords: Online Cabs, Users, Perception, Satisfaction, Mobile Applications.
I. INTRODUCTION
The evolution of on-demand taxis or demand for radio cabs in India happened in early 2015. The growth in taxi industry happened because of radio taxis like Ola cabs, Uber cabs, Meru cabs etc. The easy booking of door-step ride through smartphone cab app at a reasonable cost increased the growth of radio cabs business market in India. The cab aggregators company don’t own any of the vehicles or cars but they tied up with local drivers who would register with such organization, and the agency simply acted as an intermediary between the drivers and customers by charge a commission only for their “match-making” services as they developed the cab application.
A. Objectives of The Study
1) To know the user’s perception on availability of various cab service providers.
2) To analyse the various factors which are influencing users while selecting a cab service. 3) To identify the unique features offered by the cab operators to the users.
4) To analyse the user satisfaction level towards cab service providers. 5) To identify the problems faced by users while using cab services.
B. Research Methodology
The current study is based on primary data collected from 200 respondents from the different parts of Coimbatore. A well-structured questionnaire was designed to collect the information from the respondents the questionnaire was designed to study perception of user and satisfaction towards online cab services.
C. Statistical Tools Of The Study
The following statistical tools were used in the study for the purpose of analysis. 1) Simple Percentage Analysis
2) Chi-Square Analysis
D. Market Dynamics
The evolution of on-demand taxis in India happened in early 2014 and 2015. Fundamentally, the growth happened at the cost of radio taxis like Ola cabs, Uber cabs, Meru cabs etc. The popularity of on-demand taxis grew very rapidly because they were able to plug gaps in the intra-city transportation, something the municipal public transport couldn`t do that. The ease of availing a door-door ride through smartphone at a reasonable cost fueled the on-demand taxi market in India. The cab aggregators call themselves a tech company as they don’t own any of the vehicles and charge a commission only for their “match-making” services.
The biggest risk to on-demand taxi market in India is the scrutiny it gets from local state governments. The Gujarat government is the latest addition to the list. The Gujarat government is considering a proposal to limit the number of cabs run by cab aggregators at 20,000 each. The Karnataka government has already pushed the cab aggregators to limit the fare charged as per the cost of the vehicle. There are safety risks too and the on-demand taxi operators are using tech to solve that. For example, Ola has rolled out a real-time ride monitoring system to keep tab of any deviation in routes. Many cities don’t have legislation regarding app-based taxis. Due to this, new entrants like Namma TYGR in Bengaluru had to stop operations.
[image:2.612.75.529.236.683.2]II. DATA ANALYSIS AND INTERPRETATION
Table no - 1
Cab usage by the respondents
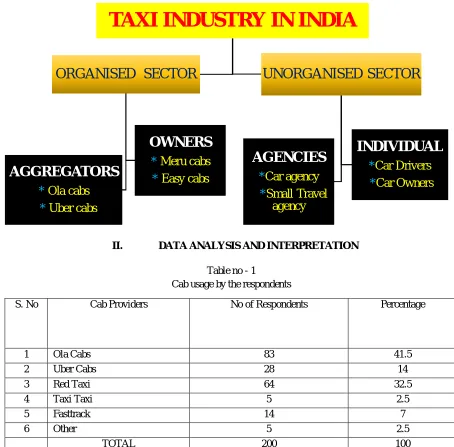
TAXI INDUSTRY IN INDIA
ORGANISED SECTOR
AGGREGATORS
*
Ola cabs
*
Uber cabs
OWNERS
*
Meru cabs
*
Easy cabs
UNORGANISED SECTOR
AGENCIES
*
Car agency
*
Small Travel
agency
INDIVIDUAL
*
Car Drivers
*
Car Owners
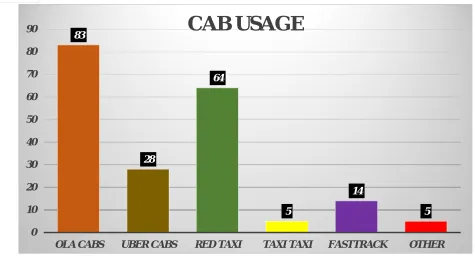
S. No Cab Providers No of Respondents Percentage
1 Ola Cabs 83 41.5
2 Uber Cabs 28 14
3 Red Taxi 64 32.5
4 Taxi Taxi 5 2.5
5 Fasttrack 14 7
6 Other 5 2.5
1) Interpretation: This Bar diagram revealed that, out of 200 respondents 41.5% of respondents are using Ola Cabs, 14% of respondents are using Uber Cabs, 32.5% of respondents are using Red Taxi, 2.5% of respondents are using Taxi Taxi service, 7% of respondents are using Fasttrack, and 2.5% of respondents are using their Own vehicles.
[image:3.612.60.535.73.333.2]Most (41.5%) of the respondents are using Ola Cabs.
Table no - 2
Billing method preffered by users
S. No Method of Billing No of Respondents Percentage
1 Traditional Meter 32 16
2 Online Cab App 131 65.5
3 Distance & Transmit billing 37 18.5
Total 200 100
83
28
64
5
14
5
0 10 20 30 40 50 60 70 80 90
OLA CABS UBER CABS RED TAXI TAXI TAXI FASTTRACK OTHER
CAB USAGE
32
131
37
0 20 40 60 80 100 120 140
TRADITIONAL METER
ONLINE CAB APP
2) Interpretation: Table no-3 indicates that, out of 200 respondents 16% of respondents are preferring Traditional method of billing, 65.5% of respondents are preferring Online Cab Application billing method and 18.5% of respondents are preferring Distance & Transmit billing method.
[image:4.612.80.534.158.484.2]Majority (65.5%) of the respondents are preferring Online Cab Application billing method.
Table no - 3
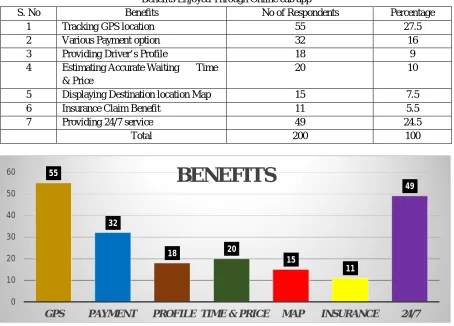
Benefits Enjoyed Through Online cab app
S. No Benefits No of Respondents Percentage
1 Tracking GPS location 55 27.5
2 Various Payment option 32 16
3 Providing Driver’s Profile 18 9
4 Estimating Accurate Waiting Time & Price
20 10
5 Displaying Destination location Map 15 7.5
6 Insurance Claim Benefit 11 5.5
7 Providing 24/7 service 49 24.5
Total 200 100
3) Interpretation: This figure has inferred the following data, out of 200 respondents 27.5% of respondents are preferring Tracking GPS Location facility, 16% of respondents are preferring Various Payment Mode facility, 9% of respondents are preferring Maintenance of Driver’s Profile facility, 10% of respondents are preferring Estimation of Accurate Waiting Time & Price facility, 7.5% are preferring Destination Location Map facility, 5.5% of respondents are preferring Insurance Benefit and 24.5 of respondents are preferring 24/7 Service facility.
Most (27.5%) of the respondents are preferring Tracking GPS Location facility.
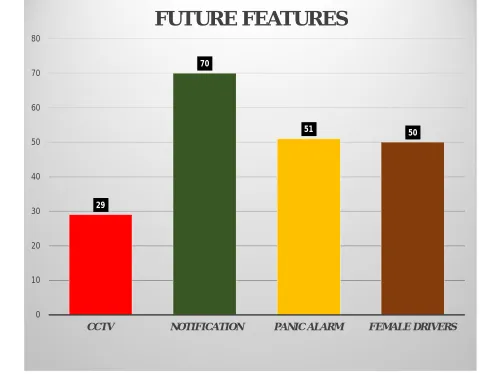
Table no - 4
Future features expected by the respondents
S. No Unique Features No of Respondents Percentage
1 CCTV to monitor driver 29 14.5
2 Track and Send Notification 70 35
3 Panic alarm option 51 25.5
4 Female drivers for females 50 25
Total 200 100
55
32
18 20
15
11
49
0 10 20 30 40 50 60
GPS PAYMENT PROFILE TIME & PRICE MAP INSURANCE 24/7
[image:4.612.83.533.603.703.2]4) Interpretation: This data has resulted from above table that, out of 200 respondents 14.5% of respondents are expecting CCTV camera to monitor driver, 35% of respondents are expecting to Track and Send Notification to Control room if there are any changes from destinating location, 25.5% of respondents are expecting Panic Alarm facility at the time of emergency and 25%
of respondents are expecting Female Drivers facility for female passengers.
[image:5.612.55.535.78.452.2]Most (35%) of the respondents are expecting to Track and Send Notification to Control room if there are any changes from destinating location.
Table no - 5
Problems faced by users of cabs
S. No Problems Faced No of Respondents Percentage
1 Unable to conduct drivers 31 15.5
2 Attending personal phone calls while driving
28 14
3 Feeling unsecured during night rides 20 10
4 Drivers Unnecessarily engaging in conversation with passengers
16 8
5 Unavailable of cabs at sometimes 87 43.5
6 Wrong estimation of waiting time 18 9
29
70
51 50
0 10 20 30 40 50 60 70 80
CCTV NOTIFICATION PANIC ALARM FEMALE DRIVERS
5) Interpretation: This Bar diagram revealed that, out of 200 respondents 15.5% of respondents are Unable to Conduct drivers, 14% of respondents have noticed drivers Attending Personal Phone calls while driving, 10% of respondents are feeling Unsecured during night time, 8% of respondents have noticed that drivers are engaging with Unnecessary Conversation with passengers, 43.5% have faced issue of Unavailability of cabs at sometimes and 9% of respondents have felt bad for Wrongly estimating Waiting Time to customers.
[image:6.612.64.537.76.322.2]Most (43.5%) of the respondents have faced issue of Unavailability of cabs at sometimes particularly during Rainy seasons.
Table no - 6
Personal factors vs Behaviour of Drivers
31
28
20
16
87
18
0 10 20 30 40 50 60 70 80 90 100
UNABLE TO CONDUCT
USING PHONE UNSECURED UNNECESSARY
TALK
UNAVAILABLE OF CABS
WRONG ESTIMATION
PROBLEMS FACED
PERSONAL FACTOR CHI-X2 VALUE DF P.VA SIGN ACCEPTED/NOT ACCEPTED
Gender 0.515 3 0.916 NS Accepted
Area 9.625 6 0.141 NS Accepted
Age 8.773 9 0.458 NS Accepted
Educational Qualification 15.720 15 0.401 NS Accepted
Occupational Status 10.897 12 0.538 NS Accepted
Type of Family 2.339 3 0.505 NS Accepted
6) Interpretation: From the above table it is clear that the personal factors like gender, area, age, educational qualification, occupational status and monthly income level do not have any significant influence on behaviour of cab drivers. The null hypothesis is accepted.
And it is also inferred that one of the personal factor, type of family has significant influence on behaviour of cab drivers. The null hypothesis is not accepted.
[image:7.612.44.571.414.715.2]Note – If Sign Value = >0.05 means NOT SIGNIFICANT [NS] If Sign Value = <0.05 means SIGNIFICANT [S]
Table no - 7
Personal factors vs payment mode of users
7) Interpretation: From the above table it is clear that the personal factors like gender, area, age, educational qualification, occupational status, type of family and monthly income level do not have any significant influence on paying methods preferred by users. The null hypothesis is accepted.
Note – If Sign Value = >0.05 means NOT SIGNIFICANT [NS] If Sign Value = <0.05 means SIGNIFICANT [S]
Table no - 8
Customer satisfaction towars factors
PERSONAL FACTOR CHI-X2 VALUE DF P.VA SIGN ACCEPTED/NOT ACCEPTED
Gender 3.046 4 0.550 NS Accepted
Area 11.920 8 0.155 NS Accepted
Age 5.102 12 0.954 NS Accepted
Educational Qualification 12.323 20 0.905 NS Accepted
Occupational Status 16.693 16 0.406 NS Accepted
Type of Family 20.485 4 0.000 S Not Accepted
Income Level 12.987 12 0.370 NS Accepted
W S.NO FACTORS HS S MS DS HDS TOTAL AVG SCORE
1 Pricing Structure
No 39 114 42 4 1 200
3.93
Score 195 456 126 8 1 786
2 Safety & Comfortable
No 61 99 30 0 0 200
3.65
Score 305 396 90 0 0 731
3 Quality Assurance
No 47 114 35 1 0 200
3.99
Score 235 456 105 2 0 798
4 On Time Performance
No 45 116 35 4 0 200
4.01
Score 225 464 105 8 0 802
5 Ease of Work
No 43 67 44 5 1 200
3.13
Score 215 268 132 10 1 626
6 Area Coverage
No 40 95 56 9 0 200
3.83
Score 200 380 168 18 0 766
7 Availability of Cabs
No 45 98 48 6 3 200
3.88
8) Interpretation: The above table shows that, out of 200 respondents irrespective of the classification have high level agreeability towards “On Time Performance” followed by “Quality Assurance” then followed by their “Pricing Structure”, when compared to the other factors relating to satisfaction of Cab services.
The majority of respondents irrespective of the classification have high level agreeability towards “On Time Performance” of Cab services.
Table No – 9 Ranking The Cab Providers
CAB PROVIDERS MEAN
RANK
FINAL RANK
Ola Cabs 2.43 I
Uber Cabs 2.93 III
Red Taxi 2.73 II
Taxi Taxi 3.66 V
Fasttrack 3.26 IV
9) Interpretation: Most of the respondents who are using cab services have Ranked those providers based on their Quality of Service offered by Cab services. As per respondent’s perception it’s found that “Ola Cabs” was Ranked FIRST with least mean rank of 2.43, then “Red Taxi” was Ranked as SECOND, followed by “Uber Cabs” was Ranked as THIRD, next is “Fasttrack” in FOURTH place and the last one was “Taxi Taxi” cab service was in the FIFTH place of ranking order.
As per Respondents choice “OLA CABS” stood ‘FIRST PLACE’ among others.
A. Kendall’s Coefficient Of Concordance
Kendall’s coefficient of concordance (W) has been applied to find the extent of similarity among the respondents in assigning the ranks to the various Cab service providers. ‘W’ ranges between 0 and 1. Higher the value of W, more will be the similarity among the respondents.
Test statistics- Kendall’s coefficient of concordance (W)
With the value (W) 0.149 it is inferred that there is less similarity among the Quality of Service provided by various Cab operators.
III. FINDINGS, SUGGESTIONS AND CONCLUSIONS
A. Findings Of The Study
1) During the course of analysis, it is realized that 36% of the respondents are aware about and 41.5% of respondents are using Ola cabs in which 36.5% of respondents are aware through Family, Friends and Relatives.
2) The study found that, 50% of the respondents are using for Personal use and 72.5% of the respondents are mostly preferring Hatchback (4 seats) type cars for travel.
3) The analysis of the study discloses the fact that, 65.5% of the respondents are preferring online cab app Billing method in which 48.5% of the respondents are booking through Online Cab App but 72.5% of the respondents are preferring Cash Payment method.
4) During the course of analysis, it is realized that 35.5% of the respondents are considering Safety & Comfortable in cabs, so 27.5% of the respondents are enjoying Tracking GPS location facility and 35% of the respondents are expecting the feature to Track & Send Notification to Control room at the time of emergency.
5) In this study, user’s satisfaction are analysed that 37% of the respondents are feeling Comfortable with drivers while using cabs and 40% of the respondents are saying that drivers are Moderately Knowledgeable about the city but 43.5% of the respondents have faced Unavailability of Cabs at sometimes mainly during rainy seasons.
IV. RESULTS OF HYPOTHESES
A. Weighted Average Score Analysis resulted that the majority of respondents irrespective of the classification have high level agreeability towards “ON TIME PERFORMANCE” of cab services and the majority of respondents irrespective of the classification have high level agreeability of Risk Factor towards “TAXI TAXI” while comparing with other cab service providers.
B. Chi-Square analysis derived that the awareness of various cabs, cab booking method, payment mode along with behaviour of cab drivers and their socio-economic factors like gender, area, age, educational qualification, occupational status, type of family and monthly income level of the family don’t have the Significance among the respondents.
C. Kendall’s Coefficient of Concordance results stated that, based on the quality of service provided by various cab service which correlates with each respondent. It may be inferred that Ist place in the Ranking order was given to “OLA CAB & AUTO”.
V. SUGGESTIONS
Respondents have suggested their valuable comments in questionnaire. The following are the some of the concrete recommendations that are grouped in the Sub-section.
A. To Aggregators
1) Users are expecting many new innovative features in the cab services like, a) Track and Send Notification to Control room to ensure safety.
b) Motion Sensor or Heart Beat Rate monitors this isn’t breach Consumer’s privacy but provides security in extreme conditions. c) Option to cease Engine Remotely in case of Emergency while travelling.
d) Accident and Obstacle Detection Sensor. e) Panic Alarm facility at the time of emergency.
B. To Cab Owners
1) May cabs can avoid high prices for short rides and extra charges during peak times. 2) Need to improve availability of cabs for the users in rural areas.
3) Improve customer services and consider their valuable feedbacks.
4) May adopt Flexible fare system and Transparent fare system by making it as common pricing structure of all cab providers. 5) Maximize your service by providing 24/7 availability.
6) Maintain consistency by providing cabs even during Rainy times with the same available pricing structure. 7) May adopt for Female Drivers facility for female passengers.
C. To Drivers
1) Every driver should respect women and also need special care for women and kids mainly during night travels. 2) Driver’s should Strictly obey traffic rules every time.
3) Driver’s should have control over the speed level.
4) They can control their emotions in any sort of situation and be calm by avoiding rudeness behaviour.
VI. CONCLUSION
On the whole Cab providers are excellently providing quality service to travelers. This study highlights that the Taxi market in India is primarily an unorganized sector; however, over the years the private sector has identified opportunity in this sector which has given rise to the organized taxi market in India.
REFERENCES
[1] Chenggang Wang, Huaixin Chen, and Wee Keong Ng, “A TAXI BUSINESS INTELLIGENCE SYSTEM” -Communication of the ACM, Vol. 46, pp.: 81-83, 2011.
[2] Peng Zhou, Tamer Nadeem, Porlin Kang, Cristian Borcea, and Liviu Iftode, “EZCAB: A CAB BOOKING APPLICATION USING SHORT-RANGE WIRELESS COMMUNICATION” -IEEE International Conference on Pervasive Computing and Communications, Dallas-Fort Worth, TX, pp.: 87-96, 2012. [3] G. Venkatesh and George Easaw, “MEASURING THE PERFORMANCE OF TAXI SERVICE SUPPLY CHAIN” – SIBM Pune Research Journal, Vol X,
ISSN (print): 2249-1880 & ISSN (online): 2348-5329, pp.: 26-36, 2015.
[4] Aditya Sisode, Pallavi Palande, Vinay Puranik, Kunal Purandare, Rahul Akhouri, “CAB TRACKING AND PERSONAL SECURITY SYSTEM” – International Journal of Engineering and Computer science, Vol 4, Issue 1, ISSN: 2319-7242, pp.: 10158-10160, 2015.