©IJRASET: All Rights are Reserved
388
VLSI-Based System for Predicting Ventricular
Arrhythmia
Mayuri M. Salunke1, Dr. R. R. Dube2
1
Master of Engineering Student, Dept. of Electronics Engineering, W.I.T. Solapur, India
2
Ph.D. Professor, Dept. of Electronics Engineering, W.I.T. Solapur, India
Abstract: A heart attack is the most common cause of death globally. This paper gives an accurate solution for predicting ventricular arrhythmia a few hours before the onset. It presents the simulated design of a fully integrated electrocardiogram (ECG) signal processor (ESP) for the predicting of ventricular arrhythmia disease using a set of ECG features and a naïve Bayes classifier. Real-time techniques for the detection and the delineation of the P-QRS-T waves are used to extract the different fiducial points. Those techniques are robust to any variations in the ECG signal with high precision. The database of the heart signal recordings from the MIT PhysioNet is used as a validation training data set to evaluate the performance of the processor. The proposed architecture can analyze the delay, area and power consumption using VLSI-Xilinx ISE and simulation results on ModelSim.
Keywords: VLSI, ECG Signal Processor, Unique Feature Extraction, Xilinx ISE, Naïve Bayes classifier, ModelSim, Prediction of Ventricular Arrhythmia.
I. INTRODUCTION
According to a recent study by the Indian Council of Medical Research (ICMR) near about 25% of deaths between the ages of 25-69 years cause due to different heart-related problems. Ventricular arrhythmia is an abnormal ECG rhythm and is responsible for 75%–85% of sudden deaths in persons with heart problems unless treated within seconds. In most cases, there are two types of ventricular arrhythmias, including ventricular tachycardia (VT) or ventricular fibrillation (VF) [1], where VT is a fast rhythm of more than three consecutive beats originating from the ventricles at a rate more than 100 beats/min [3] and VF is the flat ECG signal indicating no cardiac electrical activity which is another rhythm characterized by the chaotic activation of ventricles. The normal resting heart rate ranges from 60 to 100 beats per minute for the adults. Ventricular tachycardia (VT) is when the heart rate exceeds 100 beats a minute. This can cause palpitations or a fluttering sensation [2] in the chest or even fainting. Figure 1 shows normal ECG signals.
Figure: 1 Schematic representation of ECG Signals
©IJRASET: All Rights are Reserved
389
range of methods was developed to detect and predict ventricular arrhythmia based on morphological [4], [5], spectral [6], or mathematical [7] features extracted from the ECG signal. Machine learning techniques, such as neural networks [8], Naïve Bayes and support vector machine (SVM) [9] have also been suggested as a useful tool to improve the detection efficiency. Heart disease prediction using VLSI (VHDL) is one of the most interesting and challenging tasks. The shortage of specialists and high wrongly diagnosed cases has necessitated the need to develop a fast and efficient prediction system. The proposed system uses the Xilinx ISE and ModelSim simulator for analyzing the ECG data.II. LITERATURE REVIEW
Recently, due to the huge and remarkable advancement in biotechnology, the development of a dedicated hardware system for accurate ECG analysis, classification and prediction in real time has become possible. The main requirements are low-power consumption and low-energy operation of hardware to have a longer battery life along with the small area for wearability. Many attempts succeeded to implement ECG signal processing system and classification systems in hardware. Shiu et al. [10] implemented an electrocardiogram signal processor (ESP) for the identification of heart diseases using the 90-nm area CMOS technology. The system employed an instrumentation amplifier and a low-pass filter (LPF) to remove the baseline wander and the power line interference forms the ECG and employed a time-domain morphological analysis for the ECG feature extraction and classification based on the evaluation of the ST-segment of ECG signal. The system was carried out in a field programmable gate array (FPGA) and consumed a total of 40.3-μW power and achieved a system accuracy of 96.6%. The main disadvantage of the system is that it uses a fixed search window with predefined size to locate S and T ECG-fiducial points, which is not suitably fitted for real-time scenarios. On the other hand, the implanted systems have been suggested as an alternate solution to the body wearable medical devices and attracted much interest in the field. The main benefit of such a unique approach is that the impact of a person’s motion and his daily routine activities is dramatically reduced. Chen et al. [11] proposed a syringe-implantable ECG system for arrhythmia disease classification based on the specific state-of-the-art 65-nm CMOS process. The system acquires the ECG signal, filters it, amplifies it, and digitizes it through the analog front-end (AFE) module which is more suitable for wearable devices. The AFE contains a low-noise instrumentation amplifier, a variable gain amplifier, and a successive approximation register analog-to-digital (A\D) converter. The arrhythmia disease detection is performed using two approaches. The first approach evaluates the variance of the RR interval of an ECG signal and applies a simple threshold technique to distinguish between normal and abnormal intervals. In the second approach, the ECG signal is transformed into the frequency domain, and the variation in the signal spectrum is analyzed. The design consumed 92 nW power at 0.4V for the DSP unit.
Xin Liu. [12] proposed, “A 457-nW Cognitive Multi- Functional ECG Processor”. In this, a multi-functional ECG signal processor for wearable and implantable real-time monitoring is presented. To enable an extremely long-term ambulatory monitoring system, some power saving techniques are proposed, including global cognitive clocking, pseudo-down sampling wavelet transform, adaptive storing, and denoising-based run-length compression techniques. An on-chip, low-complexity ECG signal analysis module is proposed to realize comprehensive analysis functions in a processor. Near the threshold, the circuit technique is applied to the whole system. Implemented in 0.18 μm CMOS, the proposed cognitive ECG processor consumes only 457 nW power at 0.5 V supply for real-time ambulatory monitoring. Compared with existing system designs, the presented ECG processor achieves the lowest power consumption.
A. Prediction VS. Detection
The only detection of heart disease is not enough to save people lives when there are a few minutes left with them. Prediction of heart disease is the solution for it. This paper proposes a design and simulation of a fully integrated low-powered ESP (Electrocardiogram Signal Processor) for the prediction of ventricular arrhythmia which performs prediction instead of detection. Previous arrhythmia related research was mainly focused on the detection of the main VT/VF condition on and after its occurrence [4]–[6], while this proposed solution performs accurate prediction of ventricular arrhythmia.
©IJRASET: All Rights are Reserved
390
Figure: 2 Prediction versus detection of ventricular arrhythmia with onset of VT/VFIII. METHODOLOGY
The proposed prediction system is a life savior for people who are susceptible to ventricular arrhythmia disease by alerting them for immediate attention to their medical condition to the doctor. This paper aims to design and develop a fully integrated biomedical processor that is capable of acquiring the ECG signal from the heart along with signal processing and analyzing it on the same chip without any external interaction used. Thus, the person would have an immediate alert to his health condition and that is very essential, especially in serious situations. Furthermore, the local processing of the ECG data would reduce the amount of the data to be transmitted to the system in case of any further check-up.
The proposed system has three main stages, which are the ECG pre-processing on ECG data, ECG feature extraction, and classification using the naïve Bayes classifier, as shown in Fig. 3. In the first stage, the ECG pre-processing of an ECG signal is responsible for sub three tasks: 1) ECG filtering using bandpass filter; 2) QRS complex detection; and 3) TPQS wave delineation. The architecture of the proposed ESP is shown in Fig. 2. The architecture includes the modules of the three stages. The processing of the data is done using a fixed point representation technique. The digitized ECG signal data are applied in series (from testbench in VHDL) at the input to the ECG pre-processing stage of a system with a resolution of 8 bit, while a variable number of bits were utilized in the different stages of this architecture to increase the accuracy and avoid truncations errors if present.
A. ECG Pre-Processing Stage
1) ECG Filtering: The block diagram of the ECG pre-processing stage is shown in Fig. 4. Bandpass filtering of filtering range 5MHz – 11 MHz of the raw ECG signal from standard database used in this paper is the first step in which the filter isolates the predominant QRS energy centered at central frequency, and attenuates the low frequencies of the TPQS waves, baseline drift, and higher frequencies associated with electromyography noise present and power line interference in the system.
©IJRASET: All Rights are Reserved
391
Figure: 4 Block diagram of pre-processing stage2) QRS Detection: To detect the QRS complex from the ECG signal, the PAT algorithm was used [13]. The PAT is a widely used and accurate method, which is based on the highest amplitude threshold technique exploiting the fact that R peaks of an ECG have higher amplitudes compared with other ECG wave peaks like P and T peaks [13]. With proper filtering of an ECG signal, this method is highly capable of detecting the R peaks from the ECG signal using two threshold levels Th and Thsb. After ECG data filtering, the PAT algorithm has four main steps. Differentiation of the filtered signal is used to distinguish the QRS complex of one ECG wave from other ECG waves by finding the highest slopes. Then, a nonlinear transformation is performed on the signal through squaring of the filtered ECG signal in which it is necessary to emphasize the higher frequencies present in the signal obtained from the previous step, which is normally characteristic of the QRS complex of an ECG signal. Then, the integration is done by a moving time window to extract additional features of the signal, such as the QRS complex width. Finally, adaptive high amplitude thresholds are applied to the averaged signal to detect maximum-R peaks. The PAT technique for peak detection is as shown in Fig. 5. Initially, the design reads the first 100 or 200 ECG samples from the memory i.e. SRAM, which stores the ECG samples of the averaged ECG signal. The maximum value among these samples is set as a first R peak and used to compute the initial value of the threshold, Th, which is set to 50% of the R-peak value. Then, the value of every incoming stored sample is compared with a threshold, Th, and only the sample value, which is greater than the threshold, Th, is used in the next step of the algorithm. If none of the recorded samples have a maximum value than Th, the PAT algorithm redefined the value of the threshold, Th and set it to 30% of the peak value; (Thsb). As soon as the demarcation of the ECG samples that exist in the QRS complex region is over, the highest value among them is set as a new R-peak of the signal, and the threshold is updated accordingly (50% of the last detected R peak from ECG signal). The process repeats itself by adjusting Th.
©IJRASET: All Rights are Reserved
392
3) TPQS Wave Delineation: Earlier systems were only done the T and P wave Delineation but the proposed system has done thedelineation of TPQS waves which is based on a novel technique proposed in [11]. The method is based on adaptive search windows along with different adaptive thresholds to accurately distinguish TPQS peaks from noise peaks in the ECG signal. In each ECG segment, the main QRS complex is used as a reference for the detection of TPQS waves in which two regions are demarcated with respect to R-R peaks.
Figure: 6 Computing T and P wave thresholds based on the previously detected R-peaks.
The technique of calculating the TPQS thresholds is shown in Fig. 6. By comparing the local maximum or/and the local minimum points in ECG signal with the thresholds, the waveform morphology of each wave is identified [positive monophasic, inverted, or biphasic (+, −)/ (−, +)] as shown in the above figure.
B. Feature Extraction Stage
The feature extraction of an ECG signal gives fundamental features (amplitudes and intervals) to be used in subsequent analysis. The complexity and accuracy of the feature extraction technique are considered as two main parameters in providing the best results in terms of cost and system performance. Therefore it can be suitable for wearable biomedical devices. For example, a technique reported in [15] is purely based on the ECG morphology technique and R-R intervals, leading to a simple and realizable detection system. In this paper, both the complexity and accuracy of a system are achieved at the same time. To do so, statistical analysis techniques are performed that are famous in the decision making in the biomedical research area to choose the accurate ECG features that would maintain a simple system and high accuracy.
Figure: 7 ECG features extraction from two consecutive heartbeats.
©IJRASET: All Rights are Reserved
393
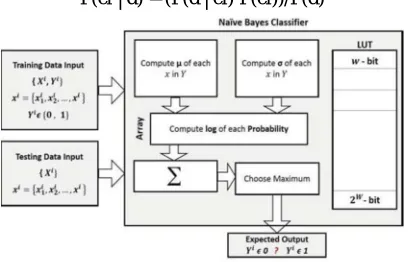
C. Classification Stage [image:6.612.205.409.203.334.2]The choice of classifier in this paper was the naive Bayes, it comes under machine learning. Machine learning concentrates on the development of computer programs that can access data and use it to learn for themselves. The naïve Bayes classifier is easy to build and useful for hardware implementation like FPGA. This method assumes naïve and strong independent distributions between the feature vectors from the signal, and this assumption was met in this proposed system since the entire extracted ECG signal features were independently analyzed and evaluated from the beginning. The architecture of the naïve Bayes classifier is shown in Fig. 8. The Bayesian classifier uses Bayes theorem to find out the probability of a signal data belonging to a particular class of given observations.
For a set of feature vectors as denoted by d and class ci, the Bayes theorem is given as, P(ci | d) = (P(d | ci) P(ci))/P(d)
Figure: 8 the architecture of Naïve Bayes Classifier
The log of the probabilities as shown in the above figure is calculated using a lookup table (LUT) whose entries are w-bit wide and 2w-bit deep where w = 8 bit. All entries in the LUT are represented in two’s complement format. For any unclassified new value present, then we build the Gaussian model by computing the above equation from the training data set for each class as shown. In our case, we have two classes only, expected output 0 and expected output 1, which simplifies the process. The pseudo code of both the training and testing algorithms is presented in Algorithms 1 and 2, respectively.
Figure: 9 Training and testing algorithms
IV. EXPERIMENTAL RESULTS
The ECG Signal Processor’s simulation results are shown using Xilinx and Modelsim simulation tools to verify the working of the design. In general, the end-to-end system was designed in VLSI, and a testbench for the ECG signal was created to simulate it by modeling the input data.
The input is a digitized ECG data sampled at 250 Hz sampling frequency. Furthermore, the system is verified to operate for different clock frequencies. Modelsim is used for simulation and while Xilinx tool is used for synthesizing, placing, routing, and estimating area and power consumption. GVim GUI tool is used for code or text editing.
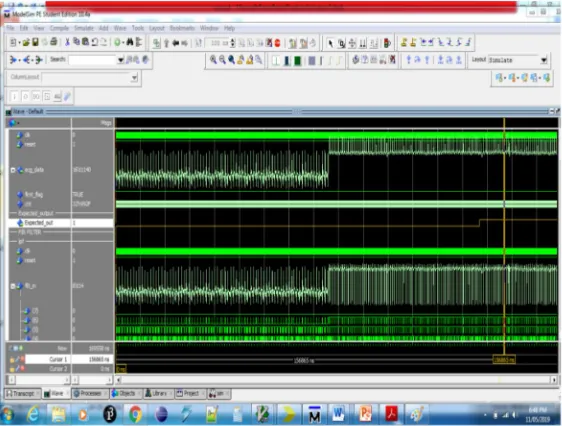
All reports like area, power, delay, etc. are generated in Xilinx software and below are the simulation results. Result 1 and result 2 gives actual predicted output for ventricular arrhythmia as the normal and abnormal status of a patient. The output is given by, Expected output = 0 --- Normal i.e. Ventricular Arrhythmia is not present.
[image:6.612.90.518.428.538.2]©IJRASET: All Rights are Reserved
394
Figure: 10 Predicted simulated output on ModelSim with the result as ventricular arrhythmia is not present.Figure: 11 Simulation output on Modelsim with ventricular arrhythmia is predicted.
Table 1: Prediction results for ventricular arrhythmia from simulated ESP:
Reference Accuracy of
Detection
Power consumed
The Complexity of a system
[10] 96.6% 40.3 μW Low
[11] NA 92 nW High
[12] NA 457nW Moderate
This work ~100%
(Prediction Accuracy)
0.022W Low
[image:7.612.139.420.289.502.2]©IJRASET: All Rights are Reserved
395
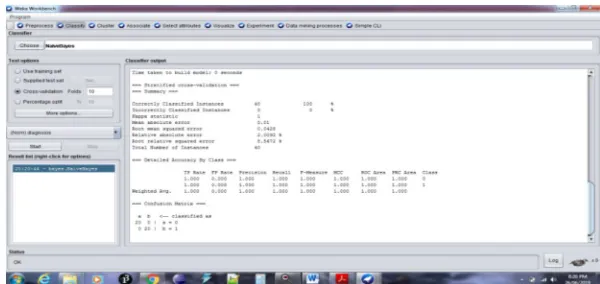
Fig. 13. Prediction accuracy of ESP checking using Weka 3.8.3. toolV. CONCLUSION
In this paper, the design, and simulation of a fully integrated ESP for the prediction of ventricular arrhythmia disease that combines a unique set of ECG feature with simple naïve Bayes classifier were proposed. The whole system is executed in VLSI using Xilinx and ModelSim software tool which produces greater accuracy in prediction. The proposed system acts as a life savior of the persons suffering from heart failure and alerts the patients about the ventricular arrhythmia before some serious conditions. The small area, low power, and high performance of the proposed simulated ESP make it suitable for inclusion in the system on chips targeting wearable mobile medical devices. The improvements that will be added to this design in the future could be summarized as follows: The above software module can use in any wearable healthcare hardware device as the main part for providing better real-time heart attack predicting systems and can save the many lives. The medical Healthcare Devices are:
1) FPGA based Medical Alert Bracelets.
2) Smart healthcare watches. 3) Fitness bands.
REFERENCES
[1] J. W. Schleifer and K. Srivathsan, “Ventricular arrhythmias: State oart,” Cardiol. Clin., vol. 31, no. 4, pp. 595–605, 2013.
[2] India.Mohd Afzan Othman ; Norlaili Mat Safri ; Rubita Sudirman "Characterization of Ventricular Arrhythmias in Electrocardiogram Signal Using Semantic Mining Algorithm", 2010 Fourth Asia International Conference on Mathematical/Analytical Modelling and Computer Simulation.
[3] C. J. Garratt, Mechanisms and Management of Cardiac Arrhythmias. London, U.K.: BMJ Books, 2001.
[4] P. de Chazal, M. O’Dwyer, and R. B. Reilly, “Automatic classification of heartbeats using ECG morphology and heartbeat interval features,” IEEE Trans. Biomed. Eng., vol. 51, no. 7, pp. 1196–1206, Jul. 2004.
[5] A. Amann, R. Tratnig, and K. Unterkofler, “Detecting ventricular fibrillation by time-delay methods,” IEEE Trans. Biomed. Eng., vol. 54, no. 1, pp. 174–177, Jan. 2007.
[6] O. Sayadi, M. B. Shamsollahi, and G. D. Clifford, “Robust detection of premature ventricular contractions using a wave-based Bayesian framework,” IEEE Trans. Biomed. Eng., vol. 57, no. 2, pp. 353–362, Feb. 2010.
[7] X.-S. Zhang, Y.-S. Zhu, N. V. Thakor, and Z.-Z. Wang, “Detecting ventricular tachycardia and fibrillation by complexity measure,” IEEE Trans. Biomed. Eng., vol. 46, no. 5, pp. 548–555, May 1999.
[8] J. Pardey, “Detection of ventricular fibrillation by sequential hypothesis testing of binary sequences,” in Proc. IEEE Comput. Cardiol.,Sep./Oct. 2007, pp. 573– 576.
[9] Q. Li, C. Rajagopalan, and G. D. Clifford, “Ventricular fibrillation and tachycardia classification using a machine learning approach,” vol. 61, no. 3, pp. 1607– 1613, Jun. 2013.
[10] B.-Y. Shiu, S.-W. Wang, Y.-S. Chu, and T.-H. Tsai, “Low-power low-noise ECG acquisition system with dsp for heart disease identification,” in Proc. IEEE Biomed. Circuits Syst. Conf. (BioCAS), Oct./Nov. 2013, pp. 21–24.
[11] Y.-P. Chen et al., “An injectable 64 nW ECG mixed-signal SoC in 65 nm for arrhythmia monitoring,” IEEE J. Solid-State Circuits, vol. 50, no. 1, pp. 375–390, Jan. 2015.
[12] Xin Liu, Jun Zhou, Yongkui Yang, Bo Wang, Jingjing Lan, Chao Wang, Jianwen Luo, Wang Ling Goh, Tony Tae-Hyoung Kim, and Minkyu Je,” A 457-nW Cognitive Multi-Functional ECG Processor”, IEEE Asian Solid-State Circuits Conference (A-SSCC), Volume: , Issue: , 2013.
[13] J. Pan and W. J. Tompkins, “A real-time QRS detection algorithm,”IEEE Trans. Biomed. Eng., vol. BME-32, no. 3, pp. 230–236, Mar. 1985.
[14] N. Bayasi, T. Tekeste, H. Saleh, A. Khandoker, B. Mohammad, and M. Ismail, “Adaptive technique for P and T wave delineation in electrocardiogram signals,” in Proc. IEEE 36th Annu. Int. Conf. Eng. Med. Biol. Soc., Aug. 2014, pp. 90–93.
[15] P. Tadejko and W. Rakowski, “Mathematical morphology based ECG feature extraction for the purpose of heartbeat classification,” in Proc. IEEE 6th Int. Conf. Comput. Inf. Syst. Ind. Manage. Appl. (CISIM), Jun. 2007, pp. 322–327.