Abstract—Voltage security is a crucial issue in power systems especially under heavily loaded condition. In the new scheme of restructuring, voltage stability problem becomes even more serious. In order to solve the kind of thorny problem, experts employ various methods for relieving congested difficulties. There are many new power-electronics-based devices using to solve the difficult problems recently. Unified Power Flow Controller (UPFC) is the most powerful device of these devices. A new model is proposed in this thesis to improve existing power-based model by using the Norton Equivalent Theorem. The proposed model can be integrated with the Equivalent Current Injection (ECI) power flow model easily. By ECI algorithm, it is much quickly and precisely to implement power flow calculations. By making use of modified particle swarm optimization (MPSO), the optimal location of UPFC in power system will be obtained. Finally simulation shows the optimal location and capacity of new UPFC with ECI model to enhance power system voltage stability by using MPSO. The proposed method demonstrates the improvement of voltage stability margin.
Keywords—Modified particle swarm optimization (MPSO), voltage stability, Unified Power Flow Controller (UPFC), Equivalent -Current-Injection (ECI)
I. INTRODUCTION
ower systems components mainly consist of generators, transmission lines, transformers, switches, active or passive compensators and loads. Power system networks are complex systems that are nonlinear, non-stationary, and prone to disturbances and faults. Reinforcement of a power system can be accomplished by improving the voltage profile, increasing the transmission capacity and others. Flexible AC Transmission System (FACTS) devices are an alternate solution to address some of those problems [1][5].
The FACTS devices can be categorized into three types, such as series controllers, shunt controllers and combined series-shunt controllers. In principle, the series controllers inject voltage in series with the line and the shunt controllers inject current into the system at the point of connection. The combined series-shunt controllers inject current into the system with the shunt part of the controllers and voltage in series in the line with the series part of the controllers.
In the case of voltage support, shunt FACTS devices, such as STATCOM and SVC are typically used [2-3]. This study is focused on the steady state performance of multiple
The Authors are with the Department of Electrical Engineering, National Sun Yat-Sen University, Kaohsiung 80424, Taiwan. (e-mail: [email protected]).
UPFC devices in the power system. Particularly, it is desired to determine their optimal location and capacity.
Traditional optimization methods such as mixed integer linear and non linear programming have been investigated to address this issue; however difficulties arise due to multiple local minima and overwhelming computational effort. In order to overcome these problems, Evolutionary Computation Techniques have been employed to solve the optimal allocation of FACTS devices.
This paper applied the ability of the modified particle swarm optimization (MPSO) efficiency. The objective of MPSO is to improve the searching quality of ants by optimizing themselves to generate a better result. This method can not only enhance the neighborhood search, but can also search the optimum solution quickly to advance convergence. The load flow analysis (commonly called load flow or power flow) is the basic tool for investigating power system state variables, and it is very important part of the system supervisory, planning and optimal operation. The unbalance three-phase load flows based on the Equivalent-Current-Inject (ECI) were applied successfully to the distribution system [4][7][8]. It is unable to apply the ECI model to the high voltage transmission systems, because of the voltage – controlled buses (PV Bus). In this a new power flow approach based on ECI model and Cartesian coordination is presented. PV Bus model were developed, and according to the network characteristics, the decoupled models were also proposed.
This paper introduces the application of MPSO for optimal location and capacity of a new UPFC with ECI model in the power system. It is organized as follows: Section II UPFC with ECI. Section III presents the basic concepts of modified particle swarm optimization (MPSO). In section IV the objective function to be optimized is described. In section V simulation results are presented. In section VI conclusions and future work are given.
II. UPFCWITHECIMODEL
A. UPFC Basic Concept
The Fig. 1 shows a conceptual representation of UPFC in a two-machine power system. In Fig. 1, the series branch of UPFC is modeled as a generalized synchronous voltage, and represented at the power system frequency by voltage phasor,
VCR, and its phase angle, ρ, in series with the transmission line.
Therefore, it is clear that the effective sending end voltage is modified by the UPFC series injected voltage in both magnitude and it phase angle, and as a result it is able to control, by adjusting the magnitude and the phase of VCR, the
transmittable active power as well as the reactive power. Moreover, in dynamic control applications, it is also able to provide power oscillation damping by real-time modulating
Optimal Location of FACTS for Voltage stability
using Modified Particle Swarm Optimization
Whei-Min Lin, Member, IEEE, Kai-Hung Lu,Chih-Ming Hong and Chia-Sheng Tu
P
the real power of the ac system. This is the result of its ability to alternatively insert a virtual positive and negative damping resistor in series with the line in accordance with the angular acceleration and deceleration of the disturbed generators.
In practical hardware implementations, the UPFC consists of two voltage sourced converters, as illustrated in Fig. 1. The two back-to-back converters, as labeled “Shunt Converter” and “Series Converter” in the figure are designed to be operated from a common DC link voltage supported by a DC storage capacitor. In normal operations, the phase angle of the series voltage can be chosen independently of the line current between 0 and 2π, and its magnitude can be varied between zero and a pre-specified maximum value. Therefore the real power can freely flow in either direction between the AC terminals of the two converters and each converter can also generate or absorb reactive power independently at its own AC output terminals to affect system voltages.
In the UPFC system, Series Converter, the series branch, operated as a SSSC, is used to perform the main control functions of a UPFC. It generates voltage, VCR, at the
system frequency controlled by a proper switching control technique. During the operation the voltage, VCR, is added to
the AC system terminal voltage, Vk, by the series connected injection series transformer, Tse. The transmission line current flows through this voltage source resulting in reactive and active power exchange between it and the ac system. The reactive power exchanged at the ac terminal is generated internally by the converter. The active power exchanged at the ac terminal is converted into dc power which appears at the dc link as a positive or negative active power demand.
Shunt Converter connected in shunt with the AC power system via a shunt transformer, Tsh, operated as a STATCOM,
[image:2.612.320.534.46.159.2]is used primarily to provide the real power demand of series converter at the common DC link terminal from the AC power system. Since shunt converter can also generate or absorb reactive power at its AC terminal, independently of the real power transferred to (or from) the DC terminal. It follows that, with proper controls, it can also fulfill the function of an independent STATCOM operations providing reactive power compensation for the transmission line and thus executing an indirect voltage regulation at the input terminal of the UPFC. It is important to note that there is a closed direct path for the active power negotiated by the action of series voltage injection through two converters back to the line, the corresponding reactive power exchanged is supplied or absorbed locally by series converter and therefore doesn’t have to be transmitted by the line. Thus, shunt converter can be operated at a unity power factor or controlled to have a reactive power exchange with the line independent of the reactive power exchanged by converter 2. Obviously, there is no reactive power flow through the UPFC dc link. In addition, the UPFC has the flexibility the control either its series or shunt branch or both toachieve a desired effect on the power flow transmitted between two buses.
Fig. 1. UPFC connected to power system
The UPFC active Pm and reactive power Qm are shown in (1)
and (2).
( ) sinδ
X V V V
P k CR m m
⋅ +
= (1) =( + )⋅ (1−cosδ)
X V V V
Q k CR R
m (2)
where X: is coupling transformer equivalent reactance. δ: θk-θm
In voltage control mode, the reactive current is automatically regulated to maintain the transmission line voltage at the point of connection to a reference value, with a defined droop characteristic. The droop factor defines the per unit voltage error per unit of reactive current within the current range of the converter. The convert supplies leading current to the AC system if the converter output voltage Vsh is made to lead the corresponding AC system voltage Vk. Then it supplies reactive power to the AC system by capacitive operation. Conversely, the converter absorbs lagging current from the AC system; if the converter output voltage Vsh is
made to lag the AC system voltage Vk then it absorbs reactive
power to the AC system by inductive operation. If the output voltage is equal to the AC system voltage, the reactive power exchanges.
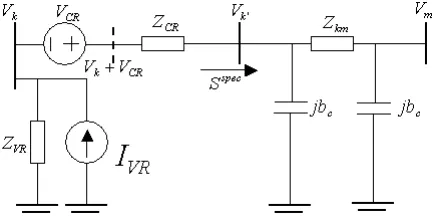
B. UPFC with ECI
[image:2.612.315.531.535.643.2]The UPFC can act as on equivalent voltage source series reactance. Voltage source can transform the current source by way of Norton Theorem of the π-circuit as shown in Fig. 2. It is important to note that there is a closed direct path for the active power negotiated by the action of series voltage injection through converter 1 and 2 back to the line.
Fig. 2 Transmission line equivalent model UPFC equivalent circuit diagram
According to Fig. 2 with ECI model inferential reasoning as follows in equations.
VR VR
VR V Z
I = / (3) That is the device does not generate or absorb active power internally. This constraint can be stated as:
* * 2 * * 2 * * VR k VR k VR VR k VR k VR VR k k k VR I V Z V Z V V Z V Z V V V I V S − = − = − = =
(5)
where IVR: shunt branch current VVR: shunt branch voltage
ZVR: shunt branch impedance equals RVR+jXVR PCR, PVR:are the active powers supplied or absorbed in
the series and shunt converters respectively.
According to the Newton-Raphson algorithm [4], the ECI mismatch equation with UPFC model can be written a new admittance matrix as
' ' , k spec k
k S V
I =
(6)
(
k CR k) (
CR CR)
kk V V V g jb
I ,'= + − ' ⋅ + (7) V
Y I new
matrix
= (8)
+ − − + − − + = CR k k CR CR CR CR CR CR CR CR CR CR k k k k V V V jb g jb g jb g jb g jb g I I I M M M M L L L L L L L L L L M L L L L L L L L L L L L L L L L M M M ' ' , ' 0 0 0 (9)
where gCR+jbCR=1/(ZCR), Sspec is the specified constant apparent power,
(
new)
matrix new
G Y
Y =Re
,
(
new)
matrix new
B Y
Y =Im .
III. MODIFIED PARTICLE SWARM OPTIMIZATION
A. Basic PSO
PSO, as a population-based algorithm, exploits a population of individuals to probe promising regions of the search space. The population is called a swarm and the individuals, particles. As the swarm iterates, the fitness of the global best solution improves (decreases for minimization problem). It is expected to happen that all particles being influenced by the global best eventually approach the global best. If the fitness does not improve despite however many runs the PSO is iterated, then convergence has been achieved. In the pioneering work of Kennedy and Eberhart in 1995, the particle position and velocity is defined by [9]:
) _ ( ) _ ( ] ][ [ ] ][ [ 2 2 ] ][ [ ] ][ [ 1 1 ] ][ [ 1 ] ][ [ k j i k j i k j i k j i k j i k j i X Gbest X rand C X Lbest X rand C V V − ⋅ ⋅ + − ⋅ ⋅ + = + (10) 1 ] ][ [ ] ][ [ 1 ] ][ [ +
+ = + k
j i k j i k j
i X V
X
where:
[i],[j]: Population number and particles number. k
j i
V[][]: Velocity of the particle in the kth iteration. k
j i
X[][ ]: Position of the particle in the kth iteration. k
j i Lbest
X_ [][]:Ith fitness best in the kth iteration.
k j i Gbest
X_ [][]: Population global best in the kth iteration.
C1, C2: Cognitive and Social component, respectively: they influence how much the particle’s personal best and
the global best (respectively) influence its movements.
rand1 , rand2:Uniform random numbers between 0 and 1.
B. Modified PSO
A weight factor, ωk, was added to the previousvelocity of
the particle. This allows control on the mechanism responsible for the velocities magnitude,which fosters the danger of swarm explosion and divergence, or fast convergence and being trapped in local minima. Thus, equation(10) can be re-writtenincluding the weight factor, ωk .
) _ ( ) _ ( ] ][ [ ] ][ [ 2 2 ] ][ [ ] ][ [ 1 1 ] ][ [ 1 ] ][ [ k j i k j i k j i k j i k j i k k j i X Gbest X rand C X Lbest X rand C V V − ⋅ ⋅ + − ⋅ ⋅ + ∗ = + ω (11) 1 ] ][ [ ] ][ [ 1 ] ][ [ +
+ = + k
j i k j i k j
i X V
X
The second challenge is to find a feasible weight factor that prevents prematurely because it affects the convergence and the ability of the swarm to find the optimum. A suitable value of ωk provides the desired balance between the global and
local exploration ability of the swarm and, consequently, improves the effectiveness of the algorithm. At the beginning, a large inertial weight is better because it gives priority to global exploration of the search space. It can be gradually decreased so as to obtain refined solutions. To introduce chaotic behavior, the iterator called Logistic Map is defined by the following equation:
) 1 ( 1 1 − − − ⋅
= k k
k f f
f µ (12)
Where µ is a control parameter and has a real value between 0 and 4. Despite the apparent simplicity of the equation, the solution exhibits a rich variety of behaviors. The value of µ determines whether fk stabilizes at a constant size, oscillates between a limited sequence of sizes, or behaves chaotically in an unpredictable pattern. And also the behavior of the system is sensitive to initial values of fk. Equation (12) displays chaotic dynamics when µ=4.0 and f0∉
{
0,0.25,0.5,0.75,1.0}
[18]. After some tests, the value chosen for ω0, µand f0 are 3.5, 4.0 and 0.65, respectively.Therefore, the weight inertial factor is calculated in every kth
iteration as:
(
log)
( )1 2
0
k
k f
k ⋅ + = ω
ω (13)
IV. OBJECTIVEFUNCTION
In such a power network, it is desirable to keep the voltage deviations between ±5% to avoid voltage collapses during faulty conditions. In general, if the load requirements increase, the voltages at the corresponding buses may drop below 0.95p.u. and consequently an additional voltage support is needed at that particular bus. In this study, the voltage support will be provided by a UPFC with ECI model, and its optimal location and capacity will be determined by using MPSO.
For instance, the IEEE 30-Bus system in Fig. 4 has 5 generators buses where voltage is regulated by the generator AVRs. These generator buses do not need a UPFC and are omitted from the MPSO search process. Also considering the topology of the system, the bus numbers are limited to the range from 1 to 30.
A. UPFC selection to install the location principle
1. Because UPFC are expensive, therefore the minimum device installed is searched for economic efficiency reasons.
2. Generator buses where voltages are regulated by the generator do not need UPFC installation.
3. Each bus is limited to the installation of one device. Installing more does not represent a significant effect. 4. If the bus voltage is above 0.95 p.u., then UPFC is not
installed.
[image:4.612.63.294.161.658.2]According to the above discussion, candidates Bus are shown in Table I.
TABLE I CANDIDATE BUS
Bus 15 18 19 20 21 22 23
Bus 24 25 26 27 28 29 30
B. Objective function:
The objective function of optimized power flow is to reduce cost of electricity as below:
Mim
∑
=
+ + =
G
i i
N
i
G i G i
Gi aP bP c
P F
1 2 )
( (14)
where the system constraints could compose of power balance constraints and inequation constraint.
i) power balance constraints:
= +
= + +
= +
= +
0 V V
-0 P P P
-0 I I
-0 I I
-2 cal 2 G
cal Load G
cal i spec i
cal r spec r
(15)
ii) inequation constraint:
≤ ≤
≤ ≤
≤ ≤
≤ ≤
≤ + ≤
≤ ≤ ≤ ≤
Sem Sem Sem
Sem Sem Sem
Shm Shm Shm
Shm Shm Shm
2 i 2 2 i 2 i
Gi Gi Gi
2 , 2 ji
2 , 2 ij
V V V
V V V
V ) (e V
P P P
S S S
θ θ θ
θ θ θ
i ij L
ij L
f S
(16)
where
ai, bi, ci: fuel cost coefficients of thermal plant i
V : voltage magnitude at bus i i
i f
e, : Real and imaginary part of voltage Vi at bus i Gi
P : Dispatchable active power at bus i
) ,
(i j : Transmission line connecting buses i and j 2 2
, ij ji
S S : Apparent power of transmission line (i,j) or (j,i) 2 2
, , , L ij L ji
S S : Apparent power limit of transmission line (i,j) or
(j,i) , where 2 2
, ,
L ij L ji S =S .
Vshm: The shunt voltage of UPFC Vs at candidate bus m θshm: The shunt phase angle of UPFC at candidate bus m Vsem: The series voltage of UPFC Vs at candidate bus m θsem: The series phase angle of UPFC at candidate bus m
V. SIMULATION RESULTS
A 30-Bus test system as shown in Fig. 3 is used for this paper. The test system consists of 5 generators and 24 PQ bus (or load bus). The simulation is run in MATLAB.
The problem to be addressed consists of finding the optimal location (bus number) and power rating (MVA) of STATCOM with ECI model. In this case the MPSO is able to find different options for both location and capacity of the STATCOM with the ECI model.
The solution found by MPSO, in terms of bus location and capacity for each MPSO unit, is shown in Table II.
[image:4.612.295.539.175.482.2]
Fig. 3 The 30-bus test system
TABLE II
SOLUTION FOUND BY MPSO
STATCOM Unit Location (Bus number) Capacity (MVA)
1 18 51.613
2 27 24.165
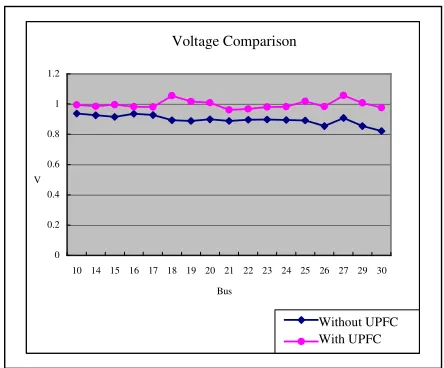
The best solution is found by inserting UPFC at bus 18 and bus 27. The power flow results, the voltage comparison with and without UPFC is show in Fig. 5 and Table III and IV. Table V show the comparison of MPSO, GA and EP. The system without the UPFC has 17 buses with voltage below 0.95 p.u.. Once the UPFC units are connected to buses 18 and 27 the voltage is improved.
Fig.4 Voltage comparison Voltage Comparison
0 0.2 0.4 0.6 0.8 1 1.2
10 14 15 16 17 18 19 20 21 22 23 24 25 26 27 29 30 Bus
V
without STATCOM with STATCOM
[image:4.612.310.532.528.712.2]TABLE III
BUS VOLTAGE FROM POWER FLOW RESULT Bus
number
Voltage p.u. w/o UPFC units
Voltage p.u. with UPFC units
10 0.93760 0.99402
14 0.92612 0.98576
15 0.91577 0.99541
16 0.93683 0.98307
17 0.92725 0.98056
18 0.89363 1.05500
19 0.88846 1.01710
20 0.89860 1.00930
21 0.88873 0.96099
22 0.89516 0.96705
23 0.89802 0.98157
24 0.89414 0.98194
25 0.89148 1.01800
26 0.85369 0.98311
27 0.90785 1.05700
29 0.85377 1.00760
[image:5.612.189.527.93.542.2]30 0.82140 0.97714
TABLE IV
POWER FLOW RESULT BYE ECI WITH UPFC
Branch P_Flow Q_Flow Branch P_Flow Q_Flow
From To (pu.) (pu.) From To (pu.) (pu.)
1 2 -0.68044 0.2175 12 13 -0.79467 0.04432 1 2 -0.35116 0.09517 12 14 0.79103 -0.2374 1 3 0.27365 -0.02928 12 15 -0.08746 0.0434 2 4 0.44589 -0.07865 12 16 -0.08118 0.13026 2 5 -0.25223 0.04623 14 15 0.54618 -0.4507 2 6 0.33446 -0.11717 15 18 -0.10062 0.10531 3 4 0.19825 -0.01425 15 23 -030458 -0.09909 4 6 -0.4522 -0.14921 16 17 -0.17958 0.11009 4 12 0.85641 0.05011 18 19 -0.10317 0.0917 5 7 0.56868 -0.13327 19 20 -0.10541 0.05531 6 7 -0.46065 0.26751 21 22 0.16808 -0.04415 6 8 -0.56931 0.16616 22 24 -0.35057 -0.04888 6 9 -0.04684 0.00025 23 24 0.24557 0.00232 6 10 0.83892 0.17528 24 25 -0.12804 0.05317 6 28 0.10794 0.00889 25 26 0.10838 0.02611 8 28 0.1504 -0.05301 25 27 -0.24029 0.0203 9 10 0.88214 0.37872 27 29 0.39985 -0.02452 9 11 -0.90104 0.08518 27 30 -0.28094 0.27535 10 20 0.10741 -0.04443 28 27 0.25664 0.00609 10 21 0.17221 0.09721 29 30 0.36615 -0.09617 10 22 0.91412 0.09331
TABLE V
ITERATIONS AND CPU TIMES BY MPSO
MPSO GA EP
Max_time(s) 869 712 1169
Min_time(s) 95 51 122
Avg_time(s) 420 583 506
Tine(s)
CPUtime/count 18.4 18.33 16.96
Worst 774.7703 774.8686 775.5145
Best 774.7575 774.7575 774.7575
Cost ($/h)
Average 774.7580 774.7600 774.7732
Max_count 44 39 69
Min_count 4 2 6
Count
Avg_count 23.14 31.82 29.86
Additionally, In order to study the effect of the load conditions in the optimal solution found by the MPSO, simulations are carried out by changing the load in each load
center in a range from 30% to 90%.
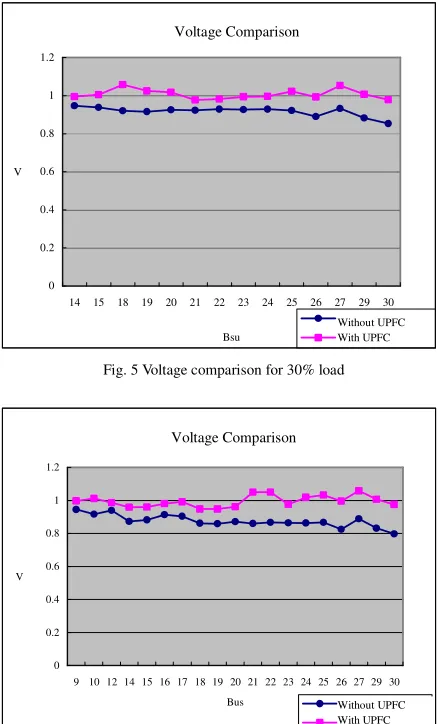
The Fig. 5 and Fig. 6 are the with and without UPFC voltage comparison for different load. In Fig. 6 and Fig. 7 is registered again a voltage improvement.
Voltage Comparison
0 0.2 0.4 0.6 0.8 1 1.2
14 15 18 19 20 21 22 23 24 25 26 27 29 30
Bsu V
[image:5.612.315.534.106.468.2]without STATCOM with STATCOM
Fig. 5 Voltage comparison for 30% load
Voltage Comparison
0 0.2 0.4 0.6 0.8 1 1.2
9 10 12 14 15 16 17 18 19 20 21 22 23 24 25 26 27 29 30 Bus
V
without STATCOM with STATCOM
Fig. 6 Voltage comparison for 90% load
The results obtained by the different load conditions are shown in Table VI and Table VII. Fig. 6 and Fig. 7 illustrate the relationship between the different load conditions. From Table VI and Table VII, the capacity of the UPFC does change under different load condition.
TABLE VI
LOCATION AND CAPACITY OF FIRST UPFC FOR DIFFRTRNT LOAD CONDITIONS
Load (%) Location (Bus) Capacity (MVA)
30 18 41.611
60 18 51.613
90 18 65.221
TABLE VII
LOCATION AND CAPACITY OF SECOND UPFC FOR DIFFRTRNT LOAD CONDITIONS
Load (%) Location (Bus) Capacity (MVA)
30 27 22.729
60 27 24.165
90 27 25.265
Without UPFC With UPFC
Without UPFC With UPFC
VI. CONCLUSIONS
The paper has demonstrated the application of MPSO for location and capacity of UPFC with ECI model in a power system considering at each bus the voltage constraints. The study is carried out for the aim of voltage security margin enhancement. Simulation results through an IEEE 30bus validate the efficiency of the optimal location and capacity of UPFC with the ECI model. The result shows the significantly voltage stability enhancement.
This paper presents a novel approach to OPF by using GA, and EP algorithms and enhancing the original PSO with adaptive velocity to the MPSO algorithm. The proposed approach utilizes the local and global capabilities to search for optimal cost reduction by OPF with UPFC. Compared with the results obtained by other methods in terms of solution quality, convergence rate and computation efficiency.
ACKNOWLEDGMENT
The authors would like to acknowledge the financial support of the National Science Council of Taiwan, R.O.C. for this study through the grant: NSC 100-3113-P-110-003.
REFERENCES
[1] Abdel-Aty Edrisl, “FACTS technology development: an update,” IEEE Power Engineering Review, vol.20, no.3, pp.4-9, Mar. 2000. [2] Sung-Hwan Song, Jung-Uk Lim, and sung-Il Moon, ”FACTS
Operation Scheme for Enhancement of Power System Security”, Power Tech Conference Proceedings, Vol. 3, June 2003, pp. 36 – 41. [3] Y.D. Valle, J.C. Hernandez, G.K. Venayagamoorthy, R.G. Harley,
“Multiple STATCOM Allocation and Sizing Using Particle Swarm Optimization”, Power Systems Conference and Exposition, Oct. 2006,
pp. 1884-1891.
[4] Whei-Min Lin, Cong-Hui Huang, Tung-Sheng Zhan, “A Hybrid Current-Power Optimal Power Flow Technique”, IEEE Transactions on Power System, Vol. 23, Feb. 2008, pp. 177-185
[5] Y. del Valle, J.C. Hernandez, G.K. Venayagamoorthy, and R.G. Harley, “Optimal STATCOM Sizing and Placement Using Particle Swarn Optimization”, Transmission & Distribution Conference, Latin America, Aug. 2006, pp.1-6.
[6] N. Boonpirom, K. Paitoonwattanakij, ”Static Voltage Stability Enhancement using FACTS”, The 7th International Power Engineering Conference, Vol. 2, Dec 2005, pp. 711 – 715.
[7] W. M. Lin, Y. S. Su, H. C. Chin, and J. H. Teng, “Three-Phase Unbalanced Distribution Power Flow Solutions with Minimum Data Preparation,” IEEE Transactions on power Systems, vol. 143, pp. 1178-1183, Aug. 1999.
[8] W. M. Lin, T. S. Zhan, and M. T. Tsay, “Multiple-frequency threephase load flow for harmonic analysis,” IEEE Trans. Power Syst., vol. 19, no. 2, pp. 897–904, May 2004.