JOURNAL OF FOREST SCIENCE, 63, 2017 (5): 227–238 doi: 10.17221/135/2016-JFS
Modelling individual tree diameter growth
for Norway spruce in the Czech Republic
using a generalized algebraic difference approach
Ram P. SHARMA
1*, Zdeněk VACEK
1, Stanislav VACEK
1,
Václav JANSA
2, Miloš KUČERA
31 Department of Silviculture, Faculty of Forestry and Wood Sciences, Czech University of Life Sciences Prague, Prague, Czech Republic
2 Department of Nature Conservation, Krkonoše Mountains National Park Administration, Vrchlabí, Czech Republic
3 Forest Management Institute, Brandýs nad Labem, Czech Republic
*Corresponding author: [email protected]
Abstract
sharma r.P., vacek Z., vacek s., Jansa v., Kučera M. (2017): Modelling individual tree diameter growth for norway spruce in the czech republic using a generalized algebraic difference approach. J. for. sci., 63: 227–238.
individual tree-based growth models precisely describe the growth of individual trees irrespective of stand complexity. These models are more useful than the stand-based growth models for effective management of forests. We developed an individual tree diameter growth model for norway spruce (Picea abies /linnaeus/ H. Karsten) using permanent research plot data collected from Krkonoše national Park in the czech republic. The model was tested against a part of the czech national forest inventory (nfi) data that originated from the western region of the country. Among various models derived by a generalized algebraic difference approach (GADA), the GADA model derived from the chapman-richards function best suited to our data. tree-specific parameters unique to each growth series, which describe tree-specific growth conditions, were estimated simultaneously with global parameters common to all growth series using the iterative nested regressions. The model described most of the variations in diameter growth for model calibration data (R2
adj = 0.9901, rMse = 0.5962),
leaving no significant trends in the residuals. A test against nfi data also confirms that the model is precise enough for predictions of diameter growth for ranges of site quality, tree size, age, and growth condition. The model also possesses biologically desirable properties because it produces the curves with growth rates and asymptotes that increase with increas-ing site quality. The GADA model is path-invariant and therefore applicable for both forward and backward predictions, meaning that the model can precisely predict diameter growth at any past ages of the trees.
Keywords: base-age invariant approach; chapman-richards function; global parameters; tree-specific parameters; iterative nested regression; national forest inventory
supported by the czech University of life sciences Prague, Projects no. iGA-B02/16 and no. iGA-B03/17.
effective management of the forest is possible only when reliable information on present and future for-est conditions is available. This information can be derived from forest growth and yield models. Mod-elling growth and yield has been an intrinsic part of forestry research for many years and still remains
may be operational either at stand or tree level. stand growth is often modelled using the mean attributes of structurally less complex stands, where these at-tributes are closer to individual tree atat-tributes (Pie-naar, rheney 1995; Huuskonen, Miina 2007). stand growth models do not precisely describe the growth dynamics of individual trees in the struc-turally more complex stands, where competitive situations largely differ among individual trees. The individual tree-based growth models are therefore aimed at a more precise description of individual tree growth in structurally more complex stands (Wykoff 1990; Pretzsch et al. 2002; Uzoh, oli-ver 2008; Bollandsås, næsset 2009). These mod-els offer a good possibility of exploring detailed man-agement alternatives as they allow ample flexibility in forecasting tree growth regardless of species, size, age, and site quality (Hasenauer 2006; Adame et al. 2008; Uzoh, oliver 2008; Pretzsch 2009; cre-cente-campo et al. 2010; subedi, sharma 2011).
Modelling the radial growth of individual trees (diameter or basal area growth) is often a starting point. As compared to individual tree radial growth models, the number of individual tree height growth models developed so far is lower. it is due to limited access of growth modellers to height growth data. individual tree diameter growth is more affected by competition than height growth. Thus, it would be relatively easier to describe competitive response to the growth of diameter in diameter growth models. A potential growth reduction approach is often used to obtain the expected diameter growth while devel-oping individual tree-based growth models. These models are either estimated simultaneously with a modifier for competition (Huang, titus 1995; Andreassen, tomter 2003; Uzoh, oliver 2008; Bollandsås, næsset 2009) or estimated separate-ly (Biging, Dobbertin 1992; Pretzsch et al. 2002; sharma, Brunner 2016). This study applies a tech-nique similar to the former one, where tree-specific parameters unique to each growth series are estimat-ed simultaneously with global parameters common to all growth series using the iterative nested regres-sions. This technique is suitable for parameter esti-mation of the base-age invariant model (cieszew- ski, Bailey 2000; Krumland, eng 2005).
The first base-age invariant model was derived us-ing an algebraic difference approach – ADA (Bai-ley, clutter 1974). This makes direct use of the measured diameter-age series without the need of interpolation or extrapolation to determine diame-ter at base age if diamediame-ter is not measured at that age (cieszewski, Bailey 2000; Krumland, eng 2005; nord-larsen 2006). Therefore, a base-invariant
model is the most suitable to permanent sample plot data (nord-larsen 2006; sharma et al. 2011). This only allows one parameter of the model to be subject-specific (tree-specific in our case), and the model derived by ADA may produce the anamor-phic curves which would have a common asymptote (cieszewski 2003). cieszewski and Bailey (2000) developed a more advanced base-age invariant model using generalized ADA (GADA), which al-lows more than one parameter to be subject-specif-ic. The GADA model produces polymorphic curves with multiple asymptotes, which are biologically desirable properties (cieszewski 2003). The GADA model can be used to fit short time-series data, even if there is no common base age in the time series
(García 2005; sharma et al. 2011). since GADA
is a mathematically robust and biologically realistic modelling approach, all models derived by GADA exhibit much appealing results. This is the reason why GADA has become a standard of developing dominant height growth models (Diéguez-Aranda et al. 2005; cieszewski et al. 2007; Martín-Beni-to et al. 2008; nord-larsen et al. 2009; sharma et al. 2011), stand basal area growth models (Barrio Anta et al. 2006; castedo Dorado et al. 2007), and tree biomass model (tang et al. 2017).
to the authors’ knowledge, GADA has been ap-plied only for stand-based growth modelling and tree biomass modelling, but not for individual tree-based growth modelling to date. Thus, we developed an individual tree diameter growth model applying GADA by which global parameters common to all growth series were estimated simultaneously with tree-specific parameters unique to each growth se-ries, using the iterative nested regressions (cieszew- ski et al. 2000; Krumland, eng 2005). We used two different data sets of norway spruce: one for model calibration and the other for model validation. The first data set originated from the permanent research plots located across the Krkonoše national Park, while the second data set originated from the czech national forest inventory. The proposed model can be applied for a precise prediction of future diam-eter growth that can be useful for estimating volume growth, biomass and carbon amounts of norway spruce forests in the czech republic.
MATERIAL AND METHODS
differ-ent invdiffer-entory designs and locations, and therefore these data had different characteristics and rep-resented different growing conditions from those of the model calibration data. We briefly describe these data in the following subsections.
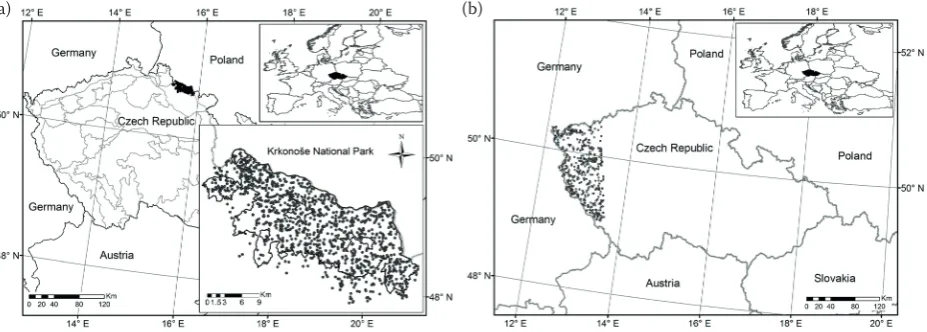
Model calibration data. We used model
calibra-tion data collected from norway spruce stands in the Krkonoše national Park in the czech republic (fig. 1a). The Park with an area of 363 km2 was first
declared in 1963 on the czech-Polish border in the Krkonoše Mountains (synonymous to Giant Moun-tains). The park area was extended to 550 km2 as a
protection zone in 1968. in 1992, this park was in-cluded as a bilateral Biosphere reserve in the list of the World network of Biosphere reserves. for-est stands are distributed at the altitudes between 400 and 1,370 m a.s.l. within the park (vacek, Hejc- man 2012), and precipitation, temperature and length of growing season vary with altitude and as-pect. Mean annual precipitation varies from 860 to 1,260 mm, mean annual temperature from 2.6 to 6.1°c, and growing season length ranges from 35 to 150 days (vacek et al. 2015). norway spruce is a dominant species covering about 87% of the area in the park, while european beech (Fagussylvatica lin-naeus), european larch (Larix decidua Miller), rowan (Sorbus aucuparia linnaeus) or silver fir (Abies alba
Miller) cover less than 12%, and the rest of the area is covered by mountain pine and other shrubby spe-cies. Based on the canopy layers, regeneration, dead wood stocks, damage, and developmental stages of stands, 830 circular permanent research plots (PrPs) of 500 m2 in size were established by following the
protocols developed by the field-Map technology of the ifer – Monitoring and Mapping solutions, ltd. (ifer 2016). All measurements were done with a spe-cific permission obtained from the park authority.
outside bark diameter at breast height (DBH) was measured for all trees with DBH ≥ 7 cm at two
per-pendicular directions with a metal calliper to the nearest 1 mm (hereafter termed as diameter). total height and height to the crown base for at least five trees of dominating species and at least one for each of the other tree species were measured using a laser vertex hypsometer (Haglöf sweden, A.B., sweden) to the nearest 10 cm. Ages for younger stands were derived from records of stand origin years and ages of mature stands were derived from the analysis of growth rings of the trees that were differentiated ac-cording to forest site types. The first measurement was done between May 2009 and December 2010, and the second measurement between June 2012 and July 2014, which resulted in about four years of growth period. extremely large negative increments and positive increments were excluded assuming that they were due to measurement or recording errors.
Model validation data. Model validation data
used in this study were a part of the czech national forest inventory (nfi) data that represent only the western region of the country (fig. 1b). forests in this region consist of mixed species stands where norway spruce is a dominant species. These stands are located at altitudes between 309 and 1,161 m a.s.l., and mean annual temperature and mean an-nual precipitation are 7.8°c and 675 mm, respec-tively. The circular sample plots with 500 m2 area
were established using the field-Map technology of the ifer – Monitoring and Mapping solutions, ltd. (ifer 2016), and sample plots are located in a 2 × 2 km grid. The first measurement was done be-tween 2001 and 2004 and the second measurement between 2010 and 2015, which resulted in about ten years of the growth period. We used only time-series data, i.e. only trees measured twice. This resulted in a selection of 514 sample plots that were used for our purpose. other tree and stand characteristics on each nfi sample plot were measured following the inventory protocols developed by the forest
Man-fig. 1. Permanent research plots in the Krkonoše national Park (a), czech national forest inventory sample plots (b)
[image:3.595.68.532.575.741.2]agement institute (fMi 2003). Details of sampling design and methods of measurement applied to nfi sample plots can be found in Kučera (2015).
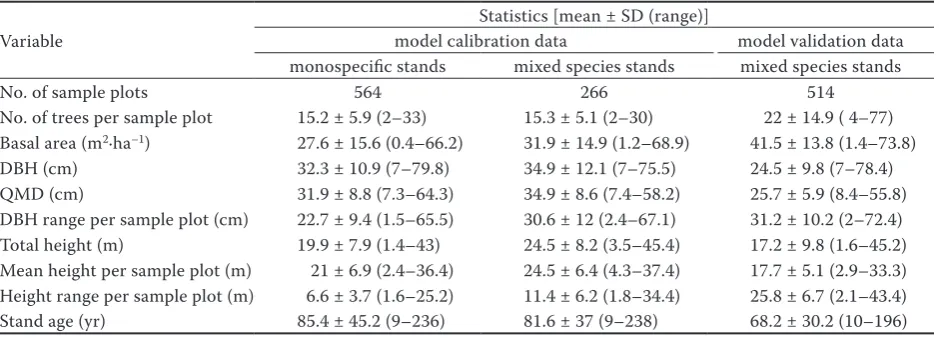
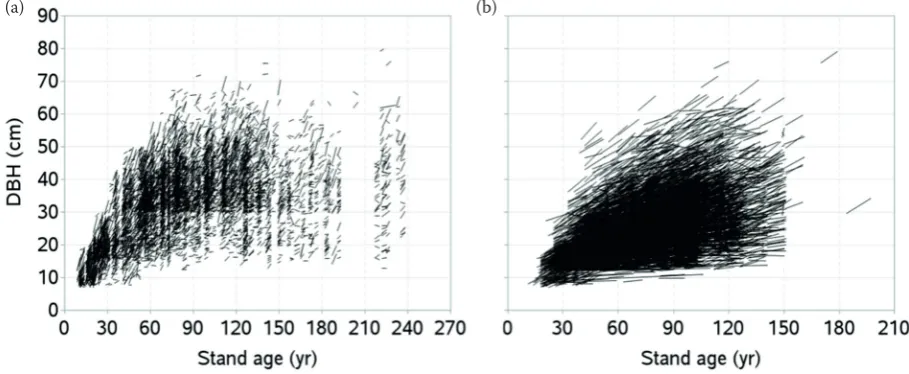
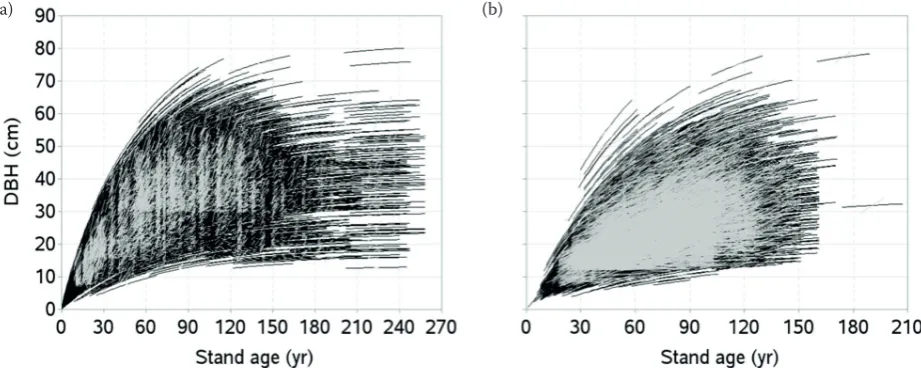
summary statistics of both model calibration and validation data are presented in table 1 and graphs of diameter-age series are presented in fig. 2.
Modelling approach. The GADA model fits
three-dimensional surfaces (stand age, diameter, subject-specific effects) in a way that directly esti-mates subject-specific effects (tree-specific effects in our case) as local parameters from the fitting proce-dures (cieszewski 2001; nord-larsen 2006). for long-time-series data, the base function is fitted by individual diameter-age series in order to establish a relationship between theoretical variable X (un-observed variable, also known as growth intensity factor) and tree-specific parameters (cieszewski, Bailey 2000). The X is a variable or a function of any number of variables that can include the effects of site quality, stand density or competitive interactions among the trees, and other physical and genetic fac-tors. The X is continuous, monotonic and relevant to the modelled dynamics; and it can describe the relative rates of change in terms of direct functional relationships among the variables. Details about this theoretical variable X and its relationship with other variables are available in the literature (cieszewski, Bailey 2000; cieszewski 2001, 2003; nord-lars-en 2006). The GADA-based diameter growth model is represented by a general functional form (eq. 1):
1 0 0 1, , ,
d f d t t b (1)
where:
d0, d1 – diameter measurements,
t0, t1 – age measurements, b – parameter vector.
This formulation consists of global parameters that are transformed from the relationship of tree-specific parameters and theoretical variable X (eqs 2–5). The resulting GADA model (eq. 6) is mathe-matically robust and biologically realistic (cieszew- ski, Bailey 2000). our data have a short time se-ries, i.e. it originated from two measurements, therefore it is not possible to formulate new GADA models as reported in the literature (cieszewski, Bailey 2000; cieszewski 2003; nord-larsen 2006; nigh 2015). We therefore selected previous-ly derived GADA models as our candidate models, which have frequently been used to fit dominant height-age or stand basal area-age trajectories of various tree species (Diéguez-Aranda et al. 2005; Barrio Anta et al. 2006; castedo Dorado et al. 2007; sharma et al. 2011).
Mostly GADA models are derived from the base functions of the fractional or exponential forms (cieszewski, strub 2008). The exponential form such as chapman-richards function (richards 1959; chapman 1961) is considered as an impor-tant paradigm to growth and yield modelling. in our case also, the GADA model derived from the chapman-richards function showed the smallest sum of squared errors, and therefore it was cho-sen for further analyses. Details of its derivation are presented below. The chapman-richards function we used as a base function is calculated as eq. 2:
3 1 1 exp 2a
d a a t (2)
where:
d – diameter of the tree,
t – age of the tree,
[image:4.595.64.534.575.744.2]a1, a2, a3 – asymptotic, rate and initial parameters of the function, respectively.
table 1. summary statistics of model calibration and validation data
variable
statistics [mean ± sD (range)]
model calibration data model validation data monospecific stands mixed species stands mixed species stands
no. of sample plots 564 266 514
no. of trees per sample plot 15.2 ± 5.9 (2–33) 15.3 ± 5.1 (2–30) 22 ± 14.9 ( 4–77) Basal area (m2·ha–1) 27.6 ± 15.6 (0.4–66.2) 31.9 ± 14.9 (1.2–68.9) 41.5 ± 13.8 (1.4–73.8)
The following parameters from eq. 2 were consid-ered as tree-specific parameters in our case (eqs 3 and 4):
1 exp
a X (3)
3
3 2 b
a b
X
(4)
where:
X – theoretical (unobserved) variable,
b2, b3 – global parameters.
substituting these assumptions into eq. (2) and solving for X with substitution of initial values (d0
and t0) for d and twould give out the algebraic solu-tions, as eq. 5:
2
0 1 Ψ Ψ 42 3
X b (5)
where:
X0 – solution of X for initial diameter and age, and accord-ing to characteristics of biological growth theory, the root most likely to be real and positive,
Ψ = Lnd0 – b2φ, φ = Ln[1 – exp (–b1t0)],
b1, b2, b3 – global parameters.
Then, the resulting GADA formulation would be as follows (eq. 6):
3 2
0
1 1 1 0
1 0
1 exp 1 exp
b b
X b t
d d
b t
(6)
in preliminary analyses, we evaluated the hy-pothesis whether tree-specific parameters (de-rived from a functional relationship of a theoretical variable X, eqs 2–5) were able to account for the variations caused by stand density or competition effects on diameter growth. for this, we included each of the sample plot-centred competition
mea-sures such as stand basal area – BA (m2·ha–1) and
stem number (N) per hectare as a covariate into the GADA model using b2 as a function of Z in eq. 6, as eq. 7:
2 α α1 2
b Z (7)
where:
α1,α2 ‒ parameters tobe estimated,
Z = BA or N.
However, no significant effect of each of them was found (P > 0.05). Another alternative such as
b1 or b3 as a function of Z was also evaluated, but the model did not converge either. This analysis showed that tree-specific parameters, which are unique to each growth series, were able to account for stand density effects or competition effects on diameter growth effectively. However, we were not able to evaluate the site quality effect using the site index. Alternatively, the sample plot dominant height calculated using the methods by sharma et al. (2011, 2016) was evaluated in a similar way as above, however its effect was not significant either.
in order to fit the GADA model (eq. 6), we pre-pared data structure of the form (eq. 8):
1 0
1 0
,
i i
i i
t t
d d
(8)
where:
d1i – diameter measurement at age t1i for a treei,
t0i – mean of age measurements for a tree i (i = 1, 2, 3, …, n, with n – number of trees),
d0i – mean of diameter measurements for a tree i (also considered as a tree-specific parameter).
[image:5.595.66.521.57.244.2]instead of using t0i as a starting value, any other value within the observed range could be used as
fig. 2. Diameter-age series: model calibration (a), validation (b) data (a) (b)
a starting value for estimating GADA models us-ing the iterative nested regressions (cieszewski et al. 2000; Krumland, eng 2005). We assumed that temporal or serial autocorrelation was insignificant because of too short time series, but spatial auto-correlations caused by several numbers of trees within the same sample plot could be strong. in or-der to compute the spatial weight matrix, which is used to deal with spatial autocorrelations through the application of autoregressive error-structured modelling, the location of each tree was neces-sary (Banerjee et al. 2014). However, no variable was available in our data to describe the location of each tree. We therefore applied the mixed effect modelling approach with a random effect param-eter added to b2 in eq. 6 while estimating model parameters. This approach is also assumed to de-scribe all kinds of within-sample plot variations and autocorrelations effectively (vonesh, chin-chilli 1996; Pinheiro, Bates 2000).
Model estimation and evaluation. We
esti-mated the GADA model (eq. 6) with restricted maximum likelihood in sAs macro nlinMiX (version 9.4, 2013) (sAs institute, inc. 2013) using an expansion-around-zero method (littell et al. 2006). tree-specific parameter (d0i) unique to each growth series, which describes the tree-specific growth condition, was estimated simultaneously with global parameters common to all growth series using the iterative nested regressions (cieszew- ski et al. 2000; Krumland, eng 2005; sharma et al. 2011). An iterative procedure involved: (i) esti-mation of global parameters of the GADA model (eq. 6), (ii) estimation of tree-specific parameters (d0i) using estimated global parameters in step (i), (iii) re-estimation of global parameters using new values of tree-specific parameters obtained in step (ii), (iv) procedures of step (ii) and (iii) were re-peated until the sum of squared errors changed by a negligible magnitude.
The fitted models were evaluated using the sum of squared errors, adjusted coefficient of deter-mination – R2
adj and root mean squared errors –
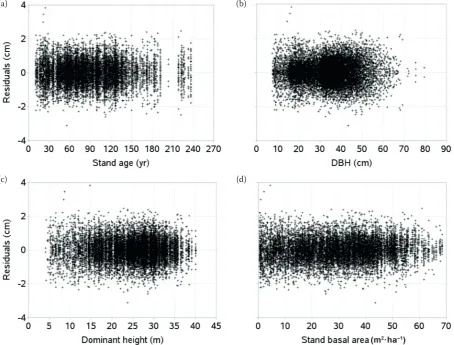
rMse (Montgomery et al. 2001). We examined the graphs of residuals plotted against each of the potential independent variables (stand basal area, quadratic mean diameter, stem number per hect-are, dominant height) and simulated diameter-age curves overlaid on the measured data. We car-ried out the model validation, which is one of the most important tasks in growth modelling, as this provides credibility and confidence about the pre-diction models, using independent data. Model validation with independent data provides
impor-tant information in addition to the respective fit statistics obtained from the model calibration data (Kozak, Kozak 2003; yang et al. 2004; sharma et al. 2011).
RESULTS
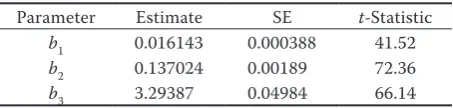
The model derived by GADA described most of the variations in diameter growth (R2
adj = 0.9901,
rMse = 0.5962) and all parameter estimates are highly significant (table 2). All tree-specific pa-rameter estimates (d0i) observed in the final step of the iterative procedures in the nest regressions were logical, reflecting true local conditions of tree growth. The model fits also showed no heterosce-dasticity problem in the residuals (fig. 3), indicating that GADA formulation using the chapman-rich-ards base function (considering tree-specific pa-rameters as a function of theoretical or unobserved variable X, eqs 2–5) best suited to our data. even though there were substantial variations among diameter growth across stand ages (fig. 2), where such variations also increased with stand age, more than 99% residuals confined to be within a narrow range (± 2 cm) around zero (fig. 3).
The test against validation data showed that the GADA model was able to precisely predict diam-eter growth for a wide range of ages and diamdiam-eters without any pronounced trends in the prediction errors (fig. 4). The prediction statistics calculated by the GADA model (eq. 6) using parameter es-timates in table 2 are promising (i.e. R2 = 0.9772,
rMse = 0.7583). Most of the observations were described adequately well by the model whereby more than 95% of prediction errors confined to be within a narrow range (± 2 cm) around zero. How-ever, the model was not able to precisely describe some extreme outlier observations.
The diameter curves simulated using parameter estimates in table 2 passed through each of the diameter-age trajectories in both model
calibra-table 2. Parameter estimates and fit statistics of eq. 6 (R2
adj = 0.9901, rMse = 0.5962, P < 0.0001)
Parameter estimate se t-statistic
b1 0.016143 0.000388 41.52 b2 0.137024 0.00189 72.36
b3 3.29387 0.04984 66.14
R2
adj – adjusted coefficient of determination, rMse – root
[image:6.595.305.532.650.704.2]tion and validation data even though there were significantly large variations in diameter growth across stand ages and site qualities (fig. 5). Both measured diameter-age trajectories in these data and simulated curves appeared relatively steeper in younger stands with better sites. However, the simulated curves appeared flatter for older stands (age > 150 years for model calibration data) than the
[image:7.595.66.521.57.402.2]measured diameter-age trajectories for most of the stands with all site classes. This resulted in slightly larger residuals and prediction errors for a number of older trees in both data sets. This could be much more clearly visible when residuals and prediction errors were examined by PrP. The model also pro-duced the curves with growth rates and asymptotes that increased with increasing site quality.
fig. 3. residuals of GADA model (eq. 6) using parameter estimates in table 2 for calibration data: stand age (a), diameter at breast height – DBH (b), dominant height (c), stand basal area (d)
fig. 4. Prediction errors of GADA model (eq. 6) using parameter estimates in table 2 for model validation data: stand age (a), diameter at breast height – DBH (b)
(a) (b)
(c) (d)
[image:7.595.72.514.560.731.2]DISCUSSION
Data used in this study cover a wide variation of site quality, tree size, stand density and age, and management regime. However, measurements were few for the stands aged above 120 years on the higher productive sites. Data were not available from the stands with ages between 190 and 220 years (fig. 2a) as they were destroyed by heavy in-dustrial pollution during 1979–1995, which caused a destruction of about 7,000 ha of spruce forests in the area. our data are a short time series and only few measurement or recording errors existed due to which some diameter-age trajectories appear to be steeper, even for very old stands on poorer sites (fig. 2a). We assumed these errors were random and would not affect the accuracy of the model.
The GADA model was able to describe most of the variations in diameter growth (table 2), leaving no significant trends in the residuals (fig. 3). This indicates that tree-specific parameters assumed in the GADA formulation are realistic, and therefore this model was able to describe variations caused by the effects of site quality, stand density or compe-tition, species mixture, and other physical and ge-netic factors (cieszewski, Bailey 2000). This was possible because of using an effective system of the model calibration such as iterative nested regres-sion (cieszewski 2002; Krumland, eng 2005; sharma et al. 2011; tang et al. 2017). This system involves the parameter estimation which is based on identifying individual trends of growth represented in the data (Bailey, clutter 1974; cieszewski et al. 2000; cieszewski 2003). This system, where regression assumptions are not violated, is both theoretically and practically desirable (cieszewski
et al. 2000). The trends of individual tree diameter growth are modelled by considering all individu-als’ responses in the data that follow similar func-tional forms with varying parameters of individuals (i.e. tree-specific parameters: d0i) and parameters common to all individuals (global parameters in eq. 6) (cieszewski 2003; Barrio Anta et al. 2006; sharma et al. 2011). Although repeated measure-ments are most accurate for estimating increment, the GADA model developed using stem analy-sis data may be more efficient and easy to operate (García 2005). However, it is noted that the GADA model, which possesses base-invariant properties, is also suitable to the permanent sample plot data as well (nord-larsen 2006; sharma et al. 2011). The GADA modelling overcomes the limitations of within-stand competition and limited biometric data and can be applied to study growth and bio-mass dynamics of the individual trees (cieszewski, Bailey 2000; nigh 2015; tang et al. 2017).
Generally, self-referencing models are usually es-timated using base-age-specific or base-age-invari-ant approaches. The former approach is more com-mon, which assumes that reference values (d0i) are arbitrarily selected as reference points (fixed), and only global parameters are estimated (cieszew- ski et al. 2007). However, the base-age invariant approach treats reference points (d0i in our case) as a tree-specific parameter that varies from tree to tree (Bailey, clutter 1974; cieszewski et al. 2000; sharma et al. 2011). Unlike the base-age specific model, which needs a common base age of all growth series, fitting of the base-age-invariant model is independent of the length of time series. The short time series (fig. 2a), which may or may not have a common base age (t0i), can be also
ef-fig. 5. simulated curves overlaid on the DBH-age series of model calibration (a), validation (b) data grey – observed growth series, black – simulated growth curves
[image:8.595.67.528.56.240.2]ficiently fitted (García 2005; sharma et al. 2011). Therefore, in recent years, GADA has been used as a standard approach in modelling forest growth and yield, such as modelling dominant height growth (Diéguez-Aranda et al. 2005; nord-larsen 2006; cieszewski et al. 2007; Martín-Benito et al. 2008; sharma et al. 2011; nigh 2015), stand basal area growth (Barrio Anta et al. 2006; castedo Dorado et al. 2007), and tree biomass (tang et al. 2017).
The curves produced by the GADA model pass through each of the measured diameter-age tra-jectories in both data sets (fig. 5), suggesting that individual tree-based GADA models are almost similar to properly localized tree-level mixed ef-fect models. The latter model produces the curves that pass through the measured diameter-age tra-jectories when both sample-plot and tree-level random effect parameters were estimated us-ing the empirical best linear unbiased prediction theory (vonesh, chinchilli 1996; Pinheiro, Bates 2000) and adjusted them to fixed parts of the mixed effect model, i.e. making a tree-specific model (yang, Huang 2011a, b). However, appli-cation of the two-level mixed effect model is more cumbersome and costly than the GADA model, be-cause the former model requires measurements of a response variable (i.e. diameter in our case) for a number of new sample trees on each sample plot to localize the mixed effect model. furthermore, cali-bration of a nonlinear mixed effect model is rather complex as it requires non-standard software and optimization methods (cieszewski, Bailey 2000; cieszewski 2003; nigh 2015). on the other hand, calibration of the GADA model can be done easily using simpler software (e.g. spreadsheet software, custom software) without the need of complex nonlinear optimization code (nigh 2015). The ap-plication of GADA model requires measurement of diameter d0 at age t0 to make a precise prediction of diameter for age t1. Both calibration and applica-tion of GADA model is therefore easier and predic-tion accuracy can be reasonably high as well. We dealt with a potential problem of autocorrelations because it was extremely important to secure unbi-ased estimates of the model parameters and vari-ances. When autocorrelations are not effectively accounted for, they cause statistical complication and invalidate the hypothesis tests (Huang, ti-tus 1995; vonesh, chinchilli 1996; Pinheiro, Bates 2000; cieszewski 2003).
The GADA model fits the data adequately well, taking into account most of the tree-specific and global effects, and is also able to produce
biologi-cally desirable curves (cieszewski 2001, 2002, 2003). However, the choice of the functional forms that establish relationships between tree-specific parameters and theoretical variable X in eqs 2–5 can affect the accuracy and behaviour of the GADA model (cieszewski, Bailey 2000; cieszewski 2003; nigh 2015). some GADA models that we evaluated were difficult to fit and did not produce any biologically sensible asymptotes. The chap-man-richards model did not exhibit any calibra-tion problems and resulted in biologically more sensible asymptotes (fig. 5). in general, if the mod-el is calibrated using short time-series data, pre-dictions might be largely biased when the model is applied for longer time steps. However, our model can be suitable to predict future diameter growth for longer time steps (i.e., up to 10 years) because this was confirmed by testing our model against nfi data, which have ten year’s growth period. nevertheless, longer time-series data are needed to develop growth models to include stand dynamics and development histories. in a couple of growth modelling studies, advantages and disadvantages of using sample plot inventory and long-term experi-mental plot data or stem analysis data or combi-nation of both have been discussed (von Gadow, Hui 1999; Pretzsch 2009; crecente-campo et al. 2010). furthermore, the effects of competition and facilitation, and abiotic stress on tree growth have also been analysed and described in various studies (Hasenauer 2006; Pretzsch 2009).
it would be interesting to test the growth models against longer time-series data that originate either from stem analysis or long-term research sample plots, which show clear growth trends caused by long-term changes in environmental conditions (Martín-Benito et al. 2008; sharma et al. 2011; yue et al. 2014). However, we could not do this be-cause of unavailability of such data. since the thin-ning effect on diameter growth can be substantial (Mäkinen, isomäki 2004; vospernik et al. 2015), we could not evaluate this either due to the lack of a variable describing thinning response in our data. The test against nfi data confirmed that our model is precise enough to predict diameter growth for different conditions from those represented by model calibration data. The proposed model is path-invariant, and therefore applicable for both forward and backward predictions (i.e. t0 –› t1 or
CONCLUSIONS
Given the data limitations (e.g. short time se-ries), the model derived by GADA described most of the variations in diameter growth, leaving no significant trends in the residual errors in either model calibration or validation data sets. This sug-gests that GADA is also applicable to develop an individual tree growth model that successfully ac-counts for all potential effects (tree-specific and global effects) and variations (random and deter-ministic variations). Diameter growth of individ-ual trees largely varies with site qindivid-uality and stand age, which is clearly exhibited by simulated curves (polymorphic curves with multiple asymptotes) produced by our GADA model. This model is thus able to describe the variations caused by the effects of site quality, stand density or competition, spe-cies mixture, and other environmental and genetic factors on diameter growth. The test against nfi data confirms that our model is precise enough for ensuring a high accuracy in the prediction. our model is path-invariant, and therefore applicable for both forward and backward predictions (i.e.
t0 –› t1 and t1 –› t0), meaning that the model can pre-cisely predict diameters at any past age of the trees. The proposed model can be used for the precise prediction of future diameter growth that, in turn, can be useful for estimating volume growth, and biomass and carbon amounts of norway spruce forests in the czech republic.
References
Adame P., Hynynen J., cañellas i., del río M. (2008): individual-tree diameter growth model for rebollo oak (Quercus pyrenaica Willd.) coppices. forest ecology and Management, 255: 1011–1022.
Amaro A., reed D., soares P. (2003): Modelling forest sys-tems. 1st ed. Wallingford, cABi Publishing: 432.
Andreassen K., tomter s.M. (2003): Basal area growth models for individual trees of norway spruce, scots pine, birch and other broadleaves in norway. forest ecology and Manage-ment, 180: 11–24.
Bailey r.l., clutter J.l. (1974): Base-age invariant polymor-phic site curves. forest science, 20: 155–159.
Banerjee s., carlin B.P., Gelfand A.e. (2014): Hierarchical Modeling and Analysis for spatial Data. 2nd ed. Boca raton,
chapman and Hall/crc: 584.
Barrio Anta M., castedo Dorado f., Diéguez-Aranda U., Álvarez González J.G., Parresol B.r., rodríguez soalleiro r. (2006): Development of a basal area growth system for maritime pine in northwestern spain using the generalized
algebraic difference approach. canadian Journal of forest research, 36: 1461–1474.
Biging G.s., Dobbertin M. (1992): comparison of distance-dependent competition measures for height and basal area growth of individual conifer trees. forest science, 38: 695–720.
Bollandsås o.M., næsset e. (2009): Weibull models for single-tree increment of norway spruce, scots pine, birch and other broadleaves in norway. scandinavian Journal of forest research, 24: 54–66.
castedo Dorado f., Diéguez-Aranda U., Barrio Anta M., Álvarez González J.G. (2007): Modelling stand basal area growth for radiata pine plantations in northwestern spain using the GADA. Annals of forest science, 64: 609–619. chapman D.G. (1961): statistical problems in dynamics of
exploited fisheries populations. in: neyman J. (ed.): Pro-ceedings of the 4th Berkeley symposium on Mathematical
statistics and Probability, Berkeley, June 20–July 30, 1960: 153–168.
cieszewski c.J. (2001): Three methods of deriving advanced dynamic site equations demonstrated on inland Douglas-fir site curves. canadian Journal of forest research, 31: 165–173.
cieszewski c.J. (2002): comparing fixed- and variable-base-age site equations having single versus multiple asymptotes. forest science, 48: 7–23.
cieszewski c.J. (2003): Developing a well-behaved dynamic site equation using a modified Hossfeld iv function Y 3 = (axm)/ (c + xm–1), a simplified mixed-model and scant subalpine fir
data. forest science, 49: 539–554.
cieszewski c.J., Bailey r.l. (2000): Generalized algebraic difference approach: Theory based derivation of dynamic site equations with polymorphism and variable asymptotes. forest science, 46: 116–126.
cieszewski c.J., strub M. (2008): Generalized algebraic dif-ference approach derivation of dynamic site equations with polymorphism and variable asymptotes from exponential and logarithmic functions. forest science, 54: 303–315. cieszewski c.J., Harrison M., Martin s.W. (2000): Practical
Methods for estimating non-biased Parameters in self-referencing Growth and yield Models. Plantation Man-agement research cooperative (PMrc) technical report 2000–7. Athens, University of Georgia: 11.
cieszewski c.J., strub M., Zasada M. (2007): new dynamic site equation that fits best the schwappach data for scots pine (Pinus sylvestris l.) in central europe. forest ecology and Management, 243: 83–93.
crecente-campo f., soares P., tomé M., Diéguez-Aranda U. (2010): Modelling annual individual-tree growth and mortality of scots pine with data obtained at irregular measurement intervals and containing missing observa-tions. forest ecology and Management, 260: 1965–1974. Diéguez-Aranda U., Burkhart H.e., rodríguez soalleiro r.
(Pinus radiata D. Don) plantations in north-western spain. forest ecology and Management, 215: 271–284.
fMi (2003): inventarizace lesů, metodika venkovního sběru dat. Brandýs nad labem, forest Management institute: 136. García o. (1994): The state-space approach in growth mod-eling. canadian Journal of forest research, 24: 1894–1903. García o. (2005): comparing and combining stem analysis
and permanent sample plot data in site index models. for-est science, 51: 277–283.
Hasenauer H.e. (2006): sustainable forest Management: Growth Models for europe. Berlin, Heidelberg, springer-verlag: 388.
Huang s.M., titus s.J. (1995): An individual tree diameter increment model for white spruce in Alberta. canadian Journal of forest research, 25: 1455–1465.
Huuskonen s., Miina J. (2007): stand-level growth models for young scots pine stands in finland. forest ecology and Management, 241: 49–61.
ifer (2016): field-map software and Hardware catalogue. Jílové u Prahy, institute of forest ecosystem research – Monitoring and Mapping solutions, ltd.: 50.
Kozak A., Kozak r. (2003): Does cross validation provide additional information in the evaluation of regression models? canadian Journal of forest research, 33: 976–987. Krumland B., eng H. (2005): site index systems for Major
young-growth forest and Woodland species in northern california. sacramento, california Department of forestry and fire Protection: 219.
Kučera M. (2015): národní inventarizace lesů České republiky. in: vašíček J., skála v. (eds): Xviii. sněm lesníků. národní inventarizace lesů, Hradec Králové, nov 10, 2015: 7–13. littell r.c., Milliken G.A., stroup W.W., Wolfinger r.D.,
schabenberger o. (2006): sAs for Mixed Models. 2nd ed.
cary, sAs institute: 814.
Mäkinen H., isomäki A. (2004): thinning intensity and growth of norway spruce stands in finland. forestry, 77: 349–364.
Martín-Benito D., Gea-izquierdo G., del río M., canellas i. (2008): long-term trends in dominant-height growth of black pine using dynamic models. forest ecology and Management, 256: 1230–1238.
Montgomery D.c., Peck e.A., vining G.G. (2001): intro-duction to linear regression Analysis. 3rd ed. new york,
Wiley: 641.
nigh G. (2015): engelmann spruce site index models: A comparison of model functions and parameterizations. Plos one, 10: e0124079.
nord-larsen t. (2006): Developing dynamic site index curves for european beech (Fagus sylvatica l.) in Denmark. forest science, 52: 173–181.
nord-larsen t., Meilby H., skovsgaard J.P. (2009): site-specific height growth models for six common tree species in Denmark. scandinavian Journal of forest research, 24: 194–204.
Pienaar l.v., rheney J.W. (1995): Modeling stand level growth and yield response to silvicultural treatments. forest sci-ence, 41: 629–638.
Pinheiro J.c, Bates D.M. (2000): Mixed-effects Models in s and s-PlUs. new york, springer-verlag: 528.
Porte A., Bartelink H.H. (2002): Modelling mixed forest growth: A review of models for forest management. eco-logical Modelling, 150: 141–188.
Pretzsch H. (2009): forest Dynamics, Growth and yield: from Measurement to Model. Berlin, springer-verlag: 664. Pretzsch H., Biber P., Ďurský J. (2002): The single tree-based
stand simulator silvA: construction, application and evaluation. forest ecology and Management, 162: 3–21. richards f.J. (1959): A flexible growth function for empirical
use. Journal of experimental Botany, 10: 290–300. sAs institute, inc. (2013): Base sAs 9.4 Procedure Guide:
statistical Procedures. 2nd ed. cary, sAs institute, inc.: 556.
sharma r.P., Brunner A. (2016): Modelling individual tree height growth of norway spruce and scots pine from national forest inventory data in norway. scan-dinavian Journal of forest research (in press). doi: 10.1080/02827581.2016.1269944
sharma r.P., vacek Z., vacek s. (2016): individual tree crown width models for norway spruce and european beech in czech republic. forest ecology and Management, 366: 208–220.
sharma r.P., Brunner A., eid t., Øyen B.H. (2011): Modelling dominant height growth from national forest inventory individual tree data with short time-series and large age errors. forest ecology and Management, 262: 2162–2175. subedi n., sharma M. (2011): individual-tree diameter
growth models for black spruce and jack pine plantations in northern ontario. forest ecology and Management, 261: 2140–2148.
tang X., fehrmann l., Guan f., forrester D.i., Guisasola r., Pé-rez-cruzado c., vor t., lu y., Álvarez González J.G., Kleinn c. (2017): A generalized algebraic difference approach allows an improved estimation of aboveground biomass dynamics of Cunninghamia lanceolata and Castanopsis sclerophylla forests. Annals of forest science, 74: 12. Uzoh f.c.c., oliver W.W. (2008): individual tree diameter
increment model for managed even-aged stands of pon-derosa pine throughout the western United states using a multilevel linear mixed effects model. forest ecology and Management, 256: 438–445.
vacek s., Hejcman M. (2012): natural layering, foliation, fertility and plant species composition of a Fagus sylvatica
stand above the alpine timberline in the Giant (Krkonoše) Mts., czech republic. european Journal of forest research, 131: 799–810.
vanclay J.K. (1994): Modelling forest Growth and yield: Applications to Mixed tropical forests. Wallingford, cABi: 312.
von Gadow K., Hui G.y. (1999): Modelling forest Develop-ment. Dordrecht, Kluwer: 213.
vonesh e.f., chinchilli v.M. (1996): linear and nonlinear Models for the Analysis of repeated Measurements. Boca raton, crc Press: 560.
vospernik s., Monserud r.A., sterba H. (2015): comparing individual-tree growth models using principles of stand growth for norway spruce, scots pine, and european beech. canadian Journal of forest research, 45: 1006–1018. Wykoff W.r. (1990): A basal area increment model for indi-vidual conifers in the northern rocky Mountain. forest science, 36: 1077–1104.
yue c., Kahle H.P., Kohnle U., Zhang Q., Kang X. (2014): Detecting trends in diameter growth of norway spruce on long-term forest research plots using linear mixed-effects models. european Journal of forest research, 133: 783–792. yang y.Q., Huang s.M. (2011a): comparison of different
methods for fitting nonlinear mixed forest models and for making predictions. canadian Journal of forest research, 41: 1671–1686.
yang y.Q., Huang s.M. (2011b): estimating a multilevel domi-nant height-age model from nested data with generalized errors. forest science, 57: 102–116.
yang y.Q., Monserud r.A., Huang s.M. (2004): An evalua-tion of diagnostic tests and their roles in validating forest biometric models. canadian Journal of forest research, 34: 619–629.
![Diethyl 2 [(5 methoxy 2 methyl 1 phenylsulfonyl 1H indol 3 yl)methylene]malonate](data:image/gif;base64,R0lGODlhAQABAIAAAP///wAAACH5BAEAAAAALAAAAAABAAEAAAICRAEAOw==)