Abstract— The objective of the present study was to
optimize the operating conditions in the separation of the total whey proteins from whey by continuous foam fractionation method using response surface methodology (RSM). The effects of the different process variables such as pH (X1) of proteins in feed, Gas flow rate, GFR (X2) of initial feed solution, protein: surfactant ratio, PSR (X3) and volumetric flow rate, VFR (X4) were investigated on the performance criteria of fractionation of raw processed whey. Four factors, three levels Box-Behnken design was used for the optimization procedure. Quadratic model regression equations and response surface plots correlate independent variables (X1, X2, X3 and X4) and dependent variables
(response) such as concentration of Foamate (Cf) ,
Enrichment ratio (Er), and percentage Recovery (%Rp) of
total whey proteins can be achieved easily. All the four factors had significant effects on the response variables. The model predicted that the optimized values of the factors (X1,
X2, X3, X4) were 5, 290, 1.5, 14 respectively. The predicted
responses were (concentration of Foamate, Enrichment ratio, and percentage Recovery) such as 6647.32, 13.27, and 78.02 respectively. Experiments were performed with the predicted values of factors.
Index Terms— Box-Behnken design, Optimization, Foam
separation, Whey.
I. INTRODUCTION
Whey protein is a rich source of essential amino acid [1]. In the cheese industry whey is produced as a byproduct containing substantial amount of proteins that are either added to dairy products or animal fodder or are discharged as waste, resulting in high BOD [2, 3]. Its importance was extensively realized by the industrialist and whey proteins had been recovered from whey by different methods. It is the renewed interest of scientists to improve the quality of product coupled with efficiency of cost [4]. Whey proteins impart some functional advantages such as enhancement of solubility, viscosity, gel forming capacity, foaming ability etc. to food products [5]. Functionality of whey proteins is influence by a number of compositional factors, physicochemical factors such as composition of proteins,
Manuscript received 1st December 2012.
Dr. G.Mukhopadhyay is with B.C.D.A College of Pharmacy & Technology, Kolkata-127, India.Email address: [email protected]
temperature, pH, ionic strength, concentration of Ca2+ and
other ions, molecules. Solubility of whey proteins vary in isoelectric pH (IEP) range, heat induced state [6]. Protein-surfactant complex show different hydrophobicity at a pH other than IEP and at IEP. Whey protein concentrate had been reported to have poor foaming stability, emulsifying ability at low concentration. So, foaming of whey is assisted by the surface active agents in foam fractionation experiment of separation to maximize enrichment [7]. The separation of proteins from a culture medium or whey is usually carried out by adsorption, ion exchange, chromatography and various membrane separation methods [8-10]. Foam fractionation in adsorptive bubble separation method offers several advantages over these methods e.g. ease of scale up, flexibility in continuous operation, very high separation efficiency and cost effectiveness [11]. So far, some investigators reported their works with pure concentrate and characterized the separation experiment ratio, % recovery of product, selectivity and separation ratio. Selective separation of protein from a multicomponent system was also made possible partially if there is wide gap in their isoelectric pH [12]. In the present work, processed native whey had been chosen to study separation by continuous foam fractionation and its optimization by the Response surface methodology. In the past decades, many have used RSM in food process design for the optimization of variables owing to the ease of operation, reliability and reproducibility of the model parameters as well as the availability of uses friendly computer software packages [13-14]. The RSM encompasses the use of experimental design, generation of polynomial equation, mapping of the responses over the experimental domain to determine optimum conditions to achieve desired responses [15]. Investigators get advantages by saving time in running of numerous experiments in order to achieve optimization when compared to conventional empirical method. RSM is more effective and precise if experiments are suitably designed. In this paper, we report application of RSM in the foam fractionation of native whey (waste) to study the role of pH(X1), GFR(X2) and PSR(X3) and VFR(X4) different
response variables such as concentration of Foamate, concentration of residual feed solution, enrichment ratio, percentage recovery, using Box-Behnken design. The model generate regression equations and response surface plots that correlate independent and dependent variables with these optimizes values, maximum % recovery can be achieved easily.
Statistical Analysis in Enrichment of Total
Whey Protein by Continuous Foam
Fractionation Method
II. MATERIAL AND METHODS 2.1. Experimental Design
The experimental design and analysis of date were performed with the help of design-expert (version 7.1.7. Stat-Ease, Minneapolis, USA) [16]. Factorial design based on multiple regression analysis involved the main, the quadratic and interactive effects that were caused by four independent operating variables. These variables generated few response variables. The four studied parameters were pH of feed solution (whey), Gas flow rate (GFR), Protein – Surfactant ratio (PSR) and Volumetric flow rate (VFR). Response variables were concentration of protein in foamate (Cf), enrichment ratio of protein (Er = Cf/Cr), and
percentage recovery of protein (%Rp). Following is the
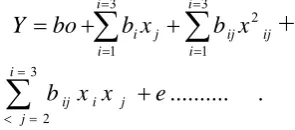
general model for response surface
3 1 3 1 2 i i i i ij ij ji
x
b
x
[image:2.595.51.199.257.322.2]b
bo
Y
+
.
...
3 2e
x
x
b
i ji j i ij
The Box-Behnken design was used for the optimization of all variables. ANOVA was performed with the coefficients related to block term, linear, quadratic and interactive terms. The model generated second order polynomials for different responses [17]. 2.2. Materials, instruments, equipment Whey was supplied by local confectionery, Sodium dodecyl sulfate (SDS) was obtained from Loba (India). Double distilled water was prepared at laboratory. The instruments used were UV spectrophotometer (UV 1700 Shimadzu), pH meter (satorius), Centrifuge (remi), Foam fractionation apparatus was supplied by local glass fabricator.
2.2. Quantification of whey protein
The protein fraction is determined by spectrophotometric analysis at wavelength 280 nm. The standard curve is prepared by whey protein powder and that is prepared by evaporating aqueous part of solvent from treated whey under controlled condition in a BOD.
2.3. Treatment of whey
Raw and fresh whey is collected from local confectionery. It is filtered through cheese cloth. The filtrate is centrifuged and filtered several times until absorbance becomes constant at wavelength of 280 nm. Thus fat is removed. Fat has detrimental effect on foaming property. Film rigidity decreases when fat competes with protein molecules. It is then diluted as per requirement and concentration is checked by spectrophotometer [18].
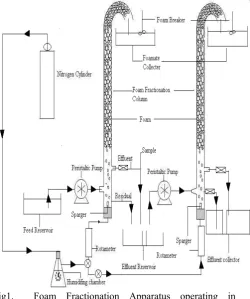
2.4. Foam fractionation
The experimental set up (Fig.1) consists of a glass column, nitrogen cylinder, humidifier (glass set), air flow meter, foam receiver and stirrer. The glass column is designed and fabricated by local fabricator. It is of 1 meter length having an internal diameter of 8 cm. A porous glass sparger (frit no. 3, pore size 16-40 micron) is fitted on the top of a small glass tube and that is attached at the bottom of column by standard joint. Feed was prepared by suitable dilution of
stock whey to get the desired feed concentration. Required quantity of Sodium Lauryl Sulphate (SLS) was added to the feed to get the desired PSR , it was then allowed to mix uniformly with the help of an ultrasonic cleaner. Then the pH of the feed was measured and adjusted as per requirement. The foam fractionation column was then filled with 1 lit. of feed solution and Nitrogen gas was passed through the feed at desired gas flow rate (GFR). Feed was introduced from outside through an inlet in the column with the help of a peristaltic pump to maintain a constant volumetric flow rate, and the effluent is constantly collected through a outlet from other side, the flow rate of the outgoing effluent is same as the incoming feed. Bubbles are formed initially which then rises to the top of the column leading to formation of foam. The foam is continuously collected for required period of time. Foam was then allowed to stir using a stirrer until the foam breaks down to form foamate. The effluent was collected in a reservoir, the residual was also collected, then the collected material (effluent) was pumped into the second column, where it acts as feed for the second column. When the work with the first column is finished the gas flow into the first column was stopped and the valve is opened so that the gas now flows into the second column and samples were withdrawn at regular intervals assessed. After steady state was achieved, the effluent showed constant concentration. Whole procedure is repeated again as mentioned above. The volume of foamate is measured, suitably diluted and absorbance is noted. The total effluent and residual was collected and absorbance was noted, the total input amount, output amount, loss amount, recovery %, enrichment ratio were also calculated. Samples are analyzed by spectrophotometer. Data are presented in Table 2 as the average of experimental results.
Table 1. The levels of variables chosen for the trials at fixed (Ci=500µg/ml)
Level/factor -1 0 +1 X1, pH
X2, GFR (cm3/min)
X3, PSR
X4, VFR (ml/min)
2 5 8
250 290 330 1.25 1.5 1.75
12 14 16
III. RESULTS AND DISCUSSIONS
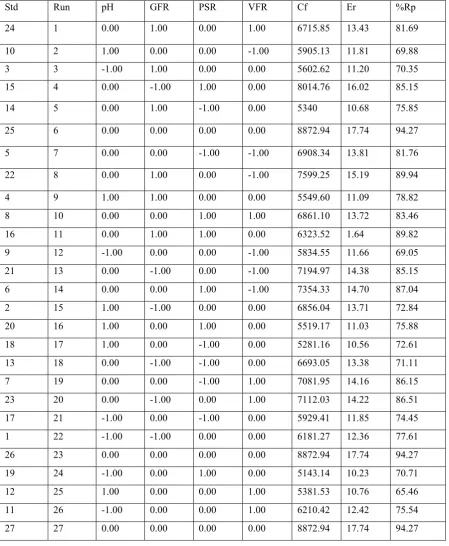
Table 1 represents levels of design parameters that were treated for experimental design. Operating variables used in the experiments, pH, GFR, PSR, VFR were presented in coded form, responses variables (Cf, Er, & %Rp) were
Table II: Experimental design of variables
Std Run pH GFR PSR VFR Cf Er %Rp
24 1 0.00 1.00 0.00 1.00 6715.85 13.43 81.69
10 2 1.00 0.00 0.00 -1.00 5905.13 11.81 69.88
3 3 -1.00 1.00 0.00 0.00 5602.62 11.20 70.35
15 4 0.00 -1.00 1.00 0.00 8014.76 16.02 85.15
14 5 0.00 1.00 -1.00 0.00 5340 10.68 75.85
25 6 0.00 0.00 0.00 0.00 8872.94 17.74 94.27
5 7 0.00 0.00 -1.00 -1.00 6908.34 13.81 81.76
22 8 0.00 1.00 0.00 -1.00 7599.25 15.19 89.94
4 9 1.00 1.00 0.00 0.00 5549.60 11.09 78.82
8 10 0.00 0.00 1.00 1.00 6861.10 13.72 83.46
16 11 0.00 1.00 1.00 0.00 6323.52 1.64 89.82
9 12 -1.00 0.00 0.00 -1.00 5834.55 11.66 69.05
21 13 0.00 -1.00 0.00 -1.00 7194.97 14.38 85.15
6 14 0.00 0.00 1.00 -1.00 7354.33 14.70 87.04
2 15 1.00 -1.00 0.00 0.00 6856.04 13.71 72.84
20 16 1.00 0.00 1.00 0.00 5519.17 11.03 75.88
18 17 1.00 0.00 -1.00 0.00 5281.16 10.56 72.61
13 18 0.00 -1.00 -1.00 0.00 6693.05 13.38 71.11
7 19 0.00 0.00 -1.00 1.00 7081.95 14.16 86.15
23 20 0.00 -1.00 0.00 1.00 7112.03 14.22 86.51
17 21 -1.00 0.00 -1.00 0.00 5929.41 11.85 74.45
1 22 -1.00 -1.00 0.00 0.00 6181.27 12.36 77.61
26 23 0.00 0.00 0.00 0.00 8872.94 17.74 94.27
19 24 -1.00 0.00 1.00 0.00 5143.14 10.23 70.71
12 25 1.00 0.00 0.00 1.00 5381.53 10.76 65.46
11 26 -1.00 0.00 0.00 1.00 6210.42 12.42 75.54
Concentration (Cf) of protein in foamate solution-
It is expressed by the following model equation. Y1
=8872.94 34.06A – 410.06B +165.18C 119.47D 181.95AB +256.07AC 224.87AD 84.55BC 200.11BD -166.71CD -2120.26A2 -896.65B2 -1238.28C2 -774.59 D2,
The above quadratic model was written from the values obtained. It showed R2 value as 0.9041. This implies 2.23%
of the total variation could not be explained by the model whereas the model was found significant (p=0.0004). Enrichment of protein in foamate-
Y2
=17.74-0.63A-0.83B+0.32C-0.24D-0.37AB+0.52AC-0.45AD-0.17BC-0.4BD-0.33CD-4.24A2-1.79B2-2.48C2 -1.55D2.
After sequential elimination of the non-significant parameters (p >0.05) from Table 4, the above equation suitably described Er. Er values determined in the present
study ranged between 10.23 – 17.85. The model had correlation coefficient (R2) of 0.9040, that indicated only
3.61% could not be explained by the model. Model was significant with F-value of 8.47 (p =0.0004 <0.05). With the increased of gas flow rate both A and B showed increasing effect on Er, though effect of pH (A) on separation of
protein was found maximum at pH 5 in comparison to pH 2 and 8. Er increased in the order of pH 5> 2 > 8.
Concentration of protein on percentage recovery-
Y3= 94.27 – 0.18A+ 0.68B + 2.51C – 0.33D + 3.31AB +
1.75AC -2.73AD – 0.018BC – 2.40 BD – 1.99 CD – 16.19A2 – 4.73 B2 – 6.09 C2 -5.13D2.
In the above model Y3 represents percent recovery of
protein from whey waste feed by the foam fractionation method. Y3 (%Rp) was best described by the regression
equation which was obtained after sequential omission of the non-significant terms (p >0.05, Table 4). The model could explain 79.99% of the behavior of %Rp. F-value (4.87) proved the model was significant.
Optimization of the operating variables in foam fractionation experiment-Software generated number of solutions from which several were picked up. Response variables from solution were presented as predicted variables were used and foam fractionating experiment was run again. The experimental response variables were compared with the predicted values and relative percent error was presented in Table 5 [23]. There was very less deviation from the predicted values. The present work gave satisfactory result at laboratory scale foam fractionation of whey in continuous mode. Thus, the optimized values of Cf,
Er, %Rp were found 5143.14-8872.94 mcg/ml, 10.23- 17.74
and 65.46-94.27 respectably.
Fig1. Foam Fractionation Apparatus operating in Continuous Mode
[image:4.595.312.563.87.387.2]Fig 2 Two dimensional isoresponse curve of foamate (Cf).
Fig 4. Two dimensional isoresponse curve of Enrichment (Er).
[image:5.595.57.278.236.396.2]Fig 5. Three dimensional surface effect of A(pH) and B(GFR) on the response variablersY2(Er).
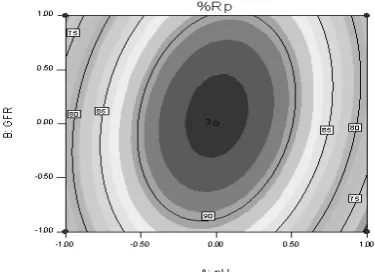
Fig 6. Two dimensional isoresponse curve of Percentage recovery (% Rp).
Fig 7.Three dimensional surface effect of A(GFR) and B(pH) on the response variablersY3 (%Rp).
IV. CONCLUSION
Optimization of foam fractionation of proteins from whey in continuous mode had been successfully performed using Box- Behnken method of RSM. Operating variables were modeled and expressed in terms of leveled factors. It reduces number of experiments to a minimum. Surface plots confirmed the role of pH of feed at isoelectric point and application of foam fractionation at restricted level of Ci.
ACKNOWLEDGMENT
The authors acknowledge to BCDA College of Pharmacy & Technology, Kolkata, India, Jadavpur University, Kolkata, India. and Hanseo University, Korea, for their cooperation to make the experiment success.
REFERENCES
[1]. Hall, W.L., Millward, D.J., Long, S.J., Morgan, L.M., 2003, “Casein and whey exert different effects on plasma amino acid profiles, gastrointestinal hormone secretion and appetite”, Brit. J. Nutr., 89, pp. 239-248.
[2]. Pearce, R.J., 1991, “Applications for cheese whey protein fractions”, Food. Ress. Quartly., 51(1/2), pp.74-85.
[3]. De Wit, J.N., 1998, Murschall Rhone-poulenc AwardLecture, “Nutritional and functional characteristics of whey proteins in food products”, J. Dairy. Sci., 81(3), pp. 597-608.
[4]. Pearce, R.J., 1995, “Enriched whey protein fractions and Method for the production”, Thereof. U.S. Patent. 5(455), pp. 331.
[5]. Fuda, E., Bhatia, D., Pyle, D.L., Jauregi. P., 2005, “Selective Separation of β-lactoglobulin from sweet whey using CGAs generated from cationic surfactant (CTAB)”, Biotech. and Bioengi., 90(5), pp. 531-542.
[6]. Hossain, Md.M., Saleh, Z., 2001, “Enrichment of α -lactalbumin in whey permeate solution by a semi batch foaming process”, Aust. Biotech., 11(2),pp. 29-31.
[7]. Brown, A.K., Kaul, A., Varley, J., 1999, “Continuous foaming for protein recovery pat-II. Selective recovery of proteins from binary mixtures”, Biotech and Bioeng., 62(3),pp. 291-299.
[8]. Mass, K., 1974, “Adsorptive bubble separation techniques”, In:Korte F, editor. Methodicum chimicum vol. la. New York: Academic Press. pp 165-171.
[9]. Uraizee, F., Nrsimhan, G., 1990, “Foam fractionation of protein and engymes-II. Performance and modeling”, Engyme. Microb. Technol., 12,pp. 315-316.
[10]. Lemlich, R., editor. 1972, “Adsorptive bubble separation techniques”, New York: Academic Press. pp 133-143. [11]. Maruyama, H., Suzuki, A., Inoue, N., 2006, “Enrichment in
Axial direction of aqueous foam in continuous foam fractionation”, J.of biochem. engin., 30,pp. 253-259.
[12]. Suzuki, A., Yasuhara, K., Seki, H., Maruyama, H., 2002, “Selective foam of binary protein solution by SDS complexation method”, J. Colloid and Interface Sci., 253,pp.402-408.
[13]. Guerrero, S., Alzamora, S.M., Gerschenson, L.N., 1996, “Optimization of a combined factors technology for preserving banana puree to minimize colour changes using the response surface methodology”, J. food. Engi., 28,pp. 307-322.
[image:5.595.61.249.444.580.2][15]. de la Maza, A., Marich, A.M., Coderch, L., Baucells, J., and Parra, J.L. 1996, “Lipid composition influence on the surfactant-induced release of the contents in liposomes formed by lipids modeling the stratum corneum”, Colloids & Surfaces A-Physicochemical & Engineering Aspects., 113, pp.259-267.
[16]. Shaoo, B.K., Gowda, V., Ghosh. A., Chatterjee, B., Bose, A., Chakraborty, U., Das, A., and Pal, T.K., 2009, “Statistical Evaluation of Hydroxypropyl methylcellulose Influence on Drug Release Pattern of a Gastro retentive Floating Drug Delivery System”, Pharm. Ind., 71(8), pp. 1423-1428.
[17]. Boea, A., and Leueuta, S.E., 1998, “Optimization of propranalal hydrochloride sustained-release pallets using Box-Behnken design and desirability function”.Drug Development & Indust. Pharm., 24, pp. 145-155.
[18]. Fuda, E., Jauregi, P. and Pyle, D.L., 2004, “Recovery of Lactoferrin and Lactoperoxidase from Sweet Whey Using Colloidal Gas Aphrons (CGAs) Generated from an Antibiotic Surfactant AOT”., 20 , pp. 514-525.
[19]. Brown, A.K., Kaul, A., Varley, J., 1999, “Continuous foaming for protein recovery”, Biotech and Bioeng., 62(3), pp. 278-290.
[20]. Saleh, Z.S., Hossain, Md.M., 2001, “A study of the separation of proteins from multi-component mixture by a semi-batch foaming process”, Chem. Engi. and precessing., 40(4), pp. 371-378.
[21]. Du, L., Prokop, A., and Tanner, R.D., 2002, “Effect of bubble size on foam fractionation of ovalbumin”, Appl. Biochem. and biotech., 98-100(1-9), pp. 1075-1091.
[22]. Ekici, P., Backleh-sohrt, M., Parlar, H., 2005, “High efficiency enrichment of total and single whey proteins by pH controlled foam fractionation”, Inter. J. food. Sci. and nutria., 56(3), pp. 223-229.