Abstract—The effects of signal modality (visual and
auditory), hand condition (crossed and uncrossed), and head orientation (upright, right_90, left_90, and left_back) on response performance were examined in this study. The results showed all the factors significantly affected the reaction time of participants and there was an interaction effect between signal modality and head orientation. Responses for visual signals were significantly faster than those for auditory signals, and responses made with uncrossed hand were superior to those with crossed hand. On head orientation, upright orientation produced the fastest reaction time, while reaction time for head rotated 90˚ right (right_90) was significantly faster than that for head rotated 90˚ left (left_90) and rotated left backward (left_back). Regarding the significant interaction effect between signal modality and head orientation, processing time for visual signals was always faster than that for auditory signals. Such modality superiority increased to a larger extent under the left_90 and left_back head orientations. The findings in this experiment provide some practical ergonomics recommendations for improving control console design in terms of signal-response layout, stimulus-hand arrangement, head orientation, and methods of presenting visual and auditory signals.
Index Terms—Spatial S-R compatibility, head rotation,
visual modality, auditory modality, modality shifting effect
I. INTRODUCTION
N everyday life, human receive most information with their eyes and the visual modality usually dominates auditory modality in many applications [1]. However, when there comes an influx of visual information for processing, presenting some of them in auditory modality can be very effective in reducing visual workload [2, 3]. Auditory signals can convey spatial information beyond the reach of visual field [4, 5]. They are also superior to visual signals for warning in particular in monitoring tasks in which operators do not need to look at a particular location all the time [6]. Although auditory signals have the advantages mentioned above, the details of the information it can
Manuscript received Dec 12, 2013; revised Jan 9, 2014.
The work described in this paper was fully supported by a grant from City University of Hong (SRG7004079).
Steve N.H. Tsang (Email: [email protected]), Stefanie X.Q. Kang (Email: [email protected]) and Alan H.S. Chan (Email: [email protected]) are with the Department of Systems Engineering and Engineering Management, City University of Hong Kong, Kowloon Tong, Kowloon, Hong Kong.
Stefanie X.Q. Kang is also with the School of Management, Xi’an Jiao Tong University and the State Key Lab for Manufacturing and the Key Lab of the Ministry of Education for Process Control and Efficiency Projects, Xi’an 710049 China.
provide is limited and it cannot display the specific working status and parameter values of machines. The question of how to balance and make the best use of the visual and auditory modalities thus arises, given also that synchronous and asynchronous presentations of auditory and visual signals may lead to very different results [7].
In practical control room tasks, due to the spatial limitation, operators may have to deal with situations requiring unnatural hand postures (e.g. with a crossed hand condition). Previous studies demonstrated that crossed hands can cause inconvenience or even difficulty in making responses [8]. Coding hypothesis is the possible explanation for the phenomenon. Under the assumption, there exist two spatial codes; one is the locational code which contains the information of the responding hand in space, and the other is the anatomical code which relates to the side of the body to which the hand is connected. A mismatch between the two types of spatial codes would slow down the reaction time [7, 9, 10].
Previous studies in human-machine interaction consistently reported that spatial S-R compatibility is a crucial factor for increasing the efficiency of operators [11] – [14]. The concept of spatial S-R compatibility was first introduced by Fitts and his collaborators [11, 15], who showed that human performance relies not only on the type of stimulus or response arrays used, but also on the pairing of the individual stimuli with responses. The high efficiency and accuracy for spatially S-R compatible over incompatible mapping may be due to lower coding demands and higher rate of information transfer.
However, regarding the effect of head orientation on S-R compatibility, there was not much work done on it. Attneave and his colleagues studied the effect of head orientation on spatial S-R compatibility effects [16, 17] and the results showed that when the head is tilted, the physical frame of reference and retinal frame of reference become different which then has an impact on S-R compatibility. In addition, Ladavas and Moscovitch [18] proved that association of the anatomically right and left hands as spatially right and left becomes effective on S-R compatibility when subjects respond with the head tilted to the right or left and stimuli and responses are perpendicular to each other.
In fact, most of past work focused only on head tilt orientation on spatial S-R compatibility effects. However, it is not uncommon that the operator needs to complete a task with the inclusion of head rotation in practical work environments. Thus, the current study was designed to investigate how the three different factors – signal modality, hand condition and head orientation affect human performance. The results can be helpful in formulating pragmatic guidelines for the design of human-machine
Spatial S-R Compatibility Effect with
Head Rotation
Steve N.H. Tsang, Stefanie, X.Q. Kang, and Alan H.S. Chan
interfaces requiring multi-sensory processing and head rotation.
II. METHOD
A. Participants
Twenty male students of City University of Hong Kong with ages ranging from 20 to 40 took part in this experiment. They were all right-handers as tested with the Lateral Preference Inventory [19]. All of them had normal or corrected-to-normal vision (Optical Co., Inc., Model 2000P Orthorator), normal color vision (Ishihara Pseudoisochromatic Plates), and passed a standard audiometric test (Peters Audiometer AP27) with pure tones of 500, 1000, 2000 and 4000 cps presenting to each ear separately. Participants all gave informed consent before the start of the experiment and did not report any physical or health problems with their hands.
B. Apparatus and Stimuli
A personal computer was used to conduct the experiment, and the computer program for stimulus presentation and response data collection was prepared with Visual Basic. During a presentation, either a visual or auditory signal (equiprobable) was presented for testing. Visual stimuli were presented via a 17-inch display monitor positioned 500 mm in front of the participant’s visual field, while auditory stimuli were presented via a Philips stereo headphone (SBC HPI 40) worn on the participant’s ears. For the visual stimulus presentation, a 20 mm diameter green fixation circle, served as a warning signal and as well a fixation point, was displayed at the centre of the screen at the beginning of each trial. After the fixation period, a red stimulus circle of the same size as the green fixation circle was presented 80 mm to either the left or right side of the fixation circle. As for the auditory stimulus presentation, a 790 Hz, 60 dBA attention tone selected from the Microsoft Window’s sound library was presented to either ear via the headphone. A custom made control box with four keys (front-right, front-left, rear-right, and rear-left) in a square array was interfaced with the computer and used for inputting responses by participants.
C. Design
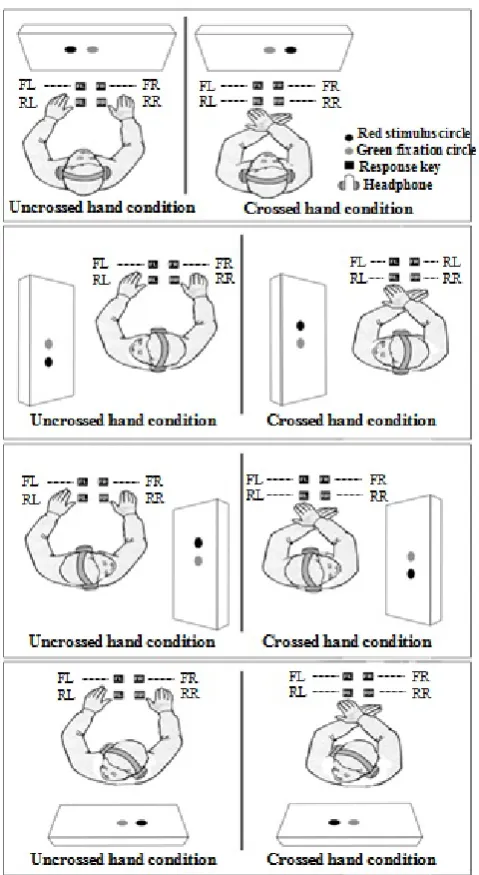
[image:2.595.306.546.48.486.2]Stimuli were presented equiprobably in visual or auditory modality. With reference to the different stimulus modalities, participants needed to elicit responses with different keys. The front-left (FL) and front-right (FR) keys were for the left and right visual signals respectively, while the rear-left (RL) and rear-right (RR) keys were for the left and right auditory signals respectively. Two different hand conditions, uncrossed and crossed hands, were tested for each participant. As for the head orientations, four different orientations, viz. upright, rotated 90˚ left (left_90), rotated 90˚ right (right_90), and rotated left backward (left_back) were tested (Figure 1). In the uncrossed hand condition, the right index and middle fingers were responsible for the RR and FR keys respectively, whereas the left index and middle fingers were for the RL and FL keys respectively. The fingers were assigned on the corresponding keys of the opposite sides in the crossed hand condition. The test conditions were randomized for testing for each participant.
Fig. 1. The four different head orientations with uncrossed and crossed hand conditions. From top to bottom, the head orientation refers to upright, left_90, right_90, and left_back.
D. Procedure
after completion of each test block. III. RESULTS
Altogether, 3200 (2 signal modality x 2 hand condition x 4 head orientation x 20 trials x 20 participants) responses were collected. Among them, 2915 (91.09%) were correct and 285 (8.90%) were either missing or incorrect. Missing and incorrect responses were discarded and the reaction time (RT) distribution of the correct responses were 72.59, 95.30, and 98.73%, respectively, with reference to the control limits of μ ± σ, μ ± 2σ, and μ ± 3σ. The RT distribution was approximately normal as per the Empirical rule [20] and 37 correct responses beyond the upper and lower control limits (±3σ) were further discarded. As errors were few, RT was the sole measure for response performance.
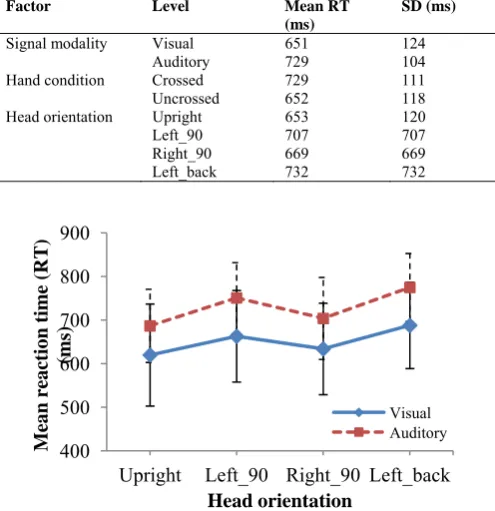
Table I shows the mean RTs and SDs for the factors of signal modality, hand condition, and head orientation. For signal modality, responding to visual signals was 10.70% faster than responding to auditory signals. As for hand condition, not surprisingly, responses made with hand uncrossed were faster than that with hand crossed and such hand induced RT advantage was 77 ms. Regarding the four different head orientations, viz. upright, rotated 90˚ left (left_90), rotated 90 ˚ right (right_90), and rotated left backward (left_back), responses with the upright head orientation was the fastest among the four, and which was 7.64%, 2.39%, and 10.79% higher than the left_90, right_90, and left_back head orientations, respectively. The RT for right_90 was the second fastest, followed by left_90 and then left_back.
Repeated-measures analysis of variance (ANOVA) was conducted for further examination of RTs. The main factors were signal modality (visual and auditory), hand condition (crossed and uncrossed) and head orientation (upright, left_90, right_90, and left_back). The ANOVA test showed that the main factors of signal modality [F(1, 19) = 57.389, p <
0.001], hand condition [F(1, 19) = 62.276, p < 0.001], and
head orientation [F(2.02, 38.41) = 27.527, p < 0.001] were all
significant and as well there were significant interaction effect for signal modality and head orientation [F(2.23, 42.31) = 3.282, p < 0.05]. Note that, a Greenhouse–Geisser epsilon
was applied to adjust the degrees of freedom for the main factors of ‘head orientation’ and the interaction effect of ‘signal modality and head orientation’ as their sphericity assumption was violated [21, p. 151]. Given the significant effects in signal modality and hand condition, it was fair to conclude that responses for visual signals were significantly faster than those for auditory signals, and responses with hand uncrossed were significantly faster than that with hand crossed. As for the significant effect of head orientation, the significant differences in RT were believed to be the results of different visual-field compatibilities from different head orientations. In respect of the interaction effect of signal modality and head orientation, the interaction plot (Figure 2) shows that RT for visual signals were always faster than that for auditory signals, and when the head was rotated to the left (left_90 and left_back) for responses, the RT differences between the two signal modalities increased as compared with the upright and right_90 orientations.
TABLE I
MEAN REACTION TIMES (RTS) AND STANDARD DEVIATIONS (SDS) FOR DIFFERENT SIGNAL MODALITIES,HAND CONDITIONS, AND HEAD
ORIENTATIONS
Factor Level Mean RT
(ms)
SD (ms)
Signal modality Visual 651 124
Auditory 729 104
Hand condition Crossed 729 111
Uncrossed 652 118
Head orientation Upright 653 120
Left_90 707 707
Right_90 669 669
[image:3.595.302.550.109.365.2]Left_back 732 732
Fig. 2. Interaction plot of mean reaction times (RTs) for signal modality and head orientation.
IV. DISCUSSION
In this study, three different factors of signal modality, hand condition, and head orientation were examined for their effects on response performance. Results here showed that all the factors significantly affected the reaction time of participants and as well the signal modality and head orientation had a significant interaction effect on RT. In general, responses to visual signals were significantly faster than responses to auditory signals, and responses with uncrossed hand were superior to those with crossed hand. In respect of head orientation, responses with upright orientation were the fastest among the four different orientations.
For the effect of signal modality, it was found that responses made to the visual signals were faster than those to the auditory ones, and this result was somewhat different from the previous finding that simple reaction time for auditory signals was faster than for visual signals when the two modalities were examined separately [22]. However, it should be noted that, similar to the past studies of Chan and Chan [23] and Lee and Chan [24], the response task here is a multi-sensory one in which visual and auditory signals were presented equiprobably in a test condition and as well it involved four response choices requiring substantial amount of spatial attention; therefore, as suggested by Lee and Chan [24], it may not be appropriate to directly apply simply reaction times for response time estimation in such a multi-sensory control task in which different forms/modalities of signals need to be processed between trials. Also, given the more than usual number of response choices (4 versus 2), they speculated that response efficiency would be
400 500 600 700 800 900
Upright Left_90 Right_90 Left_back
Mean reaction
time
(RT)
(ms)
Head orientation
significantly affected, thereby resulting in different findings to those simple choice reaction time studies.
As for the factor of hand condition, the results were in agreement with past choice RT or spatial compatibility tasks that responses made with uncrossed hand were significantly faster than with crossed hand [7]. The reason may be that the crossed hand condition led to the mismatch of locational and anatomical code for the responding hands. According to the coding hypothesis [9, 10], two spatial codes are formed for the hand effectors in such a spatial response task; one is the locational code referring to the location of the responding hand in space, while the other is the anatomical code referring to the inherent side of the hand connected to the body. Thus, when a signal is presented, its spatial code will be compared with the locational code and the anatomical code of the effector, which subsequently determines the overall RT on the basis of the match or mismatch of the two codes.
Not surprisingly, among the four different head orientations, responding with the upright orientation produced the fastest RT as this head orientation was by far most natural and with greatest stimulus-response (display-control) compatibility given their same spatial dimension (parallel) and corresponding spatial location (left keys (FL and RL) for left signals and right keys (FR and RR) for right signals). As to the other three head orientations, the RT for right_90 was significantly faster than that for left_90 and left_back. This finding may be due in part to the change in spatial dimension between the stimulus and the response array. As can be seen in Figure 1, for the upright and left_back orientations, the dimensions of the stimulus (i.e. visual signals on the screen/ auditory signals from the headphone) and response (i.e. FL and FR keys for visual signals/ RL and RR keys for auditory signals) arrays were always horizontal and in parallel to each other (i.e. limited to right-left dimension). However, when the head of the participant was rotated to either left or right, though the dimension of the stimulus array was still horizontal, the dimension of the response array became vertical relative to the stimulus array. Specifically, the response keys were oriented orthogonally to the stimulus signals, such that the FL, FR, RL, and RR keys were then regarded as left-down (LD), left-up (LU), right-down (RD), and right-up (RU), respectively, for the orientation of right_90 and as right-up (RU), right-down (RD), left-up (LU), and (LD), respectively, for left_90. As participants were instructed to respond with FL and FR keys for left and right visual signals and with RL and RR keys for left and right auditory signals for all the test conditions, the signal-key mapping for the right_90 (left_90) condition therefore became LD (LU) and LU (LD) for left and right visual signals and RD (RU) and RU (RD) for left and right auditory signals. It should be noted that the RT for orthogonal spatial mappings is usually slower than that for parallel spatial mappings [25], and it is believed that an up-right and down-left (response-stimulus) mapping is with higher compatibility than the mapping in other way round, that is, an up-left and down-right mapping (known as orthogonal SRC effect) [26, 27, 28]. Thus, in here, when participants were responding in the right_90 head condition, it was just like they were mapping in the way of up-right and down-left for response-stimulus,
leading to faster RT than responding in the left_90 head condition where the opposite mapping of down-right and up-left mapping was required. For the orientation of left_back, although the stimulus and response arrays were both in horizontal dimension and in parallel to each other, the stimulus-response mapping was reversed such that the left and the right response were for the right and the left signal, respectively. The authors then speculated that it was this incompatibility in spatial mapping causing a lengthening in RT, adding also that the left_back head orientation was unnatural and not comfortable at all. Also, a significant interaction effect of signal modality and head orientation was found in this study, showing that the processing time for visual signals was always faster than for auditory signals, and such modality superiority increased to a larger extent under the left_90 and left_back head orientations.
V. CONCLUSION
After the study, some pragmatic recommendations were suggested. First, critical spatial information should be presented visually instead of aurally in multi-sensory environments involving both visual and auditory sensory channels. Second, cross-handed operation should be avoided. Finally, if a task requires right-left spatial judgment and head rotation, the display should be installed on the right hand side of the operator to maintain the salient features coding (up-right and down-left) between the stimulus and response arrays.
ACKNOWLEDGMENT
The authors thank for the data collection done by MW Ng.
REFERENCES
[1] M. Yamaguchi, and H. Kaneko, “Integration system of head, eye, and retinal position signals for perceptual direction,” Optical Review, vol. 14, no. 6, pp. 411-415, 2007.
[2] A. W. Bronkhorst, J. A. H. Veltman, and L. Van Breda, “Application of a three-dimensional auditory display in a flight task,” Human Factors, vol. 38, no. 1, pp. 23-33, 1996.
[3] S. Nanthavanij, and P. Yenradee, “Predicting the optimum number, location, and signal sound level of auditory warning devices for manufacturing facilities,” International Journal of Industrial Ergonomics, vol. 24, no. 6, pp. 569-578, 1999.
[4] B. Elias, “Dynamic auditory preview for visually guided target aiming,” in Proceedings of the Human Factors and Ergonomics Society Annual Meeting, pp. 1415-1419, 1995.
[5] A. H. S. Chan, K. W. L. Chan, and R.-F. Yu, “Auditory stimulus-response compatibility and control-display design,” Theoretical Issues in Ergonomics Science, vol. 8, no. 6, pp. 557-581, 2007.
[6] G. Salvendy, 2012. Handbook of human factors and ergonomics.
Hoboken, New Jersy: Wiley.
[7] A. H. S. Chan, and K. W. L. Chan, “Synchronous and asynchronous presentations of auditory and visual signals: Implications for control console design,” Applied Ergonomics, vol. 37, no. 2, pp. 131-140,
2006.
[8] S. A. Jones, E. K. Cressman, and D. Y. Henriques, “Proprioceptive localization of the left and right hands,” Experimental brain research, vol. 204, no. 3, pp. 373-383, 2010.
[9] C. Umiltá, and R. Nicoletti, “Spatial stimulus-response compatibility,” in R. W. Proctor and T. G. Reeve, (eds.), Stimulus-response compatibility: An integrated perspective. Amsterdam: North-Holland, pp. 89-116, 1990.
[10] R. W. Proctor, and K. L. Vu, Stimulus-response compatibility principles: Data, theory, and application. Boca Raton: CRC Press,
[11] P. M. Fitts, and C. M. Seeger, “S-R compatibility: Spatial characteristics of stimulus and response codes,” Journal of Experimental Psychology, vol. 46, no. 3, pp. 199-210, 1953.
[12] S.-H. Hsu, and Y. Peng, “Control/display relationship of the four-burner stove: A reexamination,” Human Factors, vol. 35, no. 4, pp. 745-749, 1993.
[13] A. H. S. Chan, and A. Lau, Spatial stimulus–response compatibility in horizontal dimension for Hong Kong Chinese, CD ROM of Proceedings of the 2nd International Conference on Ergonomics in Cyberspace. Inter-National Ergonomics Association Press, Curtin University of Technology Perth, Australia, 1999.
[14] R. Chua, D. J. Weeks, K. L. Ricker, and P. Poon, “Influence of operator orientation on relative organizational mapping and spatial compatibility,” Ergonomics, vol. 44, no. 8, pp. 751-765, 2001.
[15] P. M. Fitts, and R. L. Deininger, “S-R compatibility: Correspondence among paired elements within stimulus and response codes,” Journal of Experimental Psychology, vol. 48, no. 6, pp. 483-492, 1954. [16] F. Attneave, and R. K. Olson, “Discriminability of stimuli varying in
physical and retinal orientation,” Journal of Experimental Psychology, vol. 74, no. 2, pp. 149-157, 1967.
[17] F. Attneave, and K. W. Reid, “Voluntary control of frame of reference and slope equivalence under head rotation,” Journal of Experimental Psychology, vol. 78, no. 1, pp. 153-159, 1968.
[18] E. Ladavas, and M. Moscovitch, “Must egocentric and environmental frames of reference be aligned to produce spatial S-R compatibility effects,” Journal of Experimental Psychology: Human Perception and Performance, vol. 10, no. 2, pp. 205-215, 1984.
[19] S. Coren, “The lateral preference inventory for measurement of handedness, footedness, eyedness, and earedness: Norms for young adults,” Bulletin of the Psychonomic Society, vol. 31, no. 1, pp. 1-3, 1993.
[20] W. Mendenhall, R. J. Beaver, and B. M. Beaver, Introduction to probability and statistics. Duxbury Press, 2012.
[21] N. L. Leech, K. C. Barrett, and G. A. Morgan, SPSS for intermediate statistics: Use and interpretation. Mahwah, NJ: Routledge, 2005. [22] J. T. Brebner, and A. T. Welford, “Introduction: An historical
background sketch,” in A. T. Welford, (ed.), Reaction Times. New York: Academic Press, pp. 1-23. 1980.
[23] K. W. L. Chan, and A. H. S. Chan, Spatial S–R compatibility of visual and auditory signals: Implications for human–machine interface design. Displays, vol. 26, no. 3, pp. 109-119, 2005.
[24] F. C. H. Lee, and A. H. S. Chan, “Attending visual and auditory signals: Ergonomics recommendations with consideration of signal modality and spatial stimulus–response (S–R) compatibility,”
International Journal of Industrial Ergonomics, vol. 37, no. 3, pp. 197-206. 2007.
[25] S. N. H. Tsang, K. W. L. Chan, and A. H. S. Chan, “Effects of Stimulus Orientation, Grouping and Alignment on Spatial S-R Compatibility,” in S. Yamamoto, (ed.), Human Interface and the Management of Information. Information and Interaction Design Lecture Notes in Computer Science. Springer Berlin Heidelberg, pp. 650-659, 2013.
[26] Y. S. Cho, and R. W. Proctor, “Stimulus and response representations underlying orthogonal stimulus-response compatibility effects,”
Psychonomic Bulletin & Review, vol. 10, no. 1, pp. 45-73, 2003. [27] A. Nishimura, and K. Yokosawa, Stimulus representation underlying
orthogonal stimulus-response compatibility effect. Technical Report on Attention and Cognition, No. 27, 2004.
[28] D. J. Weeks, and R. W. Proctor, Salient-features coding in the translation between orthogonal stimulus and response dimensions.