In the natural environment, mercury is considered one of the most toxic metals due to its biochemical activity and variability of forms. Chemical forms, migration and binding of mercury in soils depend on many factors. Deposition of pollutants from the atmosphere and agricultural activities, including the use of pesticides and fertilizers, can often lead to mercury accumulation in soil where the con-tent of this element exceeds 2 mg/kg of fertilizer or adjuvant (Filipek 2003, Lu et al. 2006, Kyllönen et al. 2009). Literature shows that the mercury con-tent after the long-term application of high dose of P and K fertilizers often increases, particularly in soils which are characterized by a low mercury geochemical background (Zheng et al. 2008, Jaguś et al. 2013). The mercury content in phosphate fertiliz-ers is 0.01–1.20 mg/kg (Kabata-Pendias and Pendias 2001), and in calcium superphosphate may reach up to 5.1 mg/kg (Zhao and Wang 2010). Moreover, there is a lack of scientific reporting on the effects
of nitrogen fertilization in the context of mercury status in soils. Therefore, it is necessary to reveal this status in agricultural soils especially in the context of the quality of crops.
The aim of this study was to answer the question of whether and to what extent the 40-year application of different doses of nitrogen and potassium fertiliz-ers determines mercury content in the loamy sand soil. Moreover, an additional aspect of the study was to determine the relationship between the mercury content and basic fertility indicators (total nitrogen (TN), total organic carbon (TOC), pH, hydrolytic acidity (Hh), N-NH4, N-NO3, P, K, Mg, Cu, Zn).
MATERIAL AND METHODS
The study is based on a long-term field experiment founded in 1974 on the Albic Luvisol (IUSS 2014). The experiment is located at the Research Station
Evaluation of the mercury content of loamy sand soil
after long-term nitrogen and potassium fertilization
B. Rutkowska
1, B. Murawska
2, E. Spychaj-Fabisiak
2, Sz. Różański
3,
W. Szulc
1, A. Piekut
21
Agricultural Chemistry Department, Faculty of Agriculture and Biology, Warsaw
University of Life Sciences-SGGW, Warsaw, Poland
2
Department of Agricultural Chemistry, Faculty of Agriculture and Biotechnology,
UTP University of Science and Technology, Bydgoszcz, Poland
3
Department of Soil Science and Soil Protection, Faculty of Agriculture and
Biotechnology, UTP University of Science and Technology, Bydgoszcz, Poland
ABSTRACT
The study was based on soil samples taken after the long-term fertilizer experiment (1974–2014) where different doses of nitrogen and potassium were applied. The experiment was located at the Research Station of the UTP University of Science and Technology in Bydgoszcz (Poland). The long-term application of nitrogen and potassium fertilizers leads to changes in the concentration of mercury, soil acidification, reduction in total organic carbon, total nitrogen as well as affluence of available nutrients (P, K, Mg) and increased mobility of copper and zinc. The significant positive correlation between total mercury content in the soil and the content of N-NO3, Zn, N-NH4 and the hydrolytic acidity value were stated.
of the UTP University of Science and Technology in Bydgoszcz (53°15'31.4''N, 17°46'40.9''E), in ran-domized split-plot design in three replications (Figure 1).
The first analysed factor were doses of N (n = 3) and the second one were K doses (n = 4). The aver-age annual dose of N and K in kg/ha were as follows: N83, N167, N250 with K0, K53, K105, K158. The experi-ment was conducted in field-feed crop rotation. Crop rotation and the level of the applied doses of nitrogen (NH4NO3 – 34% N), potassium (KCl – 50% K) and phosphorus (Ca(H2PO4)2 – 20% P) are shown in Table 1.
Prior to founding the experiment in 1974 and in 2014 representative topsoil samples (composite samples of mixed cores from 0–20 cm) were col-lected from each investigated plot. The following parameters were determined by standard methods: – total content of mercury in solid samples after thermal decomposition in 700°C using single-pur-pose atomic absorption spectrometer (mercury analyser AMA 254, Altec, Czech Republic] – validated on certified material (Table 2); – total organic carbon content by volumetric
method using 0.4 mol/L K2Cr2O7 (Dziadowiec and Gonet 1999);
– total nitrogen – Kjeldahl method prior to mineral-ization in concentrated H2SO4 in a ratio soil:acid 1:2 (Tecator Kjeltec system 1026 Distilling Unit, Hillerød, Denmark)
– nitrate nitrogen (V) – colorimetric method using diphenyl sulfonic acid, after extraction of 1% K2SO4 in a ratio soil:K2SO4 1:5 (spectro- photometer XION 500, DR LANGE, Rhineland-Palatinate, Germany);
– ammonium nitrogen – by distillation (Tecator Kjeltec system 1026 Distilling Unit) after prior
extraction with 1% aluminium potassium sulphate (VI) in a ratio soil:sulphate1:2;
– the content of available phosphorus (PN-R-04023, 1996) and the content of available potassium in soil according to the Egner-Riehm method (PN-R-04022, 1996) by using spectrophotom- eter XION 500, DR LANGE and fast sequential atomic absorption spectrometer AA240FS Varian (Santa Clara, USA);
– the content of available forms of Cu and Zn after extraction in 1 mol/L HCl, (1:10 soil:acid) on atomic absorption spectrophotometer (AA240FS Varian);
– pH – by potentiometric method after extrac-tion in 1 mol/L KCl (1:2.5 soil:KCl), using a pH meter with glass electrode (laboratory pH meter Poland HI 4221 Mera, Warsaw, Poland); – hydrolytic acidity (Hh) – by the Kappen’s method
(Ostrowska et al. 1991).
The relationship between the measured param-eters was calculated statistically using the Tukey’s
[image:2.595.64.533.610.713.2]N1 K2 1 N1 K0 13 N3 K2 25 N1 K1 2 N1 K1 14 N3 K3 26 N1 K0 3 N1 K3 15 N3 K0 27 N1 K3 4 N1 K2 16 N3 K1 28 N2 K0 5 N3 K2 17 N2 K3 29 N2 K1 6 N3 K0 18 N2 K2 30 N2 K2 7 N3 K1 19 N2 K1 31 N2 K3 8 N3 K3 20 N2 K0 32 N3 K3 9 N2 K3 21 N1 K2 33 N3 K2 10 N2 K0 22 N1 K0 34 N3 K1 11 N2 K1 23 N1 K1 35 N3 K0 12 N2 K2 24 N1 K3 36
Figure 1. Scheme of the experiment (N1–N3 – nitrogen (N) dose, K0–K4 – potassium (K) dose, 1–36 – plot No.)
Table 1. Crop rotation and fertilizer doses (kg/ha)
Plant N1 N2 N3 K0 K1 K2 K3 P
Corn for silage 80 160 240 – 50 100 150 25
Winter rape 80 160 240 – 50 100 150 25
Winter wheat 50 100 150 – 33 66 100 25
Rye for green 40 80 120 – 25 50 75 25
The average annual dose 83 167 250 – 53 105 158 25
test (P = 0.05) on 10.0 Statistica (Krakow, Poland). Also analysis of variance and Pearson’s correlation coefficients were calculated with a confidence level of 95%.
RESULTS AND DISCUSSION
A long-term diversified fertilization, both mineral and natural, causes the change of physico-chemical properties, especially in sandy soils (Šimon and Czakó 2014, Zhang et al. 2014). This can affect the bioavailability of micro and macroelements, as well as heavy metals, and thus determine the plant nutrition and consequently the amount and quality of agricultural crops (Zimny et al. 2005, Mainville et al. 2006, Zheng et al. 2008).
It was stated that the long-term impact of high doses of nitrogen and potassium fertilizers led to acidification of sandy soil (Figure 2), changes in mercury content (Table 3) and reduction in soil fertility, and available nutrients as well as to in-crease in the mobility of copper and zinc (Table 4). Following the 40-year experiment it was found that the total mercury content in the analysed soil samples ranged from 0.033–0.054 mg/kg (Table 3), and was significantly determined by different doses of applied nitrogen or potassium fertilizers and their interaction.
The total mercury content in soil samples taken from the individual plots was lower than that de-scribed by Dąbkowska-Naskręt et al. (2008) and natural for the soils of the Pomerania and Kujawy regions. It should also be noted that these do not ex-ceed the limit value for agricultural soils (2 mg/kg), as defined in the appropriate Regulation of the Polish Minister of the Environment on soil quality standards (Regulation 2002). The average total mer-cury content was only 0.043 mg/kg, and was char-acteristic for the topsoil of the uncontaminated silty and loamy soils of Poland – from 0.01–0.90 mg/kg (Kabata-Pendias and Pendias 2001). Application of the highest doses of both nitrogen and
potas-sium fertilizers (K1, K2, K3) significantly affected the increase of the investigated parameters. The application of higher doses of potassium (K2, K3) with higher doses of nitrogen (N2, N3) signifi-cantly affected the increase of mercury content in comparison to the control (K0). The highest mercury content in the soil was found after ap-plication of the highest dose of nitrogen ferti-lizer (N3 – 250 kg N/ha/year) and medium dose of potassium fertilizer (K3 – 105 kg K/ha/year). The results are consistent with the studies of other authors, according to which the change in concentration of mercury in the soil is caused by the type of land use, including fertilizers, which determine soil fertility (Astrup et al. 1991, Lee et al. 1994, Matilainen et al. 2001, Lacerda et al. 2004, Mainville et al. 2006). Zeng et al. (2008) based on the number of long-term experiments reported increased values of mercury in soils intensively fertilized with phosphorus fertilizers. However, that concentration was mainly the effect of the geochemical background.
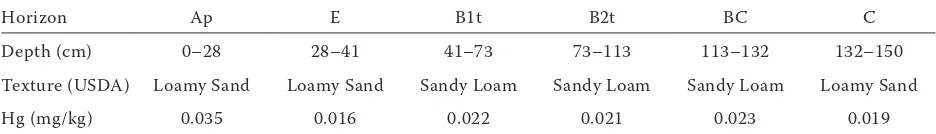
Profile distribution of mercury in the analysed Albic Luvisol was typical for the pedogenic process of the soil – lessivage. The total content of Hg in
sur-Table 2. Total mercury content in certified material
Certified material
Certified value Determined value Standard deviation
(%) replicationsNumber of (µg/kg)
SO4–* 30 ± 6 36.34 ± 0.43 0.8057 6
*Certificate of analysis (1995): Reference soil sample SO4–. Canada Centre for Mineral and Energy Technology
Figure 2. Changes in the pHKCl values during 40 years of nitrogen and potassium fertilization
0 1 2 3 4 5 6 7
N1 N2 N3 1974 yr
K0 K1 K2 K3
N1 N2 N3 1974 year
[image:3.595.320.500.539.720.2]face horizon (Ap) of control profile was 0.035 mg/kg and in parent material (C) it was 0.019 mg/kg (Table 5). In this case the concentration of the metal in surface horizon was the effect not only of the geochemical background, but also of Hg characteristics, and anthropopression (Kabata-Pendias and Pendias 2001, Rodrigues et al. 2006). The enrichment fac- tor, calculated as a ratio of the Hg value in surface horizon and parent material (Ap/C), for the control was 1.79 and for the plot samples it ranged from 1.69–2.77. Determined concentration of mercury in surface horizons is mostly result of the limited migration of the metal. Therefore, the Hg content of surface soils is generally slowly built up, even under a low input of this metal (Roulet et al. 1998, Kabata-Pendias and Pendias 2001). Moreover, beside
the geochemical background, the most probable source of Hg is atmospheric deposition from natural and anthropogenic sources (Feng et al. 2003), but in this study the impact of fertilizers application is also possible. The values determined on experimental plots (Table 3) in comparison to the control (Ap sample, Table 5) confirm this statement.
[image:4.595.64.535.114.183.2]Mercury in such fertilizers as ammonium bicar-bonate, ammonia chloride, potassium chloride or urea is not detected but the concentration of the metal in ammonia sulfate (0.17 mg/kg), ammonium phosphate (0.05 mg/kg), calcium superphosphate (5.1 mg/kg) or NPK compound fertilizers (0.07–1.2 mg/kg) is much higher (Zhao and Wang 2010). In the presented experiment with different doses of nitrogen and potassium fertilizers, a constant
Table 3. Total mercury content in the analysed soil samples (mg/kg)
Fertilization level K0 K1 K2 K3
N1 0.047aA 0.040bB 0.033cC 0.039cB
N2 0.039cC 0.042aB 0.045bA 0.045bA
N3 0.041bC 0.044aB 0.054aA 0.052aA
a,bMean values marked with different letters in the column significantly depending on the applied nitrogen doses. A,BMean values marked with different letters in the row significantly depending on the applied potassium doses
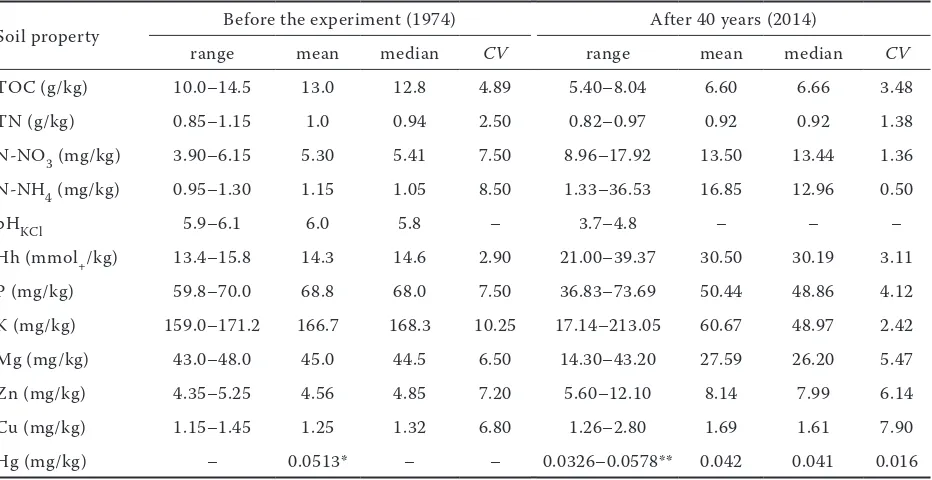
Table 4. Physical and chemical soil properties before the foundation of experiment (1974) and after 40 years of fertilization (2014)
Soil property Before the experiment (1974) After 40 years (2014)
range mean median CV range mean median CV
TOC (g/kg) 10.0–14.5 13.0 12.8 4.89 5.40–8.04 6.60 6.66 3.48
TN (g/kg) 0.85–1.15 1.0 0.94 2.50 0.82–0.97 0.92 0.92 1.38
N-NO3 (mg/kg) 3.90–6.15 5.30 5.41 7.50 8.96–17.92 13.50 13.44 1.36
N-NH4 (mg/kg) 0.95–1.30 1.15 1.05 8.50 1.33–36.53 16.85 12.96 0.50
pHKCl 5.9–6.1 6.0 5.8 – 3.7–4.8 – – –
Hh (mmol+/kg) 13.4–15.8 14.3 14.6 2.90 21.00–39.37 30.50 30.19 3.11
P (mg/kg) 59.8–70.0 68.8 68.0 7.50 36.83–73.69 50.44 48.86 4.12
K (mg/kg) 159.0–171.2 166.7 168.3 10.25 17.14–213.05 60.67 48.97 2.42
Mg (mg/kg) 43.0–48.0 45.0 44.5 6.50 14.30–43.20 27.59 26.20 5.47
Zn (mg/kg) 4.35–5.25 4.56 4.85 7.20 5.60–12.10 8.14 7.99 6.14
Cu (mg/kg) 1.15–1.45 1.25 1.32 6.80 1.26–2.80 1.69 1.61 7.90
Hg (mg/kg) – 0.0513* – – 0.0326–0.0578** 0.042 0.041 0.016
[image:4.595.66.532.487.727.2](25 kg/ha) dose of calcium superphosphate was applied (Table 1).
Found varied values of mercury were probably related to changes of soil parameters affected by fertilization. The research results show that 40 years of intensive application of nitrogen and potassium fertilizers, on the basis of constant dose of phosphorous fertilizers, led to changes in val-ues of acidification indicators (pH, Hh) (Table 4). The experiment led to changes in soil pH from acidic and slightly acidic category to very acidic (Table 4). Significant acidification of the soil as well as the highest concentration of mercury was observed especially in plots where the high doses of nitrogen and potassium were applied, in the ratio of N:K – 1:0.42 (Figure 2, Table 4). Higher pH values and the lowest total mercury content were found where fertilizers were applied in the ratio N:K – 1:0.63. This indicates, that determining for the acidification of the soil was not nitrogen dose but the ratio N:K in the applied fertilizers.
Another result of applied long-term fertilization was also a decrease in organic carbon and total ni-trogen content (Table 4). It was calculated that de-crease of the TOC was on average 0.24 g/kg/year. A significant reduction of TOC content, simultane-ously with the increase the mercury content were found where very high doses of nitrogen (250 kg/ year) and potassium (158 kg/year) were applied (Table 3). It is known that ammonium sulfate and calcium phosphate decrease the Hg uptake in roots (Kabata-Pendias and Pendias 2001), which may lead to accumulation of the metal in soil. The reduction of organic matter in the analysed soil was caused only by mineral fertilization and cultivation of plants reducing soil organic matter. Determined Hg values (not high) may still be determined by the organic matter. Strong affinity of mercury to the organic matter seems to increase with increasing soil acid-ity, even in sandy soils. Mercury is strongly bound
by organic compounds in a wide range between pH 3 and 12, due to the extremely high buffering capacity of humics, both in acidic and alkaline states (Kabata-Pendias and Pendias 2001). The presented results are similar to those published by other au-thors of which the concentration and distribution of mercury in soils is the most significantly affected by the content of organic matter (Lee et al. 1994), and less by the content of iron and aluminium oxides (Roulet et al. 1998).
The accumulation of this element depends also on microbial activity of the soil (Barkay and Wagner-Dobler 2005), and the mobility of Hg along soil profile (Roulet et al. 1998). According to these au-thors, mercury content is strongly correlated with physico-chemical properties of the soil. Similar results were also stated by Fernandez-Martinez et al. (2005) and Rodrigues et al. (2006).
[image:5.595.63.531.114.181.2]It was shown that long-term 40-year impact of nitrogen, potassium and phosphate fertilizers generally resulted in acidification of the analysed soil (loamy sand soil), changes of the basic param-eters of soil fertility (TN, TOC) and decrease of the available forms of nutrients (P, K, Mg), as well as increase in the mobility of trace elements (Cu, Zn) (Table 4). Diversified concentration of mer-cury in surface horizon of experimental plots was mainly the result of these changed soil properties. The significant positive correlation was stated only between the total mercury content and the content of N-NO3, Zn, N-NH4 and value of Hh. The correlation coefficients for these correla-tions were r = 0.51, r = 0.40, r = 0.39 and r = 0.34 (P < 0.05), respectively. For those correlations the linear regression equations were above 15% and are shown graphically in Figure 3. Determination coef- ficient for the relations ranged between 14–25%. As results from the data, the strongest relation was found between Hg concentrations and nitrate (V) concentrations in the soil.
Table 5. Profile distribution of mercury (Hg)
Horizon Ap E B1t B2t BC C
Depth (cm) 0–28 28–41 41–73 73–113 113–132 132–150
Texture (USDA) Loamy Sand Loamy Sand Sandy Loam Sandy Loam Sandy Loam Loamy Sand
Hg (mg/kg) 0.035 0.016 0.022 0.021 0.023 0.019
Figure 3. Correlations between mercury (Hg) content in soil and (a) N-NH4; (b) N-NO3; (c) zinc (Zn) content
(a)
(b)
(c)
X: NH4+-N N = 36
Mean = 13.050417 SD = 2.108119 Max. = 17.920000 Min. = 8.960000 Y: Hg
N = 36
Mean = 0.043145 SD = 0.005985 Max. = 0.057500 Min. = 0.032600 Hg = 0.02884 + 0.00110 × NH4+-N Correlation: r = 0.38621 (P < 0.05)
NH4+-N (mg/kg)
H
g
(m
g/
kg
)
H
g
(m
g/
kg
)
NO3–-(mg/kg)
Hg = 0.03897 + 0.25E–3 × NO3–-N Correlation: r = 0.50551 (P < 0.05)
X: NO3–-N N = 36
Mean = 16.903750 SD = 12.261571 Max. = 36.410000 Min. = 1.330000 Y: Hg
N = 36
Mean = 0.043145 SD = 0.005985 Max. = 0.057500 Min. = 0.032600
H
g
(m
g/
kg
)
Zn (mg/kg)
Hg = 0.03066 + 0.00151 × Zn Correlation: r = 0.40009 (P < 0.05)
X: Zn N = 36
Mean = 8.270633 SD = 1.586712 Max. = 12.100000 Min. = 5.940000 Y: Hg
N = 36
Mean = 0.043145 SD = 0.005985 Max. = 0.057500 Min. = 0.032600
REFERENCES
Aastrup M., Johnson J., Bringmark E., Bringmark L., Iverfeldt Å. (1991): Occurrence and transport of mercury within a small catch-ment area. Water, Air, and Soil Pollution,56: 155–167.
Barkay T., Wagner-Döbler I. (2005): Microbial transformations of mercury: Potentials, challenges, and achievements in control-ling mercury toxicity in the environment. Advances in Applied Microbiology, 57: 1–52.
Dąbkowska-Naskręt H., Bartkowiak A., Różański S. (2008): The content of mercury in intensively used agricultural soils of Po- morze and Kujawy region. Environmental Protection and Natural Resources, 35/36: 153–156. (In Polish)
Dziadowiec H., Gonet S. (1999): Methodological Guide Test Soil Organic Matter. Warsaw, Polish Society of Soil Science, 65. Feng X.B., Tang S.L., Shang L.H., Yan H.Y., Sommar J., Lindqvist O.
(2003): Total gaseous mercury in the atmosphere of Guiyang, PR China. Science of The Total Environment, 304: 61–72.
Fernández-Martínez R., Loredo J., Ordónez A., Rucandio M.I. (2005): Distribution and mobility of mercury in soils from an old mining area in Mieres, Asturias (Spain). Science of The Total Environ-ment, 346: 200–212.
Filipek T. (2003): Toxic elements (Cd, Pb, Hg, As) in soils and plants in relation to their acceptable concentrations in fertilizers and acidifiers. Chemik, 11: 334–352. (In Polish)
IUSS Working Group (2014): World Reference Base for Soil Re-sources. International Soil Classification System for Naming Soils and Creating Legends for Soil Maps. World Soil Resources Reports No. 106. Rome, FAO.
Jaguś A., Kozak J., Skrzypiec M. (2013): Occurrence of trace metals in mountain soils: A study in the Magurka Wilkowicka range. Proceedings of ECOpole, 7: 601–607. (In Polish)
Kabata-Pendias A., Pendias H. (2001): Trace Elements in Soil and Plants. 3rd Ed. Boca Raton, CRC Press LLC.
Kyllönen K., Karlsson V., Ruoho-Airola T. (2009): Trace element deposition and trends during a ten year period in Finland. Science of The Total Environment, 407: 2260–2269.
Lacerda L.D., de Souza M., Ribeiro M.G. (2004): The effects of land use change on mercury distribution in soils of Alta Floresta, Southern Amazon. Environmental Pollution, 129: 247–255. Lee Y.H., Borg G.C., Iverfeldt Å., Hultberg H. (1994): Fluxes and
turnover of methylmercury: Mercury pools in forest soils. In: Watras C.J., Huckabee J.W. (eds): Mercury Pollution: Integration and Synthesis. Boca Raton, Lewis Publishers, 329–341.
Lu J., Cheng J.P., Hu X.F., Xie H.Y., Wang W.H. (2006): The research of mercury-polluted soil and leaves around Shanghai Wujing in-dustrial zone. Environmental Chemistry, 25: 101–103. (In Chinese) Mainville N., Webb J., Lucotte M., Davidson R., Betancourt O., Cueva
E., Mergler D. (2006): Decrease of soil fertility and release of mer-cury following deforestation in the Andean Amazon, Napo River Valley, Ecuador. Science of The Total Environment, 368: 88–98. Matilainen T., Verta M., Korhonen H., Uusi-Rauva A., Niemi M.
(2001): Behavior of mercury in soil profiles: Impact of increased precipitation, acidity, and fertilization on mercury methylation. Water, Air, and Soil Pollution, 125: 105–119.
Ostrowska A., Gawliński S., Szczubiałka Z. (1991): Methods of Analysis and Evaluation of Properties of Soils and Plants. War- szawa, Institute of Environmental Protection. (In Polish) Rodrigues S., Pereira M.E., Duarte A.C., Ajmone-Marsan F., Davidson
C.M., Grčman H., Hossack I., Hursthouse A.S., Ljung K., Martini C., Otabbong E., Reinoso R., Ruiz-Cortés E., Urquhart G.J., Vrščaj B. (2006): Mercury in urban soils: A comparison of local spatial variability in six European cities. Science of The Total Environ-ment, 368: 926–936.
Roulet M., Lucotte M., Saint-Aubin A., Tran S., Rhéault I., Farella N., Da Silva E.D.J., Dezencourt J., Passos C.J.S., Soares G.S., Gui-maraes J.R., Mergler D., Amorim M. (1998): The geochemistry of mercury in central Amazonian soils developed on the Alter-do-Chao formation of the lower Tapajós River Valley, Para state, Brazil. Science of The Total Environment, 223: 1–24.
Šimon T., Czakó A. (2014): Influence of long-term application of organic and inorganic fertilizers on soil properties. Plant, Soil and Environment, 60: 314–319.
Zhang Y.G., Zhang Y.Y., Cai J.P., Zhu P., Gao H.J., Jiang Y. (2014): Variation in available micronutrients in black soil after 30-year fertilization treatment. Plant, Soil and Environment, 60: 387–393. Zhao X., Wang D. (2010): Mercury in some chemical fertilizers and the effect of calcium superphosphate on mercury uptake by corn seedlings (Zea mays L.). Journal of Environmental Science, 22: 1184–1188.
Zheng Y.M., Liu Y.R., Hu H.Q., He J.Z. (2008): Mercury in soils of three agricultural experimental stations with long-term fertiliza-tion in China. Chemosphere, 72: 1274–1278.
Zimny L., Wacławowicz R., Malak D. (2005): Changes of selected physical properties of soil as a effect of organic and mineral nitro-gen fertilization. Fragmenta Agronomica, 22: 664–677. (In Polish)
Received on September 18, 2015 Accepted on November 23, 2015
Corresponding author: