Paddy rice plays a significant role in the national economy in China. Thus, it is an important mis-sion to improve crop productions. At present, investigators found that nitrogen (N) is one of the most important elements for improving the crop yields. Farmers also tend to increase the dose of N fertilization to boost paddy rice production. However, utilization efficiency of N fertilization will decrease with increasing dose of N fertiliza-tion, which will cause environmental pollution and nitrate leaching issues (Olszewski et al. 2014). Therefore, a large number of researches have been done to monitor the leaf N content by passive and
active technologies for guiding the application of N fertilization (Feng et al. 2008, Gong et al. 2012).
Passive remote sensing technology depends on the effect of the nutrient stress of crops on the characteristic wavelengths (Feng et al. 2008). A number of papers reported utilizing of reflective spectra for monitoring the LNC of crops. The rea-son is that the LNC has a certain correlation with reflectance, and can be accurately monitored by using a vegetation index (Cao et al. 2013). However, it is restricted by many factors, such as weather condition, measurements time etc. In order to address these shortages, Gong et al. (2012)
pro-Estimation of nitrogen content based on fluorescence
spectrum and principal component analysis in paddy rice
J. Yang
1, W. Gong
1,2, S. Shi
1,2,3, L. Du
1,4, J. Sun
1, S.-L. Song
51
State Key Laboratory of Information Engineering in Surveying, Mapping and Remote
Sensing, Wuhan University, Wuhan, P.R. China
2
Collaborative Innovation Center of Geospatial Technology, Wuhan, P.R. China
3
School of Resource and Environmental Sciences, Wuhan University, Wuhan, P.R. China
4School of Physics and Technology, Wuhan University, Wuhan, P.R. China
5
Wuhan Institute of Physics and Mathematics, Chinese Academy of Sciences, Wuhan,
P.R. China
ABSTRACT
Paddy rice is one of the most important cereal crops in China. Nitrogen (N) is closely related to crops production by influencing the photosynthetic efficiency of paddy rice. In this study, laser-induced fluorescence (LIF) technolo-gy with the help of principal component analysis (PCA) and back-propagation neural network (BPNN) is proposed to monitor leaf N content (LNC) of paddy rice. The PCA is utilized to extract the characteristic variables of LIF spectra by analysing the major attributes. The results showed that the first three principal components (PCs) can explain 95.76% and 93.53% of the total variance contained in the fluorescence spectra for tillering stage and shoot-ing stage, respectively. Then, BPNN was utilized to inverse the LNC on the basis of the first three PCs as input vari-ables and can obtain the satisfactory inversion results (R2 of tillering stage and shooting stage are 0.952 and 0.931,
respectively; residual main range from –0.2 to 0.2 mg/g). The experimental results demonstrated that LIF technique combined with multivariate analysis will be a useful method for monitoring the LNC of paddy rice, which can pro-vide consultations for the decision-making of peasants in their N fertilization strategies.
Keywords: remote sensing; Oryza sativa; macroelement; environmental pollution; leaf nitrogen content
posed multi-spectral Lidar for the remote sensing of vegetation. Due to high capability of recording the physiology of the canopy, it was largely applied to monitor the nutrient stress of crops. In addition, passive fluorescence and luminescent method were also employed to detect nutrient stress of crops (Meroni et al. 2009, Aleksandrov et al. 2014). It is motivated by the link of fluorescence to photosyn-thetic efficiency which could be utilized for large scale detection of crops status.
In recent decades, the laser-induced fluorescence (LIF) technology was proposed and used to track the status of crops (Chappelle et al. 1984). Related studies showed that the characteristic peaks of LIF spectra were closely related to the nutrient stress of crops (Tuba et al. 2010, Yang et al. 2015a). Due to the advantages of rapid, non-destruction and without pre-processing analysis, it has been widely used to estimate canopy N status of maize, tomato, wheat and paddy rice (Kalaji et al. 2014, Yang et al. 2015b, Živčák et al. 2014a). However, they mainly focused on using the far-red and red fluorescence ratios, fluorescence intensity as well as non-photochemical quenching etc. to detect the nutrients changes of crop (Tremblay et al. 2011). The fluorescence spectra combined with multivariate analysis is still sparse at present. Therefore, the main objective of this study was to inverse LNC based on LIF spectra combined with principal component analysis (PCA) and back-propagation neural network (BPNN).
In this study, the LIF spectrum of paddy rice leaf was measured by using the laboratory building system. Then, the PCA was utilized to analyse these fluorescence spectra and extract the characteristic variables. Finally, paddy rice LNC was inversed by using BPNN on the basis of the PCs as variables. The R2 of the linear regression analysis between the predicted and measured values can be up to 0.952 and 0.931, which corresponds to tillering stage and shooting stage, respectively. Thus, the LIF technique with the help of PCA and BPNN can be used to monitor the variation of paddy rice LNC, which can guide farmers to rapidly rectify the insufficient N content in the field.
MATERIAL AND METHODS
Experimental areas. The experimental area is located in the Junchuan county, Suizhou city, Hubei
province, China which is situated in the middle reaches of the Yangze River. The area is a typical subtropical monsoon climate, cold in winter, hot in summer. The annual rainfall is over 1200 mm, and annual sunshine duration exceeds 1800 h. Thus, it is suitable for growing paddy rice and is also well known as one of the most important agricultural production base in China. The paddy rice cultivar was Yongyou 4949, which was seeded on 27 April, 2014 and then transplanted to field on 1 June. The samples were collected on 15 July and 1 August, which signifies tillering stage and shooting stage, respectively.
Measured system. The LIF apparatus mainly contains of three parts. The first section is the excitation light source which consists of an Nd:YAG laser (the output energy of laser is 1.5 mJ, the emission wavelength is 355 nm, the per pulse du-ration and repetition frequency is 3 ns and 20 Hz, respectively). The second part is an optical receiver assembly. The LIF signal is collected by using a single-mode optical fiber with a 25° angular field of view and diameter of 200 µm. The emission fluorescence spectra enter the spectrometer after being through long-pass filter of 355 nm and then measured by using an intensified charge coupled device (ICCD). The fluorescence spectra range from 360 to 800 nm with 0.5 nm sampling interval. The last section is the data processing system. The measured fluorescence signals are stored in a personal computer for post-processing.
Measurements of LNC. All samples were imme-diately sent to the Wuhan Academy of Agricultural Science and Technology for measurement of LNC after measuring the fluorescence spectra. The Kjeldjahl method was utilized to determine the LNC (Yi et al. 2007).
In order to analyse the performance of PCs as variables, the BPNN model was utilized to estimate LNC. Each processing unit of BPNN calculates weighted inputs and then applies a linear or non-linear function to the resulting sum to determine the output (Zong et al. 2014). In addition, it also exhibits the advantage of the input signals stimu-lating network capability to patterns recognition (Samborska et al. 2014, Yang et al. 2015b). All fluorescence spectra were consisted of 216 sets of data (108 sets for each growth stage), which were randomly divided into two sections: 70% as the training set for training BPNN model and the other 30% as the validation set to test the tentative performance of BPNN.
RESULTS AND DISCUSSION
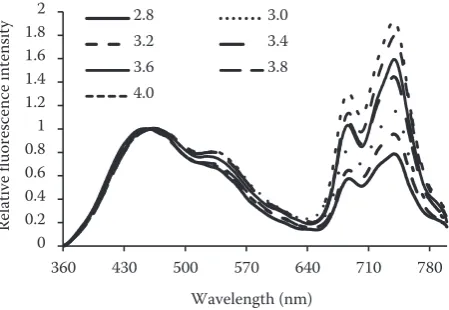
LIF spectra. The LIF spectra are normalized to 1 at 460 nm and chlorophyll fluorescence wave-length ranges from 650 nm and 800 nm, centring at 685 nm and 740 nm (Figure 1). According to previous investigations (Chappelle et al. 1991), the fluorescence peak at 685 nm is attributed to chlorophyll a associated with photosystem II, the other fluorescence peak at 740 nm is correspond-ing to antenna chlorophyll of both photosystem I and photosystem II. Figure 1 illustrates that the fluorescence intensity at 740 nm is more intensive than that at 685 nm (Apostol et al. 2007). The reason is that the fluorescence emitted between 684 nm and 695 nm was more strongly reabsorbed by the
chlorophyll pigment in the upper layer leaf cells. Thus, chlorophyll pigment displayed little influ-ence to fluorescinflu-ence peak at 740 nm (Malenovsky et al. 2009). From Figure 1, it can be known that the fluorescence spectra between 650~800 nm increased with the increase of paddy rice LNC. Thus, the LIF technology can be used to monitor the LNC of paddy rice in this study. As shown in Figure 1, the fluorescence spectra exhibited similar changing tendency with the studies of Živčák et al. (2014b).
Analysis of PCA. In this study, PCA was utilized to reduce the dimensionality of the fluorescence spectra and extract the characteristics vectors by analysing internal correlation of data. All 216 sets of the fluorescence spectra with different paddy rice LNC were analysed by using PCA. The explained variance (EV) and cumulative variance (CV) of the first three eigenvalues of the fluorescence spectra for the different growth stages of paddy rice were listed in Table 1.
From the Table 1, it can be known that 95.76% and 93.53% of the total variance can be explained by using the accumulated weight value of the first three major factors for the tillering stage and shoot-ing stage, respectively. Thus, all fluorescence char-acteristics can be represented by using the first three PCs. In order to better comprehend the efficiency of PCA for describing the fluorescence spectra, the loading plots of the first three PCs were displayed in Figure 2.
Figure 2 is the weight of the PCA of fluorescence spectra under different LNCs. It can be known that the PC1 and PC2 are mainly attributed to the fluorescence spectra at 545, 687, 740 and 743 nm. Thus, it further demonstrates that the first three PCs include a large number of information con-0
0.2 0.4 0.6 0.81 1.2 1.4 1.6 1.82
360 430 500 570 640 710 780
Re
la
tiv
e
flu
or
es
ce
nc
e
in
te
nsi
ty
[image:3.595.305.533.153.240.2]Wavelength (nm) 2.8 mg/g 3.0 mg/g 3.2 mg/g 3.4 mg/g 3.6 mg/g 3.8 mg/g 4.0 mg/g
Figure 1. The relationship between the normalized fluorescence intensity (normalized to 1 at 460 nm) and the wavelength under different paddy rice leaf nitrogen content (mg/g)
Table 1. Percentage of the explained variance for the first three principal components (PCs) for different growth stages of paddy rice. PC1, PC2 and PC3 capture the abundant information contained in the LIF spectra
Tillering stage Shooting stage EV (%) CV (%) EV (%) CV (%)
PC1 81.49 81.49 85.59 85.59
PC2 11.35 92.84 5.96 91.55
PC3 2.92 95.76 1.98 93.53
[image:3.595.66.291.541.696.2]tained in the fluorescence spectra, which can be utilized to further analyse the paddy rice LNC.
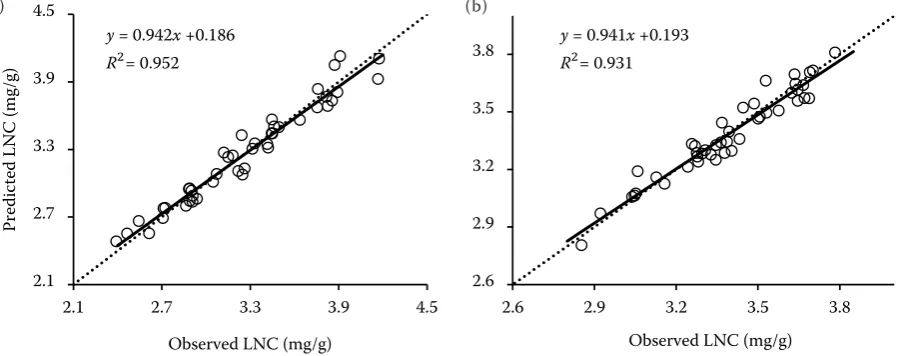
Estimation of LNC. The first three PCs were set as input variables, a three-layer BPNN model was used to estimate the paddy rice LNC. This network architecture consisted of three parts: one input layer, one hidden layer and one output layer (Yi et al. 2007). The fluorescence spectra of each growth stage (tillering stage and shooting stage), the 76 sets out of 108 sets were utilized to train BPNN model. The remaining 34 sets were employed to test the performance of the model. The results of inversion LNC were displayed in Figure 3.
Figure 3 exhibited the relationship between the predicted and observed LNCs for the different growth stages of paddy rice. The solid line denotes
the linear regression for the predicted and observed values. The R2 of the linear regression analysis between the predicted and measured values can be up to 0.952 and 0.931 for tillering stage and shooting stage, respectively. The predicted results were nearly in accordance with the line of 1:1, which means the PCA combined with BPNN can be utilized to analyse the correlation between the fluorescence spectra and LNC.
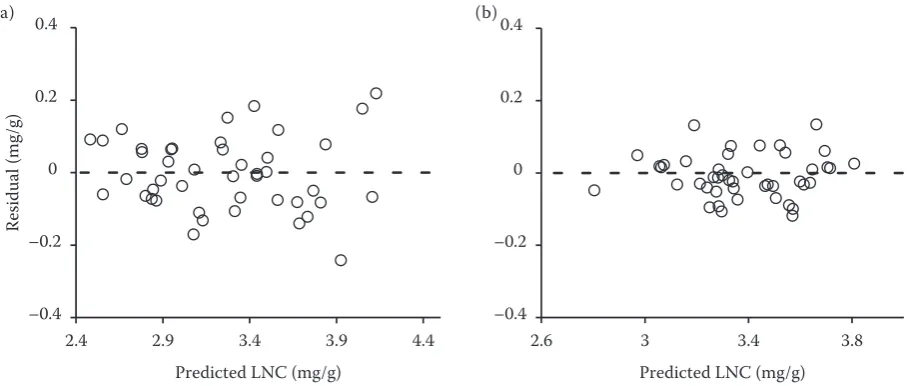
Analysis of accuracy and precision. In order to quantitatively evaluate the accuracy of the pre-dicted results, the residual is utilized in this study. Residuals of the predicted values represented the differences between the predicted and observed values. Figure 4 showed the residual of predictive LNC and it mainly ranged from –0.2 to 0.2 mg/g.
–0.1 –0.05 0 0.05 0.1
360 430 500 570 640 710 780
Lo
ad
in
g
w
ei
gh
t o
f l
at
en
t v
ar
ia
bl
e
Wavelength (nm) PC1
PC2 PC3
–0.12 –0.06 0 0.06 0.12
[image:4.595.67.523.91.275.2]360 430 500 570 640 710 780 Wavelength (nm)
Figure 2. The loading plots of the first three principal components for different growth stages: (a) tillering stage; (b) shooting stage
Figure 3. The relationship between the observed and predicted leaf nitrogen content (LNC) based on the first three principal components for different growth stages: (a) tillering stage; (b) shooting stage. The dot line is the 1:1 line
2.1 2.7 3.3 3.9 4.5
2.1 2.7 3.3 3.9 4.5
Pr
edi
ct
ed LN
C
(mg
/g
)
Observed LNC (mg/g) y = 0.942x +0.186
R2= 0.952
2.6 2.9 3.2 3.5 3.8
2.6 2.9 3.2 3.5 3.8 Observed LNC (mg/g) y = 0.941x +0.193
R2= 0.931
(a) (b)
[image:4.595.72.522.546.724.2]Therefore, the experimental results (Figures 3 and 4) demonstrated that the LIF technology with the help of PCA and BPNN can be employed to precisely inverse paddy rice LNC.
In conclusion, the fluorescence spectra of paddy rice increased with the increase of LNC, which can be utilized to monitor the change of paddy rice LNC. Thus, PCA, which was utilized to extract the characteristic variables by analysing the major at-tributes, combined with BPNN was used to inverse LNC based on LIF technology. The R2 of the linear regression between the predicted and measured values of the tillering stage and shooting stage are 0.952 and 0.931, respectively. All residuals mainly range from –0.2 to 0.2 mg/g. The experimental results demonstrated that LIF technology with the help of multivariate analysis is a potentially useful method for monitoring N content of paddy rice. If more fluorescence spectra with different growth environments and cultivars were obtained, it will improve the universality of the model. Then, it can provide support for the N fertilization strategies and reduce the environmental pollution caused by over-fertilization.
REFERENCES
Apostol S., Viau A.A., Tremblay N. (2007): A comparison of multiwavelength laser-induced fluorescence parameters for the remote sensing of nitrogen stress in field-cultivated corn. Canadian Journal of Remote Sensing, 33: 150–161.
Aleksandrov V., Krasteva V., Paunov M., Chepisheva M., Kous-manova M., Kalaji H.M., Goltsev V. (2014): Deficiency of some nutrient elements in bean and maize plants analyzed by lumi-nescent method. Bulgarian Journal of Agricultural Science, 20: 24–30.
Chappelle E.W., Wood F.M., McMurtrey J.E., Newcomb W.W. (1984): Laser-induced fluorescence of green plants. 1: A tech-nique for the remote detection of plant stress and species differentiation. Applied Optics, 23: 134–138.
Chappelle E.W., McMurtrey J.E., Kim M.S. (1991): Identification of the pigment responsible for the blue fluorescence band in the laser induced fluorescence (LIF) spectra of green plants, and the potential use of this band in remotely estimating rates of photosynthesis. Remote Sensing of Environment, 36: 213–218. Cao Q., Miao Y.X., Wang H.Y., Huang S., Cheng S.S., Khosla R.,
Jiang R.F. (2013): Non-destructive estimation of rice plant nitrogen status with crop circle multispectral active canopy sensor. Field Crops Research, 154: 133–144.
Feng W., Yao X., Zhu Y., Tian Y.C., Cao W.X. (2008): Monitoring leaf nitrogen status with hyperspectral reflectance in wheat. European Journal of Agronomy, 28: 394–404.
Gong W., Song S.L., Zhu B., Shi S., Li F., Cheng X.W. (2012): Multi-wavelength canopy LiDAR for remote sensing of veg-etation: Design and system performance. ISPRS Journal of Photogrammetry and Remote Sensing, 69: 1–9.
Kalaji H.M., Oukarroum A., Alexandrov V., Kouzmanova M., Bres-tic M., Zivcak M., Samborska I.A., Cetner M.D., Allakhverdiev S.I., Goltsev V. (2014): Identification of nutrient deficiency in maize and tomato plants by in vivo chlorophyll a fluorescence measurements. Plant Physiology and Biochemistry, 81: 16–25. Malenovský Z., Mishra K.B., Zemek F., Rascher U., Nedbal L.
(2009): Scientific and technical challenges in remote sensing
–0.4 –0.2 0 0.2 0.4
2.4 2.9 3.4 3.9 4.4
Re
sid
ua
l (
m
g/
g)
Predicted LNC (mg/g)
–0.4 –0.2 0 0.2 0.4
2.6 3 3.4 3.8
[image:5.595.67.521.94.287.2]Predicted LNC (mg/g)
Figure 4. The residual of predictive paddy leaf nitrogen content (LNC) on the basis of three principal components for different growth stages: (a) tillering stage; (b) shooting stage
of plant canopy reflectance and fluorescence. Journal of Ex-perimental Botany, 60: 2987–3004.
Meroni M., Rossini M., Guanter L., Alonso L., Rascher U., Co-lombo R., Moreno J. (2009): Remote sensing of solar-induced chlorophyll fluorescence: Review of methods and applications. Remote Sensing of Environment, 113: 2037–2051.
Olszewski J., Makowska M., Pszczółkowska A., Okorski A., Bi-eniaszewski T. (2014): The effect of nitrogen fertilization on flag leaf and ear photosynthesis and grain yield of spring wheat. Plant, Soil and Environment, 60: 531–536.
Samborska I.A., Alexandrov V., Sieczko L., Kornatowska B., Goltsev V., Cetner M.D., Kalaji H.M. (2014): Artificial neural networks and their application in biological and agricultural research. Signpost Open Access Journal of NanoPhotoBioSciences, 2: 14–30. Tuba Z., Saxena D.K., Srivastava K., Singh S., Czobel S., Kalaji
H.M. (2010): Chlorophyll a fluorescence measurements for validating the tolerant bryophytes for heavy metal (Pb) biomap-ping. Current Science (Bangalore), 98: 1505–1508.
Tremblay N., Wang Z., Cerovic Z.G. (2011): Sensing crop nitrogen status with fluorescence indicators: A review. Agronomy for Sustainable Development, 32: 451–464.
Yi Q.X., Huang J.F., Wang F.M., Wang X.Z., Liu Z.Y. (2007): Moni-toring rice nitrogen status using hyperspectral reflectance and
artificial neural network. Environmental Science and Technol-ogy, 41: 6770–6775.
Yang J., Gong W., Shi S., Du L., Sun J., Ma Y.-Y., Song S.L. (2015a): Accurate identification of nitrogen fertilizer application of paddy rice using laser-induced fluorescence combined with sup-port vector machine. Plant, Soil and Environment, 61: 501–506. Yang J., Shi S., Gong W., Du L., Ma Y.Y., Zhu B., Song S.L. (2015b):
Application of fluorescence spectrum to precisely inverse paddy rice nitrogen content. Plant, Soil and Environment, 61: 182–188. Zong R.W., Zhi Y., Yao B., Gao J.X., Stec A.A. (2014): Classifica-tion and identificaClassifica-tion of soot source with principal component analysis and back-propagation neural network. Australian Journal of Forensic Sciences, 46: 224–233.
Živčák M., Olšovská K., Slamka P., Galambošová J., Rataj V., Shao H.-B., Brestič M. (2014a): Measurements of chlorophyll fluorescence in different leaf positions may detect nitrogen deficiency in wheat. Zemdirbyste-Agriculture, 101: 437–444. Živčák M., Olšovská K., Slamka P., Galambošová J., Rataj V., Shao
H.B., Brestič M. (2014b): Application of chlorophyll fluores-cence performance indices to assess the wheat photosynthetic functions influenced by nitrogen deficiency. Plant, Soil and Environment, 60: 210–215.
Received on December 28, 2015 Accepted on February 22, 2016
Corresponding author: