Differences in Humic Acids Structure of Various
Soil Types Studied by DRIFT Spectroscopy
Lenka PAVLŮ* and Marcela MÜHLHANSELOVÁ
Department of Soil Science and Soil Protection, Faculty of Agrobiology, Food and Natural Resources, Czech University of Life Sciences Prague, Prague, Czech Republic
*Corresponding author: [email protected]
Abstract
Pavlů L., Mühlhanselová M. (2018): Differences in humic acids structure of various soil types studied by DRIFT spectroscopy. Soil & Water Res., 13: 29−35.
The method of diffuse reflectance infrared spectroscopy (DRIFT) proved to be useful for studying the soil or-ganic matter structure. The aim of this study was to compare DRIFT spectra of humic acids (HAs) separated from various soils and to identify their specific nature. Samples of agricultural soils (Dystric Cambisol, Haplic Chernozem, Greyic Phaeozem, and Haplic Luvisol) were collected from humic (A) horizons. Soil samples of reclaimed dumpsites (Haplic Technosol (molic) and (calcic)) were taken from the upper part of the soil profile. Samples of forest soils were collected from surface organic (H) horizons of Cambisols in spruce (Picea abies L. Karst.) and beech (Fagus silvatica L.) forests. The selected soil types differ in pH, carbon content, texture, and humus quality. An extraction of HAs was performed using a mixture of 0.5 M NaOH and 0.1 M Na4P2O7. The separated HAs were freeze-dried and analyzed using a DRIFT spectrometer (Thermo Nicolet Nexus) without KBr dilution. There were found differences in relative aromaticity among the agricultural soils HAs. The most aromatic character was observed in HAs from Chernozems and the least in Cambisols. Preservation of the natural structure of Chernozem HAs during the reclamation process was documented on the HAs spectra from Haplic Technosols (molic). By using the DRIFT spectra of HAs of forest H horizons, it is possible to identify the fragments of decomposed material (gymnosperms or angiosperms). HAs isolated from these horizons represent a certain interstage between lignin and the matured soil humic acids.
Keywords: infrared techniques; soil organic matter
Soil organic matter (SOM) plays a very important role in soils. For example, its content and quality influences soil structure stability and/or physical characteristics, such as bulk density and porosity, water holding capacity and infiltration (e.g. Mbagwu & Piccolo 1998; Chenu et al. 2000; Barthes & Roose 2002; Angst et al. 2017).
The SOM consists of labile and stable substances. Stable humic substances representing around 20% of the total SOM (Schulten & Schnitzer 1997) are products of degradation and recombination pro-cesses. The generally accepted model of a polymeric structure and polydispersity of humic acids was con-tested in the 1980s by the micellar concept (Piccolo 2001), which considered inter- and intramolecular
and stabilization (Bonanomi et al. 2013; Kara et al. 2014). The base structure is made up of lignin-derived oxidation products, phenol-amino acid complexes, hydroxyquinon, and C6-C3 structural units of lignin. The number of precursor molecules is large, and the number of ways in which they combine is enormous, thereby accounting for the heterogeneous nature of humic material in any given soil (Stevenson 1994).
There is a gap between long-time detail study of humic substances structure, sorption, extraction, utility etc. often focused on various sources humic acids (coal, peat, water, and agriculture soils) and pure information about their diversity among soil types or soil horizons especially surface organic horizon of forest soils. In the soil classification or description of the qualitative SOM characteristics are often simplified according to the humic to fulvic acids ratio or by the absorbance ratio of alkaline soil extract at wavelengths of 465 and 665 nm (e.g. Ste-venson 1994). Infrared spectroscopy is a relatively easy and available method (in comparison with e.g. NMR) which can provide more detailed information about soil organic matter, or humic substances and their structure and modification in space and time (e.g. Agnelli et al. 2000; Chai et al. 2007; Liu et al. 2008; Ferrari et al. 2011). The method of diffuse reflectance spectroscopy (DRIFT) enables meas-urement of separated humic acids (HAs) and fulvic acids (FAs) in their pure forms without diluting (for example by potassium bromide).
The aim of this study is to compare DRIFT spectra of HAs separated from various soils types and to indicate some of their specifics resulting from dif-ferent soil genesis.
MATERIAL AND METHODS
The first group of samples was collected from humic (A) horizons of agricultural soils. Sampling sites were selected from long-term studied plots. The following soil types were collected (samples taken from the upper 25 cm): Dystric Cambisol (DC), Haplic Chernozem (HCh), Greyic Phaeozem (GP), and Haplic Luvisol (HL). Selected soil types differ in pH, carbon content, texture, and humus quality (e.g. Kočárek et al. 2005; Kodešová et al. 2006). The second group of samples was from Pokrok dumpsite in Northern Bohemia (Mühlhanselová et al. 2006). The first part of the dumpsite was covered with natural topsoil (Haplic Technosol (molic) (HTm)), the second part was covered with a layer of loess (Haplic Technosol
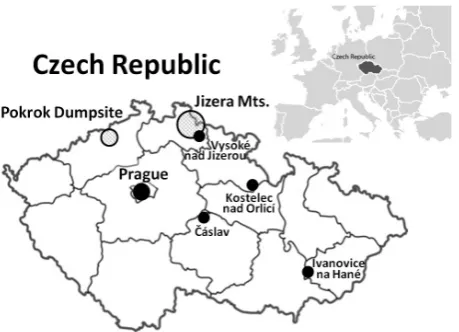
(calcic) (HTc)). Thirteen samples from the site covered with topsoil and eleven samples from the site covered with loess from the upper 20 cm were selected. The third group of soil samples was taken from surface organic horizons of the Jizerské hory Mts. Chemical soil characteristics and soil acidification of this area have been studied in various projects (e.g. Borůvka et al. 2005; Mládková et al. 2006). Seven samples of humified (H) horizons from a beech forest (Fagus sylvatica L.) and ten from a spruce forest (Picea abies (L.) Karst.) were studied in detail (thickness varied in the range of 2–10 cm). Soil type was in all cases classified as Dystric Cambisols. Soil classifica-tion was performed according to IUSS (2014). Study sites are shown in Figure 1.
[image:2.595.306.536.503.669.2]Selected soil characteristics were determined by commonly used methods. Exchangeable soil pH (pHKCl) was measured potentiometrically in a 1M KCl extract (1 : 2.5; w : v) (Sparks 1996). The humus quality was assessed by the absorbances ratio of a sodium pyrophosphate soil extract (1 : 20; w : v) at the wavelengths of 465 and 665 nm (E4/E6; Sparks 1996). Organic carbon content (Corg) was determined by the rapid dichromate oxidation technique (Sparks 1996). Effective cation exchange capacity (CEC) was determined by the Mehlich method with an unbuff-ered 0.1M BaCl2 as an extraction solution. Particle size distribution was determined by the areometric method (Casagrande 1934), except the samples from the organic (H) horizon.
Humic acids (HAs) extraction was performed ac-cording to the International Humic Substance Society (IHSS) fractionation method modified by Piccolo et al. (2000). The mixture of humic substances was extracted using a solution containing 0.5 M NaOH and 0.1 M Na4P2O7. The suspension was centrifuged (11 000 rpm, 10 min) and the supernatant was de-canted to a precipitation bottle. Then, the extract was acidified to pH 1.0 using concentrated HCl in order to precipitate HAs. The mixture was left overnight, and the precipitated HAs were separated by centrifugation (11 000 rpm, 10 min). The HA fraction was purified from co-extracted mineral components (clays) by dissolution in 1M NaOH solution and consequent reprecipitation with concentrated HCl. The proce-dure was repeated several times. Furthermore, the precipitated HAs were shaken for two days with a solution containing 0.5% HCl and 0.5% HF (v/v). After
purification, HAs were neutralized and transferred into dialysis tubes in order to release chlorine from the mixture. Finally, the separated HAs were freeze-dried.
DRIFT spectra of pure (without diluting with KBr) freeze-dried HAs samples were recorded with a Thermo Nicolet Nexus spectrometer (Thermo Fisher Scientific Inc., USA). The spectrum was collected from 4000 to 400 cm–1. Gold mirror for the back-ground reference, 512 scans with resolution 2 cm–1, and conversion into Kubelka-Munk units was used. Analysis of FTIR spectra was performed using OM-NIC 9.2.41 software (Thermo Fisher Scientific Inc.).
RESULTS AND DISCUSSION
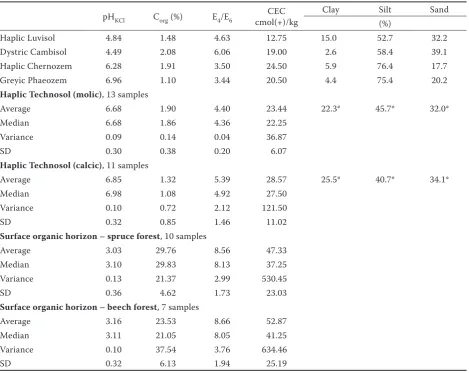
[image:3.595.64.534.359.732.2]Measured basic soil characteristics of the studied soil are summarized in Table 1. Typical differences in soil characteristics of agricultural soils are shown.
Table 1. Basic soil characteristics of the studied soils and selected statistical parameters
pHKCl Corg (%) E4/E6 cmol(+)/kgCEC
Clay Silt Sand (%)
Haplic Luvisol 4.84 1.48 4.63 12.75 15.0 52.7 32.2 Dystric Cambisol 4.49 2.08 6.06 19.00 2.6 58.4 39.1 Haplic Chernozem 6.28 1.91 3.50 24.50 5.9 76.4 17.7 Greyic Phaeozem 6.96 1.10 3.44 20.50 4.4 75.4 20.2
Haplic Technosol (molic), 13 samples
Average 6.68 1.90 4.40 23.44 22.3* 45.7* 32.0* Median 6.68 1.86 4.36 22.25
Variance 0.09 0.14 0.04 36.87
SD 0.30 0.38 0.20 6.07
Haplic Technosol (calcic), 11 samples
Average 6.85 1.32 5.39 28.57 25.5* 40.7* 34.1* Median 6.98 1.08 4.92 27.50
Variance 0.10 0.72 2.12 121.50
SD 0.32 0.85 1.46 11.02
Surface organic horizon – spruce forest, 10 samples
Average 3.03 29.76 8.56 47.33 Median 3.10 29.83 8.13 37.25 Variance 0.13 21.37 2.99 530.45
SD 0.36 4.62 1.73 23.03
Surface organic horizon – beech forest, 7 samples
Average 3.16 23.53 8.66 52.87 Median 3.11 21.05 8.05 41.25 Variance 0.10 37.54 3.76 634.46
SD 0.32 6.13 1.94 25.19
Corg – organic carbon content; E4/E6 – humus quality index; CEC – cation exchange capacity; SD – standard deviation; *adopted
Dystric Cambisol had a strongly acid soil reaction, the lowest humus quality (highest E4/E6 ratio), lower sorption capacity, the highest organic carbon content, and the lowest clay and the highest sand content. In contrast, Haplic Chernozem and Greyic Phaeozem had a neutral soil reaction, very good humus quality, high sorption capacity, and in the case of Chernozem, a relatively high organic carbon content. The dominant particle size fraction in both mentioned soil types is silt. Most of the Haplic Luvisol parameters range between those of the other studied soils, except for the sorption capacity, which is the lowest. This fact does not conform to relatively high clay content, nevertheless, analogous values from this locality presented also Šarapatka & Bednář (2015). We concluded that Haplic Technosols (molic) are very similar to Chernozems, except the content of clay
fraction, which is higher in Technosol. Topsoil ma-terial mostly originates from the Chernozem humic horizons of areas surrounding a dumpsite. Haplic Technosol (calcic) has a higher pH and CEC value, and lower humus content and quality than the molic one but texture in both soil types is similar. The origin of H horizon determines its characteristics. Usually, very high organic carbon content is related to soils with a very high sorption capacity. Low pH is connected with a high content of acids originat-ing from the litter decomposition and partially from the anthropogenic acidification. Humus quality is very low (E4/E6 ratio higher than 8). Texture was not measured, because an areometric method is not appropriate for organic soil horizons.
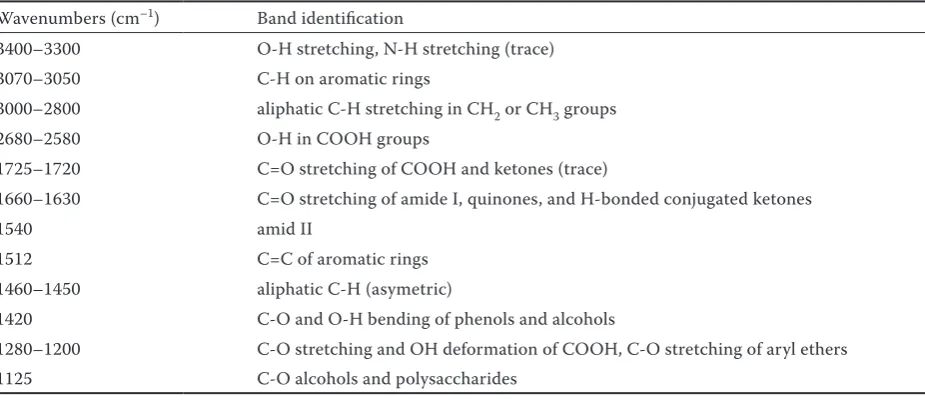
Spectra of HAs from different soils are generally similar (Figure 2). They have typical bands of aliphatic and aromatic constituents of HAs, bands of carboxyl, and also some other bands (Table 2).
[image:4.595.64.292.89.243.2]If the spectra of four different agricultural soil humic acids are compared (Figure 3), the differences are visible in bands between 3100 and 2800 cm–1. The relative difference of aromatic and aliphatic bands varies among soil types. The aromaticity in-dex was defined by Cunha et al. (2009) as AL/(AL + AR), where AR is the band intensity at 3070 cm–1 of aromatic groups and AL stands for the sum of aliphatic groups at 2930 cm–1 and 2850 cm–1. This index decreases in the order DC (0.94), HL (0.92), GP (0.91), and HCh (0.89), which means, that Cher-nozems HAs are the most aromatic. These results show that generally accepted basic differences in SOM composition among other soil types (Němeček et al.
Table 2. Main identified bands in all humic acids diffuse reflectance infrared spectra
Wavenumbers (cm–1) Band identification
3400–3300 O-H stretching, N-H stretching (trace) 3070–3050 C-H on aromatic rings
3000–2800 aliphatic C-H stretching in CH2 or CH3 groups
2680–2580 O-H in COOH groups
1725–1720 C=O stretching of COOH and ketones (trace)
1660–1630 C=O stretching of amide I, quinones, and H-bonded conjugated ketones
1540 amid II
1512 C=C of aromatic rings 1460–1450 aliphatic C-H (asymetric)
1420 C-O and O-H bending of phenols and alcohols
[image:4.595.66.529.560.760.2]1280–1200 C-O stretching and OH deformation of COOH, C-O stretching of aryl ethers 1125 C-O alcohols and polysaccharides
Figure 2. Soil humic acids diffuse reflectance infrared spectroscopy (DRIFT) spectrum with typical bands de-notations
Wavenumbers (cm−1)
Kub
elk
a-M
1990; Stevenson 1994; Sposito 2008) are projected also to the structure of isolated humic acids. The other part of spectra (1650–1720 cm–1) also indicates differences among soil types. The highest intensity of COOH band (around 1720 cm–1) is seen in DC. This band intensity further decreases in the following order: GP > HC > HL. The band around 1650 cm–1 intensity decreases from DC, GP, HL to HC. The interpretation of those differences is difficult since several bands overlap in this zone (Ferrari et al. 2011). Likewise relative difference between 1720 and 1650 cm–1 bands intensities varies among soil types. Large difference is in the HC spectrum and further decreases in following order HL > GP > HC.
The spectra of HTc humic acids are highly variable. Any general deduction is not possible. This variability is probably caused by the dumpsite covering loess layer. Humus content and quality might oscillate there (Mühlhanselová et al. 2006).
On the contrary, the HTm humic acids spectra appear similar. Figure 4 compares the average
spec-trum of HTm humic acids and the specspec-trum of HCh humic acids. In both cases we see relatively weak aliphatic bands around 3000 and 2800 cm-1 and large difference between 1720 and 1650 cm–1 bands. As mentioned above, HTm was made from Chernozem material. The results could be accounted to the re-placement, bailment, and use of the organomineral Chernozem horizon as reclamation material, did not markedly change the structure of the stable part of the organic matter.
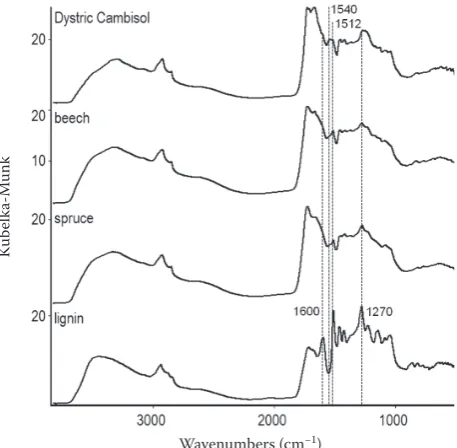
The spectra of HAs extracted from surface (H) hori-zons of forest soils are also similar. Larger differences in HA structure were observed generally between A and H soil horizons. Figure 5 shows the DC HAs spectrum selected for comparison, because DC is a soil type of forested sampling plots. H horizon HAs have a less marked peak of amid II at 1540 cm–1 and have a sharp peak of aromatic rings at 1512 cm–1. The shape and area of the oxygen groups bands between 1280 and 1200 cm–1 also differ. These results could be interpreted as higher maturity of humic acids in the organomineral A horizons than in H horizons (Cerli et al. 2008), which is documented by the presence of a higher relative amount of nitrogen in functional groups.
[image:5.595.64.289.95.294.2]Lower maturity of the H horizon humic acids il-lustrates a certain similarity of their spectra with the extracted material from the decomposing spruce wood (prepared by the same extraction method as humic acids) denoted as lignin in Figure 5, since it is the dominant part of this substance. According to both lignin and polyphenol humic substances crea-tion theory (Stevenson 1994), lignin is one of the precursors of humic and fulvic acids. This spectrum has analogical bands as humic acids spectra, but their intensities differ. There is very apparent aromatic ring breathing at 1600 cm–1 (covered in HAs spec-tra) and sharp intensive peak of aromatic moieties in lignin at 1512 cm–1, sharp also in spectra of the H Figure 3. Spectra of agricultural soil humic acids
Figure 4. Comparison of average Haplic Technosol (molic) (HTm) humic acids spectrum and the spectrum of Haplic Cher-nozem (HCh) humic acids
Wavenumbers (cm−1)
Kub
elk
a-M
unk
Wavenumbers (cm−1)
Kub
elk
a-M
[image:5.595.64.351.612.756.2]horizon HAs. A higher intensity at 1512 cm–1 than 1600 cm–1 is documented for lignin also by Agnelli et al. (2000). The dominant peak at 1270 cm–1 is characteristic for guaiacyl ring breathing (Ferrari et al. 2011). Peaks of the nitrogen group are missing in the lignin spectrum and in the case of the H horizon, particular peak of amid II is weak.
The IR spectra of HAs isolated from the spruce and beech forests spectra differ only slightly (Figure 5). On the other hand, there is one important differ-ence. Lignin from gymnosperms (spruce) consists almost entirely of guaiacyl. Angiosperms (beech) lignin consists of guaiacyl and also syringyl, which manifests itself in spectra as a peak around 1370 cm–1. A small peak of this group is also visible in beech forest HAs spectra (Figure 6).
CONCLUSION
The DRIFT spectra of soils humic acids provide useful information about HAs structure and about their different character in selected soil types and horizons. Aromaticity of isolated HAs differs among soil types. The most aromatic character was found in HAs from the Haplic Chernozems and the lowest in the Dystric Cambisols. Characteristics of dumpsite soils and SOM are mainly controlled by the dumped material. Chernozem HAs are stable and preserve
their structure during the reclamation process. It is possible to identify the source of decomposed litter (gymnosperms or angiosperms) by the DRIFT spec-tra. We can also conclude that HAs isolated from the H horizons represent a certain interstage between lignin and matured soil humic acids.
Acknowledgements. This research did not receive any spe-cific grant from funding agencies in the public, commercial, or not-for-profit sectors. The authors thank Chris Ash, Ph.D. for language corrections.
References
Agnelli A., Celi L., Degl’Innocenti A., Corti G., Ugolini F.C. (2000): Chemical and spectroscopic characterization of the humic substances from sandstone-derived rock frag-ments. Soil Science, 165: 314–326.
Angst G., Mueller K.E., Kögel-Knaber I., Freeman K.H. Mueller C.W. (2017): Aggregation controls the stability of lignin and lipids in clay-sized particulate and mineral as-sociated organic matter. Biogeochemistry, 132: 307–324. Barthes B., Roose E. (2002): Aggregate stability as an indica-tor of soil susceptibility to runoff and erosion; validation at several levels. Catena, 47: 133–149.
Bonanomi G., Incerti G., Giannino F., Mingo A., Lanzotti V., Mazzoleni S. (2013): Litter quality assessed by solid state 13C NMR spectroscopy predicts decay rate better than C/N and Lignin/N ratios. Soil Biology and Biochemistry, 56: 40–48.
[image:6.595.313.523.84.259.2]Borůvka L., Mládková L., Drábek O. (2005): Factors con-trolling spatial distribution of soil acidification and Al forms in forest soils. Journal of Inorganic Biochemistry, 99: 1796–1806.
[image:6.595.65.294.95.319.2]Figure 5. The A horizon humic acids of Dystric Cambisol (DC), average H horizon humic acids spectra of beech and spruce forest soils, and spruce lignin spectrum comparison
Figure 6. The differences between humic acids (HAs)spectra of beech and spruce forests
Wavenumbers (cm−1)
Kub
elk
a-M
unk
Wavenumbers (cm−1)
Kub
elk
a-M
Casagrande A. (1934): Die Areometr Methode zur Bestim-mung der Kornverteilung von Böden. Berlin, Springer. Cerli C., Celi L., Kaiser K., Guggenberger G., Johannsson
M-B., Cignetti A., Zanini E. (2008): Changes in humic substances along an age sequence of Norway spruce stands planted on former agricultural land. Organic Geo-chemistry, 39: 1269–1280.
Chai X., Shimaoka T., Cao X., Guo Q., Zhao Y. (2007): Spectroscopic studies of the progress of humification processes in humic substances from refuse in a landfill. Chemosphere, 69: 1446–1453.
Chenu C., Le Bissonnais Y., Arrouays D. (2000): Organic matter influence on clay wettability and soil aggregate stability. Soil Science Society of America Journal, 64: 1479–1486.
Cunha T.J.F., Novotny E.H., Madari B.E., Martin-Neto L., Re-zende M.O., Canelas L.P., Benites V.M. (2009): Spectroscopy Characterization of Humic Acids Isolated from Amazonian Dark Earth Soils (Terra Preta De Índio). In: Woods W.I. et al. (eds): Amazonian Dark Earths: Wim Sombroek’s Vision. Springer Science+Business Media B.V.: 363–372.
Ferrari E., Francioso O., Nardi S., Saladini M., Dal Ferro N., Morari F. (2011): DRIFT and HR MAS NMR characteriza-tion of humic substances from a soil treated with different organic and mineral fertilizers. Journal of Molecular Structure, 998: 216–224.
IUSS (2014): World Reference Base for Soil Resources. World Soil Resources Reports No. 106. Rome, FAO. Kara O., Bolat I.K., Cakıroglu K., Senturk M. (2014): Litter
decomposition and microbial biomass in temperate fo-rests in Northwestern Turkey. Journal of Soil Science and Plant Nutrition, 14: 31–41.
Kočárek M., Kodešová R., Kozák J., Drábek O., Vacek O. (2005): Chlortoluron behavior in five different soil types. Plant Soil and Environment, 51: 304–309.
Kodešová R., Kočárek M., Klement A., Golovko O., Koba O., Fér M., Nikodem A., Vondráčková L., Jakšík O., Grabic R. (2006): An analysis of the dissipation of pharmaceuticals under thirteen different soil conditions. Science of the Total Environment, 544: 369–381.
Liu Q., Wang S., Zheng Y., Luo Z., Cen K. (2008): Mecha-nism study of wood lignin pyrolysis by using TG-FTIR analysis. Journal of Analytical and Applied Pyrolysis, 82: 170–177.
Mbagwu J.S.C., Piccolo A. (1998): Water-dispersible clay in aggregates of forest and cultivated soils in soutthern Nigeria in relation to organic matter constituents. In: Bergström L., Kirchman H. (eds): Carbon and Nutrient
Dynamics in Natural and Agricultural Tropical Ecosys-tems. Oxford, CAB International: 71–83.
Mládková L., Rohošková M., Borůvka L. (2006): Methods for the assessment of humic substances quality in forest soils. Soil and Water Research, 1: 3–9.
Mühlhanselová M., Penížek V., Borůvka L. (2006): Study of Anthropogenic soils on a reclaimed dumpsite and their variability by geostatistical methods. Soil and Water Research, 1: 72–78.
Němeček J., Smolíková L., Kutílek M. (1990): Soil Science and Paleo Soil Science. Prague, Academia. (in Czech) Piccolo A. (2001): The supramolecular structure of humic
substances. Soil Science, 166: 810–832.
Piccolo A., Nardi S., Concheri G. (1996): Macromolecu-lar changes of humic substances induced by interaction with organic acids. European Journal of Soil Science, 47: 319–328.
Piccolo A., Celano G., Conte P. (2000): Methods of isolation and characterization of humic substances to study their interactions with pesticides. In: Cornejo J., Jamet P. (eds): Pesticide/Soil Interactions. Paris, Institut National de la Recherche Agronomique (INRA):103–116.
Schulten H.R., Schnitzer M. (1997): Chemical model struc-tures for soil organic matter and soil. Soil Science, 162: 115–130.
Sparks D.L. (1996): Methods of Soil Analysis. Part 3 – Chemical Methods. SSSA Book Series: 5, Madison, Soil Science Society of America, Inc. and American Society of Agronomy, Inc.
Sposito G. (2008): The Chemistry of Soils. Oxford, Oxford University Press, Inc.
Stevenson F.J. (1994): Humus Chemistry, Genesis, Com-position, Reactions. 2nd Ed. New York, John Wiley and
Sons, Inc.
Šarapatka B., Bednář M. (2015): Soil Science Days 2015. Czech and Slovac Soil Science in the International Year of Soil (Book of Abstracts). Olomouc, UPOL. (in Czech) Tunega D., Aquino A.J.A., Haberhauer G., Lischka H.,
Schaumann G.E., Gerzabek M.H. (2014): Molecular models of cation and water molecule bridges in humic substances. In Hartemink A.E., McSweeney K. (eds): Soil Carbon. Cham, Springer International Publishing: 107–115.