LEABHARLANN CHOLAISTE NA TRIONOIDE, BAILE ATHA CLIATH
TRINITY COLLEGE LIBRARY DUBLIN
OUscoil Atha Cliath
The University of Dublin
Terms and Conditions of Use of Digitised Theses from Trinity College Library Dublin
Copyright statement
All material supplied by Trinity College Library is protected by copyright (under the Copyright and
Related Rights Act, 2000 as amended) and other relevant Intellectual Property Rights. By accessing
and using a Digitised Thesis from Trinity College Library you acknowledge that all Intellectual Property
Rights in any Works supplied are the sole and exclusive property of the copyright and/or other I PR
holder. Specific copyright holders may not be explicitly identified. Use of materials from other sources
within a thesis should not be construed as a claim over them.
A non-exclusive, non-transferable licence is hereby granted to those using or reproducing, in whole or in
part, the material for valid purposes, providing the copyright owners are acknowledged using the normal
conventions. Where specific permission to use material is required, this is identified and such
permission must be sought from the copyright holder or agency cited.
Liability statement
By using a Digitised Thesis, I accept that Trinity College Dublin bears no legal responsibility for the
accuracy, legality or comprehensiveness of materials contained within the thesis, and that Trinity
College Dublin accepts no liability for indirect, consequential, or incidental, damages or losses arising
from use of the thesis for whatever reason. Information located in a thesis may be subject to specific
use constraints, details of which may not be explicitly described. It is the responsibility of potential and
actual users to be aware of such constraints and to abide by them. By making use of material from a
digitised thesis, you accept these copyright and disclaimer provisions. Where it is brought to the
attention of Trinity College Library that there may be a breach of copyright or other restraint, it is the
policy to withdraw or take down access to a thesis while the issue is being resolved.
Access Agreement
By using a Digitised Thesis from Trinity College Library you are bound by the following Terms &
Conditions. Please read them carefully.
: '
*■ ^
-JFii,- -
if
Essays on the Income, W ealth and Family Transfers of the
Older Generation
A THESIS SUBMITTED TO THE UNIVERSITY OF DUBLIN, TRINITY COLLEGE
IN APPLICATION FOR THE DEGREE OF DOCTOR OF PHILOSOPHY
BY
S anna Nivakoski
Supervised by
Professor A lan B a rre tt
and
D e c la ra tio n
I declare th a t this thesis has not been subm itted as an exercise for a degree at this or any
other university and it is entirely my own work.
I agree to deposit this thesis in the U niversity’s open access institutional repository or
allow the library to do so on my behalf, subject to Irish Copyright Legislation and Trinity
College Library conditions of use and acknowledgement.
^JR W iJ Y
c o lle g e
'1 < MAY 2015
^
LIBRARY DUBUNj^
S u m m a ry
T his thesis consists of three core chapters which contain em pirical analyses of financial
decision-m aking among older people. The chapters focus on pension coverage, retirees’
incomes and replacem ent rates, subjective life expectancy and its effect on w ealth and the
exchange motive in intergenerational transfers from parents to their adult children. The
d a ta used in the exam ination of these topics come from th e first two waves of T he Irish
Longitudinal Study on Ageing (TILDA).
Following an introductory chapter th a t m otivates the research in this thesis, the second
chapter examines current Irish retirees’ incomes, pension coverage and retirem ent income
replacem ent rates. Because of th e virtually fiat rates of paym ent of S tate welfare pensions,
supplem entary (i.e. private and occupational) pensions play an im p o rtan t role in replacing
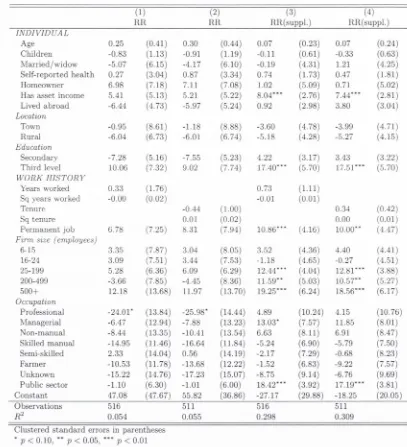
labour earnings in retirem ent. P rom pted by this finding, an exploration of factors th a t
determ ine w hether or not a retiree is in receipt of income from a supplem entary pension
is carried out. Focusing on retirees who have worked in the private sector where supple
m entary pension saving is not m andatory, th e findings of a m ultivariate analysis suggest
th a t both work history and individual socio-economic characteristics are significant in ex
plaining the variation in supplem entary pension coverage. Individuals w ith low education
levels, w ith no asset income, those who live outside Dublin and those previously employed
in small firms or w ith short tenures in th eir last employm ent are less likely to receive in
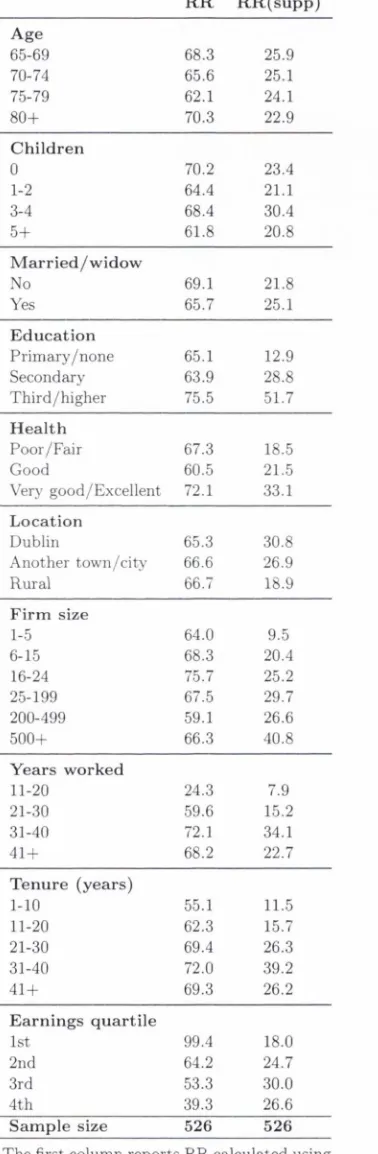
come from a supplem entary pension. R etirem ent income replacem ent rates are calculated
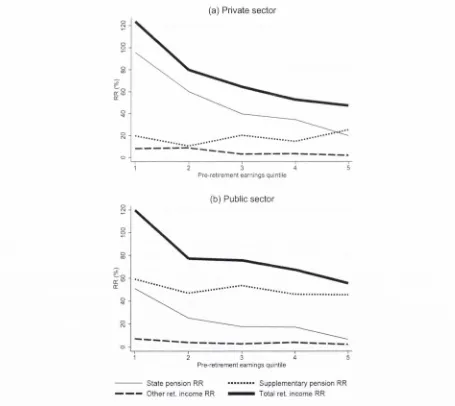
using retrospective d a ta on past earnings. Because S tate welfare pension paym ent rates
are not linked to earnings, the pension system is highly progressive; replacem ent rates fall
continuously across the pre-retirem ent earnings distribution, with the ra te of decline faster
am ong former private sector employees (com pared to the public sector). Supplem entary
pensions add an earnings-related com ponent to the overall pension system and insulate the
post-retirem ent incomes of middle- and high-earners to some degree.
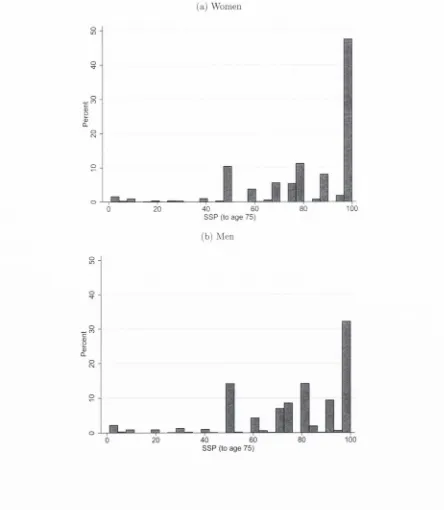
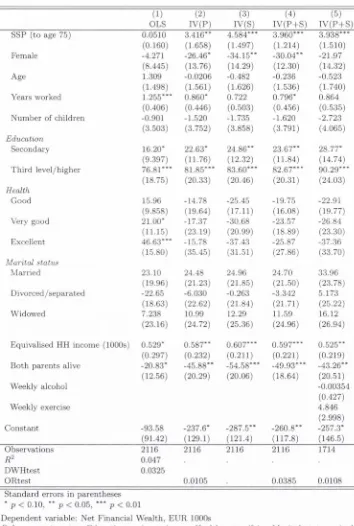
used to address biases caused by m easurem ent error in the SSP responses and the reverse
causahty between SSP and wealth. A positive and statistically significant effect of SSP on
wealth is found: a 1 percentage point increase in the self-assessed probability of reaching
age 75 increases an individual’s financial wealth by approxim ately EUR 3,400. This effect
corresponds to a 3.9 per cent increase a t the mean wealth level. The corresponding effect
on to tal w ealth (financial wealth and pension wealth) is an increase of approxim ately EU R
6,200 (a 1.7 per cent increase at the mean). The significant positive effect is also found
after th e exclusion of defined benefit and social welfare pension wealth (which are arguablj^
com putationally related to hfe expectancy). Specifications excluding people whose parents
died before the age of 50 and those w ith focal responses to the SSP question provide find
ings sim ilar to those of the m ain models. The findings are relevant to pension system
reforms: the outcomes of pension system s with high individual responsibility for m aking
retirem ent provisions depend in p a rt on the abihty of individuals to make decisions based
on correct assessm ents of m ortality risk.
A cknow ledgem ents
I am grateful to the Irish Research Council for providing the funding th a t allowed me to
dedicate four years to these studies.
I would like to thank my supervisors, Dr. Micheal Collins and Professor Alan B arrett,
w ithout whom my Ph.D. experience would undoubtedly not have been such a positive one.
Micheal guided me through the first year of Ph.D studies, providing me with suggestions
for research directions and positive encouragement. W hen Micheal was leaving Trinity, he
suggested th a t I look into working w ith TILDA d a ta in my thesis. This was an excellent
idea, and led me to become a part of the TILDA research family for three years. I am
forever grateful to Alan who supervised the final three years of my Ph.D . studies, for
generosity with his time, for his advice and inspiration, and the deadlines. I hope th a t
other students have the privilege of working with Micheal and Alan in the future, as I
could not have asked for b etter supervision.
The staff at the Trinity Economics D epartm ent deserve thanks for organising excellent
postgraduate economics programmes. I have w ithout doubt learnt a great deal during the
five years I have spent here. I am especially grateful to Professor Michael W ycherley for
his dedication while working as the Ph.D . coordinator, and to Professors Francis O ’Toole,
Paul Scanlon, Carol Newman and G aia Narciso for guidance in my Teaching Assistant
roles over the last four years. C olette Ding, Siobhan O ’Brien, Trish Hughes and Colette
Keleher are always generous with their help and advice, and make us students feel at home
and well looked after.
I am grateful for the feedback and helpful suggestions I received over the years from the
stafT and students a t the Trinity Economics D epartm ent annual presentations and the
Microeconomics Working Group. I would also like to acknowledge the valuable input of
the participants at the TILDA Socio-economic Working Group, the conferences I have
attended, and the editors and referees of T he Economic and Social Review.
My fellow Ph.D . student friends, especially Corina, Juha, Ben, C hristian, Amy, Rob, Cat,
Bibi, Sara, Michael and Shqipe, have been there to share the many happy moments of
student life with, and shoulders to lean on during the few tough ones. I ’m looking forward
to many more years of friendship, wherever life take us after Trinity.
My lovely families in Finland and Ireland have always been extrem ely supportive of my
studies, even if they have taken many years and (nearly as many) moves between countries.
A lthough some parts of the studies have been quite consuming, my families have given me
a good balance between work and other things.
C ontents
1
I n t r o d u c t i o n ...
1
2 D e te r m in a n ts o f p e n sio n cov erag e and r e tir e m e n t in c o m e re p la ce m en t
r a t e s ...
4
2.1
In tro d u c tio n ...
4
2.2
Irish pension s y s t e m ...
6
2.2.1 State welfare p e n s io n s ...
7
2.2.2 O ccupational p e n s io n s ...
8
2.2.3 Private p e n s i o n s ...
9
2.3
Existing r e s e a r c h ...
9
2.4
D a t a ...
11
2.4.1 Descriptive s t a t i s t i c s ...
13
2.5
Supplem entary p e n s i o n s ...
20
2.6
R etirem ent income replacem ent r a t e s ...
24
2.7
Conclusion
...
31
A p p e n d ic e s
...
33
2.A
Irish pension system: additional in fo rm a tio n ...
33
2.B
Income c a lc u la t io n ...
35
2.C
Unfolding brackets and d a ta i m p u t a ti o n ...
36
3
W ea lth and th e effect o f s u b je c tiv e su rviva l p r o b a b i l i t y ...
38
3.1
In tro d u c tio n ...
38
3.2
Existing r e s e a r c h ...
41
3.2.1 Theory of m ortahty risk and saving ...
41
3.2.2 Subjective survival p r o b a b i l i t y ...
42
3.2.3 Empirical studies of SSP and s a v i n g ...
44
3.3
D a t a ...
46
3.3.1 Control variable sum m ary statistics ...
46
3.3.2 W ealth
...
47
3.3.3 Subjective survival probability ...
50
3.4
M e th o d o lo g y ...
51
3.5
R e s u lts ...
57
3.5.1 2SLS first s t a g e ...
57
3.5.2 Effect of SSP on financial w e a l t h ...
59
3.5.3 Effect of SSP on to tal w e a l t h ...
60
3.5.4 Analysis by m arital s t a t u s ...
61
3.5.5 Robustness analysis ...
67
A p p e n d ic e s
...
72
3.A
Supplem entary tables
...
73
3.B W ealth c a lc u l a tio n ...
76
3.B.1 Net financial w e a l t h ...
77
3.B.2 Supplem entary pension w e a l t h ...
77
3.B.3 Social welfare w e a lth ...
79
3.C
Unfolding brackets and d ata i m p u ta ti o n ...
85
4 T h e ex c h a n g e m o tiv e in in terg e n e ra tio n a l t r a n s f e r s ...
86
4.1
In tro d u c tio n ...
86
4.2
Transfer motives: Altruism and exchange ...
89
4.2.1 Identifying transfer m o t iv e s ...
90
4.2.2 Differences in motives for
inter vivos
and b e q u e s t s ...
92
4.3
Existing empirical e v i d e n c e ...
92
4.4
D a t a ...
94
4.4.1
In ter vivos
t r a n s f e r s ...
95
4.4.2 Expected b e q u e s t s ...
98
4.4.3 Help provided by c h ild r e n ...
98
4.4.4 Control v a r ia b le s ...
99
4.5
M ultivariate a n a ly s is ...103
4.5.1 Cross-sectional probit models of the transfer d e c isio n ... 103
4.5.2 Cross-sectional models of transfer v a l u e ...109
4.5.3 Issues of causahty ...110
4.6
Conclusion
... 116
A p p en d ice s
... 118
4.A Continuous measure of help (hours per d a y ) ... 119
4.B
Gifts and bequests in I r e l a n d ...122
4.B.1 Capital Acquisitions Tax
...122
4.B.2 Division of b e q u e s t s ...123
List of Figures
2.1
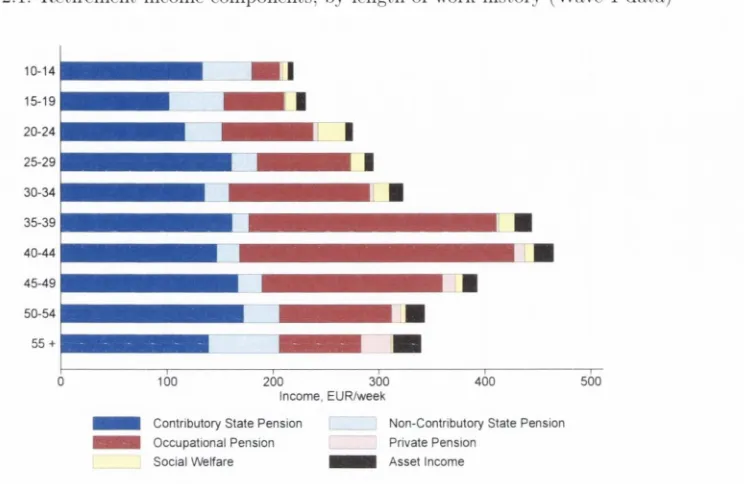
R etirem ent income com ponents, by length of work history (Wave 1 d ata)
.
19
2.2
R etirem ent income com ponents, by sector of former employment (Wave 1
d a t a ) ...
19
2.3
Replacement rates from different sources, by pre-retirem ent earnings quintile 28
3.1
Life expectancy a t b irth and average effective age of retirem ent in Ireland,
List of Tables
2.1
Selection of the analysis s a m p l e ...
13
2.2
Individual socio-economic variables (Wave 1 data) ...
14
2.3
Work history variables (Wave 1 data)
...
15
2.4
Percentages in receipt, by income quartile (Wave 1 d a t a ) ...
17
2.5
Individual income from different sources in EUR., by income quartile CW'ave
1 d a t a ) ...
17
2.6
Equivalised income from different sources in EUR,, by income quartile (Wave
1 d a t a ) ...
18
2.7
Supplem entary pension coverage, by individual socio-economic characteris
tics (private sector only. Wave 1 d a t a ) ...
21
2.8
Supplem entary pension coverage, by work history characteristics (private
sector only, Wave 1 d ata) ...
22
2.9
Supplem entary pension coverage. P robit m arginal effects at means, private
sector employees only ...
25
2.10 Mean values of retirem ent income replacem ent r a t e s ...
27
2.11 OLS regression models (public and private sectors in c lu d e d ) ...
30
3.1
Selection of the analysis s a m p l e ...
46
3.2
Descriptive statistics by g e n d e r ...
48
3.3
Percentages holding wealth, by to tal wealth q u a r t i l e ...
49
3.4
Mean values of wealth holdings (EUR), by to tal wealth q u a r ti le ...
49
3.5
Mean values of SSP, by variables correlated w ith m o rta lity ...
54
3.6
First-stage re s u lts ...
58
3.7
OLS and IV results, financial w e a l t h ...
62
3.8
OLS and IV results, to tal w e a l t h ...
63
3.9
OLS and IV results for single h o u seh o ld s...
65
3.10 OLS and IV results for two-person households, using husband’s characteristics 66
3.11 OLS and IV results, excluding Defined Benefit and social welfare pensions .
68
3.12 OLS and IV results, excluding early orphans
...
69
3.13 OLS and IV results, excluding focal re s p o n se s ...
70
3.14 First-stage results for single households ...
73
3.15 First-stage results for two-person households, using the husband’s charac
teristics only ...
74
3.16 First-stage results, by g e n d e r ...
75
3.17 Means test for Non-contributory State welfare p e n s i o n ...
83
4.1
Selection of the analysis s a m p le ...
96
4.4
Help provided by children to parents during past 2 y e a r s ...100
4.5 M eans and stan d ard deviations of control v a r ia b le s ... 102
4.6 P ro b it models of
Tpj-ot
for
inter vivos
transfers, marginal effects a t mean . . 107
4.7 P ro b it models of
Tpr^h
for planned bequests, m arginal effects a t mean
. . . 108
4.8 OLS models of
Tyaiue
for
inter vivos
transfers, conditional on
Tyaiue
> 0 . . 110
4.9 Models of small
inter vivos
transfers
{Tprob
and
Tyaiue)
in Wave 2 (with
additional c o v a riates)... 115
4.10 Fixed effects Logit
{Tpj-ob)
... 116
4.11 P ro b it models of
Tp^ob
using help hours, marginal effects a t m e a n ... 119
4.12 P ro b it models of
Tprob
for planned bequests (marginal effects a t m ean), using
help h o u r s ... 120
4.13 OLS models of
Tyaiue
for
inter vivos
transfers conditional on
Tyaiue >
0,
using help hours ...121
4.14 CAT exempt thresholds for gift tax by donor group type, and CAT rate due
C h ap ter 1
Introduction
The ageing of populations in many countries lias m otivated research into the economic
circum stances of people as they age. Demographic changes have raised concerns about
future pension provision and the sustainability of current pension systems. Arising from
these concerns, topics th a t are of interest to researchers and policy makers alike include the
adequacy of retirem ent provisions, individuals’ behavioural responses to changing longevity
and the role of the state in redistributing resources between generations. This thesis uses
recently collected m icro-data from Ireland to explore three research questions related to
these issues: W hat are the determ inants of retirees’ pension coverage and adequacy? Do
individuals’ longevity expectations affect their w ealth accum ulation? Does the exchange
motive play a role in intergenerational transfers from older parents to their adult children?
Ireland has a relatively young population in comparison to other European countries: the
Irish old-age support ratio^ is projected to decrease from 5.4 to 2.3 between 2010 and
2050, whereas the ratio is expected to decrease from 3.5 to 1.8 over the same tim e period
in the European Union overall (E urostat, 2012). T he increasing length of tim e spent in
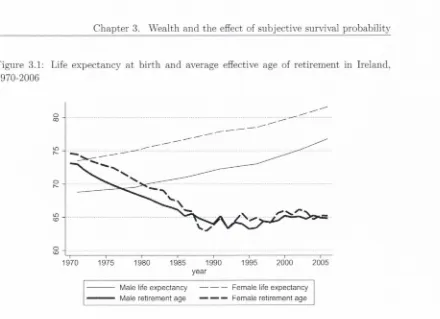
retirem ent is evident when examining Irish d ata on longevity and retirem ent ages: between
1970 and 2005, life expectancy at b irth increased by approxim ately six years whereas
effective retirem ent age^ decreased by nearly ten years.^ As a reflection of these trends,
the N ational Pensions Framework projects an increase in the country’s public pension
spending from approxim ately 5.5 per cent of GDP in 2008 to almost 15 per cent of GDP
in 2050 (D epartm ent of Social and Family Affairs, 2010).
The Irish government has acknowledged the challenges facing future pension provision.
C urrently, Irish S tate welfare pensions are not related to earnings, and therefore most
of the income replacem ent in retirem ent is done via supplem entary pensions (over and
'T h e old-age support ratio is the ratio of working age population (aged betw een 20 and 64 years) to
population aged 65 and over.
^The average effective retirement age is defined as the average age of ex it from th e labour force during a
5-year period (Keese. 2006).
C hapter 1. Introduction
above S tate welfare pensions). Supplem entary pension saving is not currently m andatory
for private sector employees, which leads to large variations in supplem entary pension
coverage and pension contribution rates. The N ational Pensions Policy Initiative set a
target for a supplem entary pension coverage rate of 70 per cent for the to tal workforce
over the age of 30 (Pensions Board, 1998). A target of 50 per cent of gross pre-retirem ent
income was also set for retirem ent income replacem ent rates, subject to a minimum of
34 per cent of average industrial earnings. These targets were re-stated in the Green
P aper on Pensions (D epartm ent of Social and Family Affairs, 2007) with a suggestion
th a t the targets could only be m et through the introduction of m andatory supplem entary
pensions. T he introduction of m andatory or ’’soft-m andatory”'* supplem entary pensions
was also recommended in the O E C D ’s Review of the Irish Pension System (O rganisation
for Economic C o-operation and Development, 2013c).
In the hght of these concerns. C hapter 2 examines how the Irish pension system has per
formed for the current cohort of retirees. The analysis focuses on retirees’ incomes, income
compositions, supplem entary pension coverage and retirem ent income replacem ent rates.
M ultivariate analyses highlight the individual socio-economic and work history charac
teristics th a t are associated w ith supplem entary pension coverage and retirem ent income
replacement rates.
Policies th a t increase individual responsibility for retirem ent saving are commonly sug
gested as ways to alleviate pressures on public finances caused by rising pension expendi
tures. T he success of such policies depends partly on individual ability to make rational
saving decisions th a t incorporate correct assessments of m ortality risk. The traditional
life-cycle model of saving and consum ption predicts th a t individuals with lower m ortality
risk should accum ulate more wealth during their working lives,
ceteris paribus (Hurd et al.,
1998; Alessie and K apteyn, 2001; Bloom et al., 2004).
C hapter 3 examines the extent to which saving behaviour is rational in this respect, by
testing w hether longevity expectations affect individual wealth accum ulation. The em pir
ical strategy is to examine the causal link between people’s subjective survival probability
— a proxy m easure of self-assessed life expectancy — and w ealth levels. Subjective survival
probability questions have been included in many ageing studies, and the d a ta have been
found to have strong predictive power for actual m ortality. Subjective survival probabil
ity estim ates are also highly correlated with life table survival probabihty estim ates and
with known m ortality risk factors.® Therefore, subjective survival probability d a ta provide
“*A ’’soft-m andatory” schem e is one where an employee is au tom atically enrolled but th ey may opt out if
they wish.
C hapter 1. Introduction
valuable inform ation about individual heterogeneity in m ortality, which can be exploited
in micro-level analyses.
The analysis in C hapter 3 captures all wealth types (including pensions) and uses instru
m ental variables to deal w ith the endogeneity of survival beliefs, thereby addressing the
two m ajor challenges in empirical studies on th e effect of longevity expectations on saving.
Funding consum ption in retirem ent is an im portant motive for accum ulating wealth, but
other reasons also exist. One of these reasons is to transfer wealth to one's children.
Economists have examined patterns of these intergenerational transfers and the motives
influencing them . The two m ain motives th a t have been suggested are th a t parents are
either altruistic or th a t transfers are made in exchange for services th a t children provide.
P arents transfer wealth via bequests and give m onetary gifts to their their children while
they are ahve (i.e.
inter vivos
transfers). Transfers between generations are common
even in developed countries with public income redistribution and public care provision,
which should reduce the need for family members to rely on each other for assistance.
Studies by Kotlikoff et al. (1981), P iketty (2011) and Ohlsson et al. (2014) have examined
intergenerational transfers in different countries and have generally found th a t a large
proportion of people’s wealth is passed on from one generation to the next rather th an
accum ulated over the individual's life-cycle.
C hapter 4 examines the presence of the exchange m otive in intergenerational transfer
behaviour by studying the causal effect of help th a t ad u lt children provide to their parents
and m onetary transfers th a t flow in the opposite direction. M cGarry (1999) and Bernheim
and Severinov (2003) suggest th a t
inter vivos
transfers are b e tte r suited to exchange and
therefore are likely not to be influenced by the same motives as bequests. Therefore, the
analysis in C hapter 4 models both
inter vivos
transfers and expected bequests.
Chapter 2
D eterm in an ts o f pension coverage and
retirem ent incom e replacem ent rates
2.1
In trod u ction
In Ireland, the absence of statu to ry earnings-related pensions in the private sector has
led to large variations in pension coverage and adequacy. This C hapter uses recent d a ta
from The Irish Longitudinal Study on Ageing (TILDA) to develop an insight into how
the pension system has perform ed for the current retiree cohort. The analysis focuses on
retirees’ income levels, income sources, supplem entary pension coverage and retirem ent
income replacem ent rates and compares them to targets set by the government. The
research aims to inform future pension policy affecting current labour m arket participants.
The Irish S tate provides welfare pensions which are m ade up of the C ontributory and the
N on-contributorj' pensions.^ E ntitlem ents to the former are built up over the working life
of an individual through the accum ulation of Pay-R elated Social Insurance (PRSI) credits.
The latter is m eans-tested. The S tate welfare pensions guarantee a basic retirem ent income
and are not linked to earnings. Supplem entary pensions (over and above the S tate welfare
pensions) consist of private and occupational pensions which replace the m ajority of labour
income in retirem ent.
Ireland is one of only two OECD countries (the other being New Zealand) w ith no statu to ry
earnings-related pension provision in the private sector (W hiteford and W hitehouse, 2006).
Much of th e responsibility for retirem ent saving therefore lies w ith the individual, leading
to large variations in supplem entary pension coverage and retirem ent income replacement
rates. In th e Irish context, this research updates retirees’ income analysis using a large,
nationally representative new d a ta source th a t purposely samples the older population.
In addition, the calculation of individuals’ retirem ent income replacem ent rates has not
previously been carried out at the individual level in Ireland.
C hapter 2. D eterm inants of pension coverage and retirem ent income replacem ent rates
This research is m otivated by global concerns about the funding of pension systems in the
future, stem ming from the ageing of populations. In Ireland, the old-age support ratio^
is projected to decrease from 5.4 in 2010 to 2.3 in 2050, whereas the ratio is expected
to decrease from 3.5 to 1.8 over the same tim e period in the European Union overall
(E urostat, 2012). Although the Irish population is relatively young com pared to other
European countries — due to a relatively recent decline in fertihty and net em igration
before the 1990s — the Irish government has acknowledged the challenges facing future
pension provision (D epartm ent of Social and Family Affairs, 2002). The N ational Pensions
Framework (D epartm ent of Social and Family Affairs, 2010) projects an increase in public
pension (State w^elfare pensions and public service occupational pensions) spending in
Ireland from approxim ately 5.5 per cent of GDP in 2008 to alm ost 15 per cent of G D P in
2050. The Framework highlights the need for increased supplem entary pension coverage
and higher contribution rates among those covered.
In the N ational Pensions Pohcy Initiative, the Irish Pensions Board — the national pensions
industry regulator — set a target for a supplem entary pension coverage rate of 70 per cent
for the total workforce over the age of 30 (Pensions Board, 1998). A target of 50 per
cent of gross pre-retirem ent income was also set for retirem ent income replacem ent rates,
subject to a minimum of 34 per cent of average industrial earnings (Pensions Board, 1998).
These targets were restated in the Green P aper on Pensions (D epartm ent of Social and
Family Affairs, 2007) w ith a suggestion th a t the targets could only be m et through th e
introduction of m andatory supplem entary pensions.^ The introduction of m andatory or
"soft-m andatory" supplem entary pensions was also recommended in the O E C D ’s Review
of the Irish Pension System (O rganisation for Economic Co-operation and Development,
2013c).
This C hapter firstly focuses on the levels and compositions of retirees' incomes, examined
across different educational, occupational and work history categories. The exam ination
highlights the im portance of supplem entary pensions in determ ining retirees’ incomes. This
is due to the stru ctu re of the Irish pension system: the S tate welfare pensions are flat-rated
and not related to earnings and therefore only provide a minimum level of income for
retirees. Because supplem entary pensions contribute m ost to the variance of retirem ent
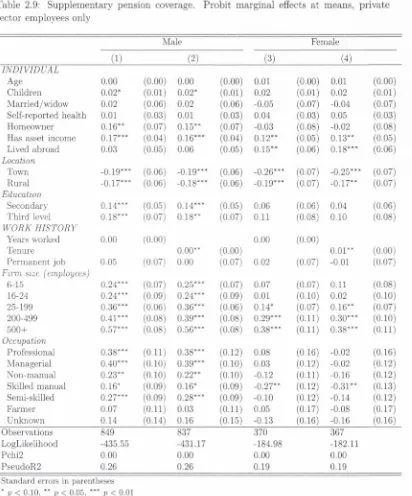
incomes, it is of interest to investigate which factors determ ine supplem entary pension
coverage. This analysis is carried out by estim ating m ultivariate models of the probability
th a t an individual who has worked in the private sector (with no statu to ry supplem entary
^The old-age support ratio is the ratio of working age population (people between th e ages of 20 and 64)
to population aged 65 and over.
C h a p te r 2. D ete rm in a n ts of pension coverage an d re tire m e n t incom e rep lacem en t ra te s
pension) p rio r to re tire m e n t receives incom e from a su p p lem en tary pension. T h is analysis
finds th a t in d iv id u als w ith low levels of ed u catio n , th o se w ith no asset incom e, those who
live o u tsid e D ublin a n d th o se previously em ployed in sm all firm s or w ith sh o rt ten u res in
th e ir last em ploym ent are less likely to receive incom e from a su p p lem en tary pension.
C om bining c u rre n t re tire m e n t incom e d a ta w ith p a s t earn in g s d a ta of each ind iv id u al allows
for th e calcu latio n of a re tire m e n t incom e rep lacem en t ra te w hich is defined as th e ra tio of
c u rren t incom e to in flatio n -ad ju sted p re -re tirem e n t la b o u r earnings. R ep lacem en t ra te s fall
continuously across th e p re -retirem en t earnings d istrib u tio n , w ith th e ra te of decline faster
am ong form er p riv a te sector em ployees com pared to th o se who re tire d afte r having worked
in th e public sector. A m u ltiv ariate analysis suggests th a t,
ceteris paribus,
su p p lem en tary
pensions replace a g re a te r sh are of earnings for individuals w ith higher ed u catio n , who
have worked in larger firms, in w hite-collar o ccu p atio n s or in th e public sector.
T he re m ain d er of th is C h a p te r is s tru c tu re d as follows: Section 2.2 describes th e Irish
pension system w hile Section 2.3 sum m arises th e relevant in te rn a tio n a l and Irish lite ra tu re .
Section 2.4 p resen ts th e d a ta an d d escriptive s ta tistic s, followed by Section 2.5 w hich
discusses su p p lem en tary pension coverage an d p resen ts th e findings of p ro b it m odels of
su p p lem en tary pension receipt. Section 2.6 p resen ts th e resu lts of th e re tire m e n t incom e
rep lacem en t ra te analysis. Section 2.7 offers concluding rem arks. A p p en d ix 2.A contains
ad d itio n al in fo rm atio n a b o u t th e Irish pension system . A p pendix 2.B explains th e m eth o d
for calcu latin g c u rren t incom e from different sources an d A p pendix 2.C provides d etails
a b o u t th e im p u ta tio n m eth o d s used for replacing m issing values in th e incom e variables.
2.2
Irish p en sio n sy stem
T h e Irish p ension system can b e divided in to th re e pillars: S ta te w elfare pensions, occu
p a tio n a l p ensions and p riv ate pensions.'^ T hese th re e pillars, th e p ay m en t rules th a t apply
to th e co h o rts being analysed in th is C h a p te r and th e p ay m en t ra te s in 2010 (w hen th e
m ajo rity of T IL D A W ave 1 d a ta was collected) are described below.^
^Traditionally, pension system s can be divided into two main types: Bism arckian and Beveridgean, the
first of which are typical of continental Europe. Bism arckian sta te pensions are, in general compulsory
for workers, entitlem ents are strongly linked to contributions, and retirem ent income replacem ent rates
are high. Beveridgean sta te pension systems, on th e other hand, are traditional in Anglo-Saxon countries.
M embership is universal and th e link between contributions and benefits is weaker, with th e state providing
a flat-rate paym ent which guarantees a minim um level of retirem ent income. The Irish system is of the
Beveridgean type.
C hapter 2. D eterm inants of pension coverage and retirem ent income replacem ent rates
2.2.1
S ta te w elfare p en sio n s
T he S tate welfare pensions consist of C ontributory and N on-contributory pensions.® Both
of these pensions are Bat-rated
and are not linked to earnings, and therefore act as a
safety net to keep retirees’ incomes from falling below a certain threshold. The paym ent
rates are not indexed, however paym ent rates are am ended in governmental budgets at the
discretion of the Minister.^ For all S tate welfare pensions, there are additional paym ents
for dependants.
E ntitlem ents to the C o n t r i b u to r y S t a t e w e lfa re p e n s io n are built up over the working
career of an individual through the accum ulation of Pay-R elated Social Insurance (PRSI)
credits, and the paym ent is not m eans-tested. For the population under analysis in this
Chapter,® to qualify for C ontributory S tate pension, an individual m ust have reached the
S tate Pension Age (SPA) of 66 years,^ started paying social insurance before reaching age
56, and paid social insurance contributions for at least 5 years. Additionally, the individual
needs to meet one of the two criteria for minimum average contributions:
Option A If the person has paid contributions for an average of 48 weeks (or more) per year
since 1979. they are entitled to the full (meiximum rate) pension.
Option B If the person does not qualif\' under Option A. they are assessed under O ption B.
If the person has paid contributions for an average of 10 weeks (or more) per year
since 1953^°. they are entitled to the minimum rate pension. A yearly average of 48
full ra te contributions since 1953^^ is needed for the maxim um paym ent rate.
In 2010, the minimum gross paym ent ra te was EUR 115.20 per week per person, and the
maximum gross paym ent rate was EUR 230.30 per week per person. There were increases
for people living alone, and for those aged 80 years or over, and for those living on certain
offshore islands.
®A part of the C ontributory S tate welfare pension, th e Transition S tate welfare pension, was payable from
th e age of 65 b u t had higher contribution requirem ents th an the contributory S tate welfare pension. As
this analysis only includes people aged 66 or over, income from th e Transition S tate welfare pension is
zero.
' The indexation of the S tate w'elfare pensions to wages or inflation has been suggested by O rganisation for
Economic Co-operation and Development (2013a).
®The qualification rules for the C ontributorv S tate pension depend on year of birth. For rules th a t apply
to younger cohorts, see A ppendix 3.B.
®State Pension Age (SPA) is depends on th e year of b irth of the individual as outlined in th e Social Welfare
and Pensions Act of 2011. It is 66 for those born before 1954. 67 for those born between 1954 and 1960
and 68 for those born in or after 1961.
C hapter 2. D eterm inants of pension coverage and retirem ent income replacem ent rates
As the pension is only payable from S tate Pension Age, no allowances are m ade for early
retirem ent. Suggestions have been m ade about decrem ents (more flexibility in deciding
when to retire) and increments (to the for workers to remain in the labour m arket longer)
to the paym ent rates of the C ontributory S tate pension.
The C ontributory S tate welfare pension paym ents are financed on a pay-as-you-go (PAYG)
basis from the Social Insurance Fund (SIF). C ontributions to the SIF are m ade by employ
ees, employers and the self-employed (social insurance contributions for the self-employed,
class S, were introduced in 1988), b u t not retirees. The Exchequer covers any gaps between
revenues and expenditures.
A paym ent to a widow(er) — the W idow’s, W idower’s or Surviving Civil P a rtn e r’s (Con
tributory) Pension — is paid to the husband, wife or civil partn er of a deceased person.
The paym ent is not m eans-tested. T he paym ent rates and qualification rules are explained
in Appendix 2.A.
The second type of S tate pension is the N o n - c o n t r ib u to r y S ta t e w e lfa re p e n s io n ,
which is a m eans-tested social insurance paym ent, financed through general taxation. The
eligibility for pension does not depend on past employment history. In order to qualify
for the non-contributory S tate welfare pension, a person must have reached S tate Pension
Age, must not be eligible for the C ontributory S tate welfare pension, must pass a means
test based on both income and wealth (see A ppendix 2.A), and m ust be habitually resident
in Ireland.
In 2010, the N on-contributory S tate welfare pension was payable from age 66 and the
maxim um pre-tax rate of pajmient w'as EUR 219 per week per person (allowing for weekly
means assessment of up to EUR 30). The first EUR 30 per week of m eans are disregarded.
After th a t, the pension is reduced by EU R 2.50 each week for every EU R 2.50 of weekly
means. T he minimum pre-tax ra te of paym ent was EUR 4 per week per person (allowing
for weekly m eans assessment of between EU R 242.50 to EUR 245). No paym ents were
made to those with assessed weekly means of EUR 245 or more. There were increases for
people living alone, and for those aged 80 years or over, and for those living on certain
offshore islands.
2.2.2
O ccu pational p en sion s
C hapter 2. D eterm inants of pension coverage and retirem ent income replacem ent rates
schemes. C ontributions to occupational pensions are deductible from income taxation (up
to certain limits). Public service occupational pension schemes are in place for staff in
the civil service, local authorities, G arda Si'ochana (the Irish police), the defence forces,
the health and education sectors and non-commercial S tate bodies. P ubhc service pension
schemes are m ainly statutory, and virtually all of th e schemes are financed on a PAYG
basis.
Like many other OECD countries, Ireland has seen a shift from DB to DC schemes. In
DB plans, members may be able to take an actuarially reduced early retirem ent (as op
posed to the typical S tate Pension Age retirem ent at age 65) from age 50 onwards. Early
retirem ent due to ill-health is allowed at any age. Deferred retirem ent is usually possible
and increments are paid in th a t case. A typical occupational DB pension plan would have
an accrual rate of l/6 0 th for each year of service, therefore resulting in a maximum of
66 per cent of pensionable salary after a 40 years of contributions. Most DB schemes are
integrated with the S tate pension. Employees are generally required to contribute to DB
plans. W hen it comes to DC pensions, average contribution rates are usually between 5
and 10 per cent of earnings, with employers and employees making equal contributions.
2.2.3
P rivate p en sio n s
Private pensions are voluntary and consist of R etirem ent Annuity C ontracts (RACs) w'hich
are commonly used by the self-employed, and Personal R etirem ent Savings Accounts
(PRSAs) which were introduced in 2002 w ith an aim of increasing pension coverage among
low-coverage employee groups. Subject to certain limits, contributions to private pensions
are deductible from income taxation. Contributions to private pension plans are generally
m ade by the employee only. Employers m ust offer access to a PR.SA to any employee who
is not eligible to join an occupational pension scheme.
2.3
E xisting research
According to M ath (2004), the general trend in European pension reforms has been to
limit future expenditure on pay-as-you-go state pension schemes by prom oting privately
provided funded schemes and other forms of long-term saving.
Similar reforms have also
taken place or are under review in Ireland (D epartm ent of Social and Family Affairs, 2010).
^^Other changes th a t have taken place in many E uropean countries include th e reduction of rates of pay of
C hapter 2. D eterm inants of pension coverage and retirem ent income replacement rates
The trends towards more individual responsibility about the choice to save, how much to
save and how to invest those savings has led to a growing strand of h teratu re exploring the
abihty of individuals to make retirem ent saving decisions and individuals’ characteristics
th a t determ ine saving behaviours.
One of the theories explaining pension scheme participation — the segmented labour m ar
ket theory — predicts th a t, for certain groups w ithin the workforce, participation in a
pension scheme is not determ ined by choice bu t rath er by constraints experienced by these
groups. Therefore, pension coverage is assumed to be determ ined by variables such as
industry, work history, unionisation, the size of the firm and w hether the work is full- or
p art-tim e (Ghilarducci, 1992).
Pensions act as a mechanism for employee retention, which can be in the interest of both
the employee and the employer. T he employee is more com m itted to a long career with the
employer, especially in the case of defined benefit pension schemes where pension paym ents
are usually linked to final year or end-of-career salary. A ttractin g employees by m eans of
pension entitlem ents as a type of wage com ponent can lengthen tenures and therefore
decrease training costs as well as other costs associated with staff turnover, A nother factor
th a t may affect pension coverage is the size of the employer firm. As economies of scale
also apply to pension provision, larger firms have lower costs of providing pension benefits
per employee (Dum m ann, 2008).
Yabiku (2000) uses d a ta from the US H ealth and R etirem ent Study (HRS) to examine the
determ inants of a person receiving income from a supplem entary pension. He examines
how family history variables affect the probability of private pension receipt and how these
effects vary between men and women. Being m arried has a positive effect on pension
coverage for men, b u t the effect is negative for women. This difference has been theorised
to be the consequence of specialisation of labour w ithin the f a m i l y . Y a b i k u (2000) finds
th a t womens’ labour m arket participation is more likely to be non-continuous with higher
rates of part-tim e and short-tenured employment. He also finds private pension coverage
to be positively correlated w ith early retirem ent (defined as retirem ent before the age of
65). He suggests th a t having inadequate retirem ent resources forces people to extend their
careers, whereas generous pension arrangem ents reduce the labour m arket participation of
older workers.
Existing work examining the determ inants of pension scheme participation include B arri
entos (1998) and Holzmann et al. (2000) in Chile and Argentina, G uarigha and Markose
C hapter 2. D eterm inants of pension coverage and retirem ent income replacement rates
(2000) in the UK, by B assett at al. (1998) in the US, Dominguez-Barrero and Lopez-
Laborda (2007) in Spain and D um m ann (2008) in Germany. These studies focus on pen
sion plan participation of current employees. These analyses generally find th a t individuals
w ith low incomes, low levels of education and those who are self-employed are less likely
to contribute to pension plans, as are women (particularly m arried women). Age, employ
m ent history, firm size, occupational indicators, income and geographical location are also
found to be significant in determ ining the probability of an individual participating in a
pension plan. B assett et al. (1998) also finds th a t private pension scheme participation is
associated with higher employer pension contributions.
The financial well-being of Irish retirees have previously been examined by Blackwell
(1984), Layte et al. (1999), Hughes and Nolan (1999) and Connell and Stewart (2004).
The existing Irish analyses have assessed retirees’ poverty rates, deprivation rates and
the relative size of different income components. In existing studies, the inadequacy of
retirem ent saving is reported especially in the cases of women, young people and those
w ith part-tim e or non-continuous work histories. Hughes and Nolan (1999) carry out an
analysis of pension entitlem ent in Ireland using d a ta from the Living in Ireland Survey of
1994. According to their findings, certain groups of workers in Ireland experience life-long
consequences arising from their type of occupation in term s of not acquiring a supplem en
tary pension while working and not having the tim e or the resources to make alternative
arrangements, leading to these workers depending on the S tate welfare pensions for income
in retirem ent. This C hapter provides an updated analysis using recent d ata collected from
a nationally representative sample of the older Irish population.
The analysis of Irish retirem ent income adequacy has relied mainly on the calculation of
replacement rates of representative workers or households, using average national d a ta
on earnings, work histories and S tate welfare pension rates of payment.^"* This research
makes an im portant contribution to the Irish literature by calculating retirem ent income
replacement rates using individual-level data, therefore allowing for analysis of realised
replacement rates, their distribution and their heterogeneity across different socio-economic
groups.
2.4
D a ta
This C hapter uses d a ta from th e first and second waves of T he Irish Longitudinal Study
on Ageing (TILDA). T he TILDA d ataset provides inform ation on the health, hfestyles
C hapter 2. D eterm inants of pension coverage and retirem ent income replacement rates
and socio-economic characteristics of a nationally representative^® sample of Irish people
aged 50 and over and their spouses. T he TILDA study closely follows the structure of the
H ealth and R etirem ent Study (HRS), the English Longitudinal Study of Ageing (ELSA)
and th e Survey of Health, R etirem ent and Ageing in Europe (SHARE). The first wave
of TILDA d a ta collection took place between 2009 and 2011, containing inform ation on
8,504 individuals living in 6,279 households. Each participant underwent a face-to-face
com puter-assisted personal interview (CAPI) in their home, was given a self-completion
questionnaire and was invited to a health assessment. The overall response rate of the first
wave was 62 per cent. The second wave of th e d a ta was collected between 2012 and 2013,
and had an overall response rate of 86 per cent.
Crucially for this work, TILDA contains detailed information about the individuals’ sources
of income (including asset income), work histories as well as tenure and earnings d ata from
the last employment prior to retirem ent. T he sub-sample of TILDA d ata examined in
this C hapter is restricted to individuals who are more th an 65 years old (the State welfare
pension entitlem ent age), who state th a t they are retired,^® and who have a relatively
substantial working history (more th an 10 years for women, more th an 20 years for men^^).
The focus is on individuals with a relatively substantial working history because they have
had the opportunity to accum ulate supplem entary pensions through work, and this C hapter
focuses on how the Irish pension system has performed for those individuals. Additionally,
the focus on retirees is necessary because the analysis involves the calculation of retirem ent
income replacement rates, the calculation of which is only possible for individuals who
retired from employment (and therefore past earnings d ata is available for them ). The
analysis is carried out at the individual ra th e r th an the household level because the focus
is on the way in which the Irish pension system provides retirem ent income for individuals
with different socio-economic backgi'ounds and labour m arket histories.
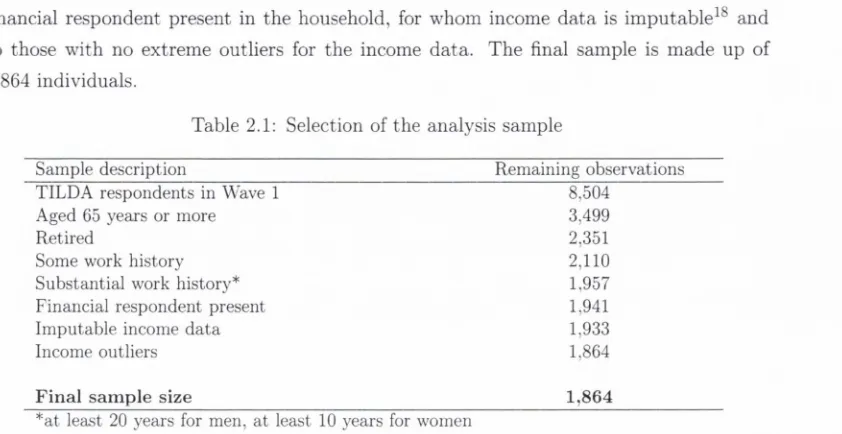
Table 2.1 presents d ata on the sample selection process, with the num ber of observations
deleted in and rem aining after each round of sample selection. The sample size of the
first wave of TILDA d a ta is 8,504. T he individuals included in this analysis are those
who are aged 65 years or more and who are retired w ith a relatively substantial work
history. The analysis sample needs to be restricted to individuals for whom there is a
order to make the TILDA sam ple nationally representative, w eights reflecting each individuaPs proba
b ility o f participation in th e survey were estim ated by com paring the numbers o f individuals in the sam ple
w ith a given com bination of characteristics w ith th e same number in the Irish population. The weights
were estim ated using the Irish Quarterly N ational H ousehold Survey. The characteristics compared were
age, sex and educational attainm ent, w ith education being th e key determ inant (Barrett et al., 2011).
All o f th e analyses in this Chapter are carried out w ith the inclusion of these survey weights.
^®As th e focus is on retirees, individuals w ho classify them selves as looking after th e home, or who are
p erm anently sick or disabled and those w ho have never worked are not included in the analyses.
^’^This restriction virtually only affects the sam ple o f wom en. Very few men who classify them selves as
C hapter 2. D eterm inants of pension coverage and retirem ent income replacem ent rates
financial respondent present in the household, for whom income d a ta is imputable^* and
to those w ith no extrem e outliers for the income data. T he final sample is m ade up of
1,864 individuals.
Table 2.1: Selection of the analysis sample
Sample description
Remaining observations
TILDA respondents in Wave 1
8.504
Aged 65 years or more
3.499
Retired
2,351
Some work history
2,110
Substantial work history*
1,957
Financial respondent present
1.941
Imputable income data
1,933
Income outliers
1.864
F inal sam ple size
1,864
*at least 20 years for men, at least 10 years for women
2.4.1
D escrip tiv e sta tistic s
Tables 2.2 and 2.3 present sum m ary statistics of the main socio-economic and work history
variables, respectively. Of the individuals in the analysis sample, 65 per cent are male and
35 per cent are female. This reflects the higher labour m arket participation ra te s among
(especially older) men in Ireland. The mean age for both men and women in the sample is
74 j'ears. Nearly 60 per cent of the men have only prim ary level education, and one in eight
has obtained a third level qualification. The women have acquired more education than
the men and are also more likely to have worked in the pubhc sector prior to retirem ent.
The men in the sample have had long working careers; the average to tal years worked is
47 years, bearing in m ind th a t the sample is restricted to men w ith a minimum of 20 years
worked. As expected, women have shorter working careers on average, with m ean num ber
of years worked being 35.
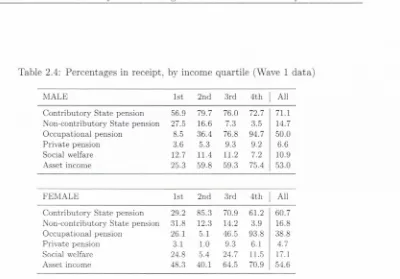
The percentages of Irish retirees receiving income from the two types of S tate welfare
pensions, occupational pensions, private pensions, social welfare and assets^^ are presented
in Table 2.4, with the figures reported by retirem ent income quartiles, separately for men
and women. Men have a higher coverage ra te for the contributory S tate welfare pension,
whereas a slightly higher percentage of women receive the m eans-tested non-contributory
S tate welfare pension. Overall, ju st below 50 per cent of the individuals in the sample
report receiving income from a supplem entary pension, with women being less likely to
*®See Appendix 2.C for details about the im putation m ethods used for replacing m issing values in the
incom e variable.
[image:27.528.78.499.104.321.2]C hapter 2. D eterm inants of pension coverage and retirem ent income replacem ent rates
Table 2.2: Individual socio-economic variables (Wave 1 data)
M a le
%
G e n d e r
F e m a le
%
T o ta l
%
A g e (y e a rs )
65-74
59.3
57.2
58.6
75+
40.7
42.8
41.4
C h ild r e n
0
18.4
24.5
20.5
1-2
23.0
24.7
23.5
3-4
36.3
33.1
35.2
5-t-
22.4
17.7
20.8
M a r r ie d / w id o w
No
15.5
20.1
17.1
Yes
84.5
79.9
82.9
D iv o rc e d
No
96.2
95.5
95.9
Yes
3.8
4.5
4.1
S in g le (n e v e r m a r r ie d )
No
88.3
84.4
87.0
Yes
11.7
15.6
13.0
E d u c a ti o n
P rim ary /n o n e
57.5
44.6
53.1
Secondary
29.3
36.0
31.6
T h ird /h ig h er
13.2
19.4
15.3
P o o r a s c h ild ( s e lf - r e p o r te d )
No
69.8
77.5
72.4
Yes
30.2
22.5
27.6
H o m e o w n e r
No
10.2
13.9
11.4
Yes
89.8
86.1
88.6
S e lf - r e p o r te d h e a lt h
P o o r/F air
30.2
32.2
30.9
Good
35.8
34.6
35.4
Very good/Excellent
34.0
33.2
33.7
L o c a tio n
Dublin
24.2
32.9
27.1
A nother to w n /city
30.8
33.0
31.6
Rural
45.0
34.1
41.3
S a m p le size
1,226
638
1,864
C hapter 2. D eterm inants of pension coverage and retirem ent income replacem ent rates
Table 2.3: Work history variables (Wave 1 data)
M a le
%
G e n d e r
F e m a le
%
T o ta l
%
F ir m size (e m p lo y e e s )
1-5
31.7
26.4
29.9
6-15
13.5
17.3
14.8
16-24
7.8
9.9
8.5
25-199
24.5
25.7
24.9
200-499
9.5
9.1
9.4
500-t-
12.9
11.6
12.5
O c c u p a tio n
Professional
5.2
1.7
4.0
M anagerial
19.4
29.1
22.7
Non-manual
10.4
24.8
15.3
Skilled manual
22.8
12.2
19.2
Semi-skilled
18.5
17.1
18.0
Unskilled
8.1
8.7
8.3
Unknown/unskilled
3.9
3.6
3.8
Farm er
11.8
2.7
8.7
S e c to r o f e m p lo y m e n t
Private
73.9
65.2
70.9
Public
26.1
34.8
29.1
T o ta l y e a r s w o rk e d
11-20
0.0
17.4
5.9
21-30
2.4
19.4
8.2
31-40
16.4
27.9
20.3
41 +
81.2
35.3
65.5
T e n u re (y e a rs )
1-10
16.0
26.2
19.5
11-20
18.0
33.6
23.3
21-30
16.1
20.5
17.6
31-40
21.5
11.2
17.9
41 +
28.4
8.6
21.6
S a m p le size
1,226
638
1,864
Note:
Tenure
refers to the years worl in th e last job prior to retirem ent.
C hapter 2. D eterm inants of pension coverage and retirem ent income replacem ent rates
have supplem entary pensions th an men (41 versus 54 per cent). In comparison, the target
coverage ra te for the to tal workforce over the age of 30 is 70 per cent (Pensions Board,
1998). Slightly below 50 per cent of men and 38 per cent of women receive income from
an occupational pension. The coverage ra te for private pensions is lower for both men
and women (at 6 and 5 per cent, respectively), \^^hen examining differences across the
income distribution, the variation in occupational pension coverage is pronounced: 9 per
cent of men in the lowest income quartile have an occupational pension, whereas the
corresponding figure is 95 per cent among the men in the highest income quartile. The
difference in occupational pension cover is less pronounced for women, which is a reflection
of the higher proportion of women having worked in the public sector w ith widespread
compulsory occupational pensions.
Table 2.5 reports the EUR am ounts of to tal retirem ent income th a t individuals report
receiving from different s o u r c e s . T h e figures are reported by to tal retirem ent income
quartiles, separately for men and women. For both genders, the largest share of total
income on average comes from S tate welfare pensions, in particular the contributory S tate
welfare pension. For men on average, the S tate welfare pensions provide 50 per cent of
total income whereas th e corresponding figure is 58 for women. For men and women in
the lowest income quartile, this percentage rises to 88 and 69, respectively. Therefore, it is
evident th a t for individuals w ith lower incomes. S tate welfare pensions play an im portant
role in retirem ent income provision. For those with higher incomes, supplem entary (mainly
occupational) pensions are more im portant due to the fiat-rate natu re of the S tate welfare
pensions: for men in the top income quartile, supplem entary pensions provide 72 per cent
of to tal income. For women in the top income quartile on average, 68 per cent of income
comes from supplem entary pensions.
Table 2.6 reports the am ounts of retirem ent incom from difi^erent sources for individuals,
calculated per equivalent adult. For these estim ates, to tal household income is equivalised
by using the OECD equivalence scale. For this p art of the analysis, households were
excluded only if neither spouse had at worked for at least 10 years. Two-person households
in which either the husband or wife refused to take p art in the survey were excluded. The
resulting sample size for the equivalised income analysis is 1,987 individuals. Examining
the equivahsed income distribution, to tal retirem ent income is slightly lower for men when
com pared w ith non-equivalised personal income, bu t the equivalisation increases women’s
income estim ates considerably, as expected.
The significance of the length of working history in determ ining retirem ent income is de
picted in Figure 2,1. On average, individuals w ith career lengths between 35 and 45 years
^°The quality of TILDA income d a ta is discussed in O ’Sullivan et al. (2014). They carry out an analysis of
C hapter 2. D eterm inants of pension coverage and retirem ent income replacem ent rates
Table 2.4: Percentages in receipt, by income quartile (Wave 1 data)
MALE
1st
2nd
3rd
4th
All
C ontributory S tate pension
56.9
79.7
76.0
72.7
71.1
N on-contributory S tate pension
27.5
16.6
7.3
3.5
14.7
O ccupational pension
8.5
36.4
76.8
94.7
50.0
P rivate pension
3.6
5.3
9.3
9.2
6.6
Social welfare
12.7
11.4
11.2
7.2
10.9
Asset income
25.3
59.8
59.3
75.4
53.0
FEM ALE
1st
2nd
3rd
4th
All
C ontributory S tate pension
29.2
85.3
70.9
61.2
60.7
N on-contributory S tate pension
31.8
12.3
14.2
3.9
16.8
O ccupational pension
26.1
5.1
46.5
93.8
38.8
P rivate pension
3.1
1.0
9.3
6.1
4.7
Social welfare
24.8
5.4
24.7
11.5
17.1
Asset income
48.3
40.1
64.5
70.9
54.6
Table 2.5: Individual income from different sonrces in EUR, by income quartile (Wave 1
data)
MALE
1st
2nd
3rd
4th
All
C ontributory S tate pension
113.0
184.1
191.5
172.5
164.0
N on-contributory S tate pension
53.5
36.2
17.3
8.3
30.8
O ccupational pension
9.1
20.6
163.1
569.2
160.0
P rivate pension
3.1
4.1
12.9
33.4
11.7
Social welfare
6.5
4.5
9.7
6.3
6.7
Asset income
4.0
8.2
18.0
44.6
16.6
Total income
189.2
257.7
412.4
834.4
389.8
FEM ALE
1st
2nd
3rd
4th
All
C ontributory S tate pension
49,1
193.0
163.5
134.8
132.2
N on-contributory S tate pension
54.0
28.0
31.2
10.1
32.9
Occupational pension
23.7
2.2
57.5
383.4
97.1
P rivate pension
0.8
0.6
2.6
4.3
1.9
Social welfare
15.7
4.2
17.3
10.0
12.0
Asset income
6.3
2.7
11.7
27.5
10.9
[image:31.528.100.500.79.358.2]C hapter 2. D eterm inants of pension coverage and retirem ent income replacem ent rates
Table 2.6; Equivalised income from different sources in EUR, by income quartile (Wave 1
data)
MALE
1st
2nd
3rd
4th
All
Contributory State pension
117.1
180.3
184.3
168.8