Ensuring Quality Services on WiFi Networks for
Offloaded Cellular Traffic
Gianluigi Pibiri
School of Computer Scienceand Statistics Trinity College Dublin
Dublin 2, Ireland. Email: [email protected]
Ciar´an Mc Goldrick
School of Computer Scienceand Statistics Trinity College Dublin
Dublin 2, Ireland. Email: [email protected]
Meriel Huggard
School of Computer Scienceand Statistics Trinity College Dublin
Dublin 2, Ireland. Email: [email protected]
Abstract—One of the more obvious ways to reduce the volume of data traffic on cellular networks is through the use of handover to fixed networks via WiFi and other radio channels. With the growing focus on emerging 5G concepts and technologies, there has been a corresponding focus on the functional mechanisms needed to achieve this handover in a timely fashion. Much less attention has been paid to the practicalities, in terms of ensuring that the end-user experiences little or no loss in the quality of their network services when the handover occurs. In this paper, a methodology for managing such handover traffic in a WiFi network is proposed. The approach integrates and leverages aspects of three quality control mechanisms to enable stable, higher quality delivery of enhanced WiFi network services. It combines i) information adduced from a theoretical model with ii) a low complexity Quality of Experience metric that is quick and easy to estimate and iii) a queue management scheme.
I. INTRODUCTION
Traffic on fourth generation (4G) cellular networks exceeded that on third generation (3G) systems for the first time in 2015 [1]. There has also been a concomitant growth in the volume of traffic that is offloaded from these cellular network onto fixed networks; to the extent that in 2015 over 50% of mobile data traffic was offload from cellular networks onto fixed networks [1]. This was achieved through the use of WiFi and femtocells. Many emerging 5G metaphors envisage “zero distance” con-nectivity between connected machines and connected people [2], along with many thousand-fold increases in both con-nected entities and mobile data; hence it is inevitable that there will be an associated increase in deployment of femtocells, macrocells and other last hop connection metaphors. Clearly this increased dynamicism in device attachment points, and massively more challenging mobility scenarios e.g. vehicular networking, will affect the end-to-end characteristics of the routed traffic.
The nature of the traffic on these networks has also shifted away from traditional voice calls and audio streaming towards mobile video services. The latter accounted for 55% of all mobile data traffic in 2015 [1]. One of the key challenges to be faced is to ensure that the end user does not perceive any loss in the quality of service [3] they are receiving if their real-time cellular data traffic is handed over to a fixed network.
This paper presents an approach to minimizing the impact of these increasingly dynamic network configurations on the
increasingly time and delay sensitive traffic that underpins current and emerging mass-market end-user services.
II. RELATEDWORK
A. Quality of Service and eQoS
The specification of Quality of Service (QoS) [4] has evolved and been extended since it was originally defined in 1994. The measurement of QoS has been divided into three layers [5]: Intrinsic QoS (IQoS), Perceived QoS (PQoS) and Assessed QoS (AQoS); however, the boundaries between these three layers are neither well defined nor clear-cut.
Quality of Experience (QoE) [6] is a practical quantification of AQoS and is measured at the application level; while PQoS, from the network operator’s point of view, is inferred from the network’s performance. The metrics used to evaluate QoE depend only on the human, end user opinion and experience of the network quality.
Two key characteristics are essential for capturing QoE: quick estimation and simple calculation. To achieve these the eQoS metric [7] is used. This metric captures the perceived QoS through an almost instantaneous measurement of loss in network quality and provides an estimate of QoE. In particular, it provides a near instantaneous mechanism for calculating the perceived quality at a node for critical, real time services that are highly sensitive to packet loss and delay. This has been a key challenge for measurement based resource allocation systems for many years. [8]. Traditional QoE metrics require audio or video to be measured over an extended time period by the end user; e.g., traditional algorithms typically require more than 10 seconds of audio or video traffic in order to provide an objective evaluation [9].
B. Modeling Wireless Networks
When the Distributed Coordination Function (DCF) and Carrier Sense Multiple Access with Collision Avoidance (CS-MA/CA) are implemented in a wireless network, the Bianchi [11] model, based on Markov analysis, is a useful tool for esti-mating the back-off time and the probability of channel access. Another Markov model for Enhanced Distributed Channel Access (EDCA) networks is proposed in [12]. A probabilistic model that estimates the probability that a node accesses the channel when the EDCA method is applied to the network is presented in [13], while a binomial-like formula to estimate the probability of a collision in an ad hoc wireless network is given in [14]. This paper builds upon these models, and leverages the authors experiences in developing and deploying real-time, onboard wireless sensing and actuation frameworks [15].
C. AQM and Control Systems
AQM [16] [17] [18] [19] algorithms are not only used for congestion avoidance but also for traffic management and guaranteeing fairness [20] [21]. A low-complexity AQM algorithm based on fuzzy logic and fuzzy control is presented in [22]. It is designed to increase the algorithm’s robustness and improve its speed of reaction to changes in network traffic [23].
The Fast and Autonomic Fuzzy Controller (FAFC) [24] improves network performance through better management of the queue length and by improving the IQoS parameters. The performance of this controller is not only comparable to that of traditional AQM algorithms and AQM algorithms designed using control theory [25] [26]; it also improves on the Random Early Detection [16] algorithm by use of Fuzzy-based Intelligent Packet Dropping (FIPD). The Contention Window Fuzzy Controller (CWFC) [27] uses a fuzzy logic controller to dynamically manage the Contention Window (CW).
III. OFFLOADEDTRAFFICMANAGEMENTSYSTEM
Next generation wireless networks aim to achieve signifi-cantly higher throughput then existing systems and will make extensive use of multi queue systems; thus the wireless queue management algorithms of the future will carry out many functions beyond that of simple congestion avoidance. These new algorithms address not only congestion avoidance but also QoS assurance.
This section introduces a new mathematical model, derived using combinatorics, to describe packet transmission in a fu-ture wireless network where traffic prioritization methods like Enhanced Distributed Channel Access (EDCA) are employed. The model then forms the basis for the design of a new class of offloaded traffic management systems called Quality Queue Management (QQM) schemes.
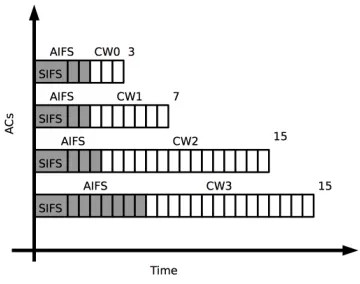
[image:2.612.347.527.49.191.2]QQM schemes measure eQoS and implement congestion avoidance mechanisms whilst simultaneously managing con-tention windows and queueing priorities. QQM operates on a per flow basis across all services and traffic types. It is designed to reduce delay and discard poor quality traffic.
Fig. 1. EDCA: AIFS and Backoff times withCWmin
IV. THEORETICALANALYSIS OF AMULTIQUEUESYSTEM
In this section the analysis presented focuses on a theoretical description of packet behaviour in a future wireless network the makes use of multiple access categories (ACs).
It is assumed that:
• The network uses a 160MHz channel with a Single Input
and Single Output (SISO) configuration similar to that of the IEEE802.11ac [28] standard.
• EDCA (or a similar class based procedure) is used. This
gives high priority to particular traffic and message types.
• Contention Free Bursting (CFB), also known as TXOP, is used.
• CSMA/CA is not implemented on the wireless network. The high speed of future wireless networks makes MA/CA an obstacle for enhancing performance as CS-MA/CA control packet are sent at a very low speed for backward compatibility.
As set out in Table I, each AC has a backoff time of between 0 andCWmin time slots with an associatedAIF S[AC]. For
example, for AC0 the backoff time is between 0 and three
timeslots andAIF S[0]is a SIFS time plus two time slots. For each new transmission attempt, each back-off time slot has an equal probability of being randomly chosen, therefore this probability follows a discrete uniform distribution across the interval[0, CW].
The key probabilities of interest are the probability that a successful transmission occurs, the probability that a collision occurs and the probability that the channel is idle. The probability a transmission occurs is denotedPt, the probability
a collision occurs isPcand the probability there are no packets
queued for transmission isPe.
A. Determining the Probability of Successful Transmission The first challenge is to obtain a mathematical description of how each AC obtains access to the channel. Let each distinct access category in the system be indexed by j. The number of slots in the contention window associated with each ACj is given by CWj. Let the number of ACjs that
Access Category CWmin CWmax TXOP AIF SN Traffic Type
AC0 3 7 1.504ms 2 voice & audio
AC1 7 15 3.008ms 2 video
AC2 15 1023 0 3 best effort
[image:3.612.162.451.47.99.2]AC3 15 1023 0 7 background
TABLE I
SUMMARY OFACPARAMETERS[29]
(NACj −x) ACs are not ready to transmit is given by the following permutation with repetition [14]:
P0(CWj−y),(NACj−x)= (CWj−y)
NACj−x
.
The following notational simplification is used to assist the reader in the subsequent discussion:
P0(CWj−y),(NACj−x)=P
0
NACj(x,y).
This gives the total number of ways (NACj−x)ACs are not ready to transmit in slot y as:
P0NACj(x,y)= (CWj−y)NACj −x
. (1)
The probability that an ACj transmits in time slot iis:
Pt(ACj)i=NACj ×(PACj)
NACj
×P0NACj(1,i+1). (2)
For an infrastructure wireless network that implements EDCA there will be four different types ofAC that compete for access to the channel. From Figure 1, it can be inferred that at time slot 0 only two types ofACs are able to transmit:AC0
and AC1. Using equations 1 and 2 it is possible to calculate
the probability that one AC0 is transmitting in slot 0 as [14]:
Pt(AC0)0=NAC0(PAC0) NAC0P0
NAC0(1,1)
×(PAC1)NAC1P 0
NAC1(0,1).
(3)
and the probability that one AC1 is transmitting in time slot
0 is:
Pt(AC1)0=(PAC0) NAC0P0
NAC0(0,1)
×NAC1(PAC1) NAC
1P0N
AC1(1,1).
(4)
No packets are transmitted when slot 0 is empty for all
AC0s and allAC1s . The probability that slot 0 is empty,Pe0, is the product of the probability that slot 0 is not randomly chosen by any of the AC0s and the probability that slot 0 is
not randomly chosen by any of the AC1s.
Collisions occur when the back-off periods for at least two
ACs expire at the same time. It is assumed that collisions occur between a maximum of two stations at the same time [14]. The probability a collision occurs,Pc, at a given slot time
is the sum of the collision probabilities between two AC0s,
two AC1s or between oneAC0 and one AC1.
The calculation ofPc is more complicated when more than
two types of AC are involved. There are two possible ways that a successful transmission might occur: either a packet is successfully transmitted by AC0 or a packet is successfully
transmitted by AC1. So the probability a collision occurs in
time slot 0 is:
Pc0 =(1−((Pt(AC0)0+Pt(AC1)0) +Pe0))
=1−Pt(AC0)0−Pt(AC1)0−Pe0.
(5)
This argument can be extended to find the probability a collision occurs when more than two ACs are competing for
access in a given time slot. This model can also be extended to
AC2 andAC3 [30]. Using this methodology it is possible to
estimate the probability that a successful transmission occurs, the probability that a collision occurs and the probability that the channel is idle.
B. Contention Window Sizes and Queueing inAC0 andAC1
The first important consideration that merits further discus-sion relates to how theCW size is determined. TheCW value is chosen randomly in the interval [0, CWmin]. It is possible
to estimateCW sizes by considering each station separately. One empirical method that might be suited for CW esti-mation is the German Tank Problem [31]. With just a few samples this method can be used to estimate the average
CW size to an acceptable level of precision. An alternate, theoretical approach would be to use the statistical expectation associated with a discrete uniform distribution. Both these methods are dynamic: using the first method the CW size needs to be estimated periodically, while using the second method the CW size needs to be estimated every time the upper CW limit is exceeded. Despite their differences, both methods provide acceptable results for use in the theoretical calculations discussed above.
A second important consideration relates to the AC0 and
AC1queues. Q0 is the queue associated withAC0 andQ1 is
the queue associated withAC1. BothQ0andQ1are functions
of the characteristics of AC0 andAC1 respectively.
Future wireless networks will have a very high throughput particularly in comparison to the packet transmission fre-quency for VoIP traffic. The exact instant a VoIP conver-sation starts is unpredictable. Protocol G.729 [32] transmits and receives at a frequency of 50 packets per second. The IEEE802.11ac protocol can be considered as a spatial stream with a 160MHz channel. In this case a packet is transmitted about every0.265ms, not including collisions and empty slots due to backoff. At a frequency of 3.8KHz and assuming a worst case scenario where CSMA/CA control packets are used, this corresponds to more than three thousand packets per second. Even if a very large number of VoIP conversations are present in the network, the frequency at which they access the channel is low when compared to the transmission frequency used for the IEEE802.11ac packets. Since AC0 has highest
priority,Q0 is likely to contain at most one or two packets.
AC1has a lower priority thanAC0, but it is still subject to
average of 2 packets is needed for each P frame. The frequency of the video transmission,fV ideo, is 30 frames per second but
the number of packets per frame is variable. AC1’s TXOP
feature is 2.008mslong and is sufficient for the transmission of 45 streaming packets.
From the above it can be concluded thatAC0andAC1only
periodically occupy the channel for packet transmissions. The frequency with which they transmit packets is related to the total number of VoIP and streaming packets passing through the AP. AC2 manages traffic that has a low frequency of
demand for access to channel. This traffic is similar to that of
AC1and the considerations forAC0andAC1remain valid for
AC2.AC3will either make use of any remaining transmission
time to send its data or else will transmit until it exceeds the upper limit imposed on its throughput.
V. ESTIMATING THE NUMBER OFACS SIMULTANEOUSLY CONTENDING FOR CHANNEL ACCESS
A wireless network with N VoIP calls in progress has, in effect, N+ 1classes in competition for access to the channel because the AP must be included in the calculations. It is assumed that the AP accesses the channel with the same frequency as a mobile station. However, the frequency at which an AP seeks to access the channel may well differ from that of the mobile stations because the AP manages all traffic being transmitted to the mobile stations.
It is necessary to determine the relationship between the fre-quency of channel access requests for a service and the number of mobile stations simultaneously accessing the channel. This has been explored for the three traffic types of real time traffic that is expected to be offloaded from cellular networks to small cell and wifi networks. The discussion and experiments presented in [30] confirm that the number ofAC0s andAC1s
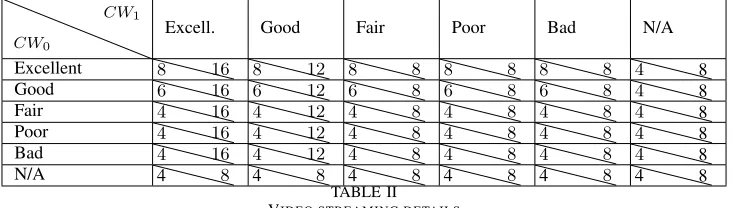
competing for access to the channel at the same time does not exceed two if less than ten phone calls and audio streams or less than six video streams are present in a wireless network. Based on the measured eQoS it can be used to simulta-neously optimize Pe0, Pc0 and the probability to transmit a packet depending on the quality of the service provided. The sizes of CW0 and CW1 are set to the maximum when the
qualitative score is evaluated as Excellent, to the minimum size when the qualitative score is Fair, Poor or Bad and to the median value when the score is Good.
The differences in the CW0 and CW1 sizes reflects the
different priorities assigned by the EDCA method. When a collision occurs theCWs are doubled. The optimalCW0and
CW1values summarised in Table II are used to design a fuzzy
CW controller within the QQM algorithm.
VI. THEQUALITYQUEUEMANAGEMENT ALGORITHM
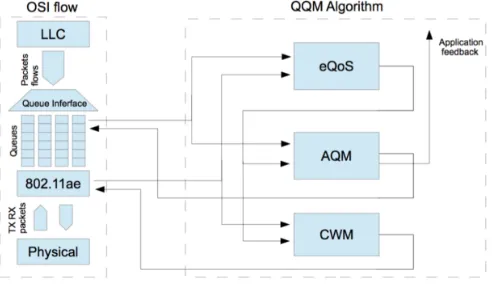
[image:4.612.315.561.52.196.2]The QQM algorithm manages traffic at a wireless AP to provide services over the network with the best possible QoE. It is designed to operate on future wireless and small cell net-works to manage the ACs parameters, and their interactions, according to the measured eQoS. QQM not only manages the traffic crossing the AP but it can also be used to make handover
Fig. 2. QQM algorithm flow chart.
decisions and give feedback to applications to reduce the traffic generated by some services.
QQM algorithms incorporate three key features. The first feature is quality assurance. This is achieved by implementing eQoS flow preservation; flows are dropped if the minimum eQoS cannot be guaranteed. The minimum eQoS is a QoE value; by definition once the eQoS drops below this level the end-user makes the decision to drop the service. The second feature is the management of the transmission, collision and idle channel probabilities through modulation of the contention window (CW). The third feature of QQM is that it seeks to manage the queue length and avoid congestion.
The novelty of QQM is that these three features are com-bined in a single system. The interaction and information exchange between the features contributes to provision of the service with the best quality possible over the network. The implementation of these features is now considered in detail. eQoS flow preservation is achieved through continuous checking of the eQoS for each flow and comparison of the values obtained with historical eQoS data. Flows for which the eQoS falls below an acceptable threshold are dropped. This feature guarantees that only flows that achieve a minimum and acceptable eQoS are transmitted.
Packets are lost in the wireless network when one of three types of dropping event occurs. The first such dropping event is a collision. In this case a packet retransmission is carried out by the QQM algorithm and packets may be dropped if the delay exceeds the maximum acceptable delay for the service. Quality thresholds and levels have been inferred from literature [35]. The second type of dropping event occurs when the queue length exceeds the congestion threshold or if the queue is such that the delay will exceed the maximum delay allowed for the service. The third type of dropping event occurs due to eQoS quality preservation. This occurs when a flow does not achieve the minimum eQoS required to provide a satisfactory service to the end user and so all of the flow’s packets are dropped.
The measured eQoS is used to simultaneously optimizePe0,
CW0
CW1
Excell. Good Fair Poor Bad N/A
Excellent 8 16 8 12 8 8 8 8 8 8 4 8
Good 6 16 6 12 6 8 6 8 6 8 4 8
Fair 4 16 4 12 4 8 4 8 4 8 4 8
Poor 4 16 4 12 4 8 4 8 4 8 4 8
Bad 4 16 4 12 4 8 4 8 4 8 4 8
N/A 4 8 4 8 4 8 4 8 4 8 4 8
TABLE II VIDEO STREAMING DETAILS
are set to the maximum when the qualitative score is evaluated as Excellent, to the minimum size when the qualitative score is Fair, Poor or Bad and to the median value when the score is Good.
The differences in the CW0 and CW1 sizes reflects the
different priorities assigned by the EDCA method. When a collision occurs theCWs are doubled. The optimalCW0and
CW1values summarised in Table II are used to design a fuzzy
CW controller within the QQM algorithm.
QQM also includes a queue management algorithm. The packet dropping decision process differs from that of tradi-tional AQM algorithms: It uses eQoS to guarantee, in so far as possible, the provision of services that meet at least the minimum quality standards.
[image:5.612.124.491.48.152.2]QQM uses fuzzy logic and a fuzzy control system to manage traffic on future wireless networks and small cell networks. Figure 2 shows a flow chart that captures the key operational elements of QQM. The algorithm is composed of three fuzzy controller blocks and it aims to manage the queues and the contention windows under the control of the eQoS block.
These three blocks measure and control the traffic flows to guarantee an acceptable level of QoE for real time services, and a good level of QoS for all other services.
The eQoS block estimates the quality of service per flow. It is also an active block which interacts with the traffic through the AQM and contention window manager blocks, dropping packets that do not conform to the minimum quality level established for provision of the service.
The AQM block is at the heart of the QQM system. It provides queue management and queue length control. It can also provide application layer feedback to the traffic sources. The contention window management block is based on the model described above and performs priority management of the contention windows. Its main goal is to optimize priorities across allACs in order to reduce queue lengths.
VII. EVALUATION
The effectiveness of the theoretical model and the QQM algorithm are explored via simulation. This evaluation of QQM not only validates the mathematical formulae derived and their underlying assumptions, but also serves as a demonstrator of the QQM algorithm and the significant role it could play in (i) making decisions on the handover of traffic from cellular networks and (ii) the management of traffic once it has been handed over to small cell and future wireless networks.
The methods used to evaluate the efficiency of QQM concentrate on true-to-life, real time traffic scenarios in an infrastructure wireless network. QQM is systematically com-pared with the original EDCA [29] method via simulation using ns-2 [36] and, when necessary, Matlab [37].
The VoIP traffic model used in the simulations below is that of a constant presence of simultaneous VoIP calls on the network. The Erlang [38] calculation supposes 300 minutes of VoIP traffic per hour, generated by 5 VoiP calls of 5 minutes duration. Therefore, each AP manages at least 5 flows of VoIP traffic, and these are then increased up to a maximum of 10 simultaneous calls per Access Point.
The audio streaming traffic is represented in the simula-tions by UDP-like packets using Evalvid (http://www.tkn.tu-berlin.de/menue/research/evalvid) [39] [40] [41] [42] [43] in ns-2. It was necessary to extend Evalvid to provide and monitor streaming services in the simulator.
Evalvid was adapted to the last release of ns-2 to include EDCA [44], VoIP [45] and IEEE802.11ac. A few modifica-tions were made: information on UDP packet creation times was added to headers and TCP acknowledgements were moved fromAC0 to the sameAC as the TCP data packets
A. Application of the Theoretical Model
One practical application of the theoretical model presented above is in the calculation of the average time needed to transmit a single packet in a future wireless network. This is done numerically by comparing the average number of packets transmitted in one second during a simulation with the expected time needed to transmit the same number of packets as inferred from the theoretical model.
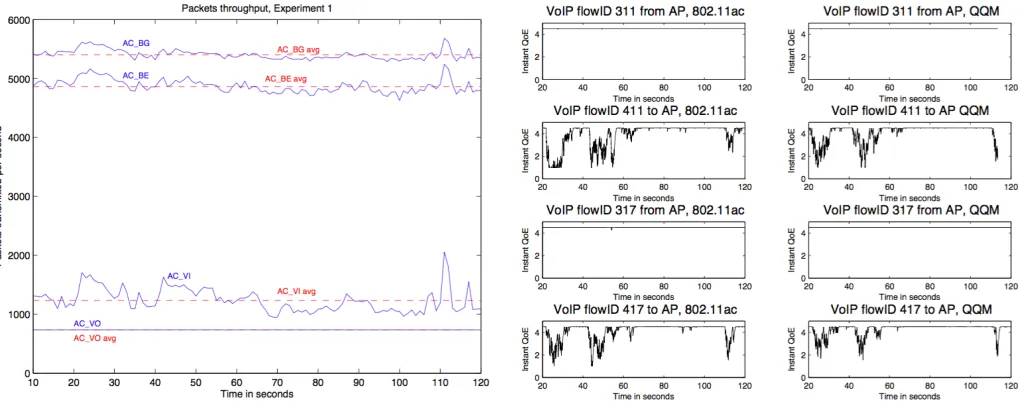
The number of packets transmitted per second and the num-ber of packets per second estimated by the theoretical model are shown to be in close agreement. The ns-2 simulation results and the average values predicted by the theoretical model are shown in figure 3. The x-axis shows the simulation time, while the y- axis shows the packets per second exchanged between the AP and the wireless nodes. The blue lines are the simulation results and the red dashed lines are the averages.
The lines marked with AC VO represent the traffic managed by AC0. The lines representing AC0 traffic overlap because
Fig. 3. Comparison of Simulation Results with those obtained using the Theoretical Model for 5 VoIP, 5 Audio and 5 Video streams, 5 TCP flows and a mix of 3 TCP and 2 UDP flows
All the video traffic flows start at the same instant in time. This represents a worst case scenario for video traffic because all the transmission peaks overlap and so they are amplified. The lines marked with AC BE represent the sum of the traffic managed by AC2 and the AC0 and AC1 traffic. The lines
marked with AC BG represent the sum of the traffic managed by AC3and the AC0,AC1 andAC2 traffic.
The calculations performed using the theoretical model are shown on the graph. All flows managed byAC0 andAC1are
transmitted first. After this traffic has been transmitted, the traffic managed byAC2is transmitted. This is TCP/FTP
traf-fic. The remaining time is then reserved for the transmission of the traffic managed by AC3. In general, AC2s and AC3s
transmit UDP/CBR traffic before any TCP/FTP packets are sent in their respective transmission time slots. In both cases the TCP/FTP traffic consists of data packets in one direction and acknowledgement packets in the opposite direction.
It is assumed that the RTT for TCP/FTP flows exceeds the typical delay accumulated on the wired network; that is, it exceeds 40 milliseconds [46]. This means there are less than 25 RTTs per second. In each RTT a flow can transmit a maximum of 32 packets if the congestion window is large [46]. In the case of Experiment 1, less than 4000 packets are transmitted by the AC2s. This includes both data and
acknowledgement packets. In theory, one of the 5 AC2s in
the simulation can transmit 400 packets. This corresponds to an average congestion window size of 16 packets. It can be assumed that, in theory, each AC2 is accessing the channel
less than 16 times every 40 milliseconds. About 13 packets can be transmitted every 2.5 milliseconds.
A large number of flows are from the wired to the wireless network; so the AP is in saturation and always has a packet ready to transmit. This means that a maximum of 2 AC2s are
competing to access the channel at any instant in time. AC3
Fig. 4. Comparison of the QoE of VoIP Flows at Wireless Nodes 11 and 17 for two systems: (i) IEEE802.11ac with EDCA and (ii) the same system with the addition of QQM.
traffic sources all originate on the wired network and converge at the AP; therefore, the only traffic flowing from the wireless to the wired network is TCP/FTP acknowledgement packets. It is assumed that a maximum of 2 AC3s are competing to
access the channel at the same time.
In the experiment, an average of about 5400 packets are transmitted each second. This is shown in figure 3. The average transmission time for each packet estimated by the theoretical model differs from the average time observed in the simulation by 0.36%. This corresponds to the time needed to transmit 15 more packets using the theoretical model.
B. QQM in Operation
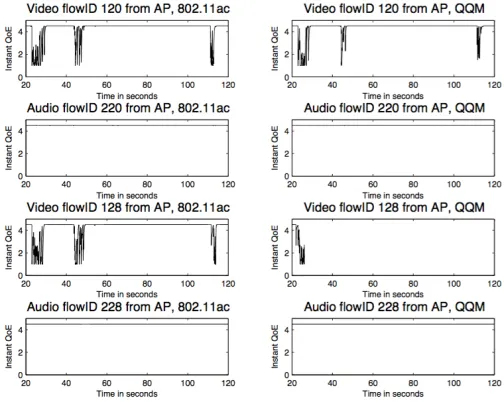
QQM’s efficiency is demonstrated through simulations that compare the performance of future wireless networks where EDCA is implemented with that of the same networks where QQM is implemented. To assist the reader the eQoS estimates are translated onto a scale that is comparable with that used for the MOS [47] score. This is indicated on the graphs as QoE. QQM is set to drop flows that have a QoE that drops below “fair”, as measured by MOS score, for one second.
Fig. 5. Comparison of QoE of audio and video unidirectional flows at Wireless Nodes 20 and 28 for two systems: (i) IEEE802.11ac with EDCA and (ii) the same system with the addition of QQM.
Figure 5 shows the comparison between the QoE of the original system, i.e. for IEEE802.11ac with EDCA only, and the same system with the addition of QQM. In the figure the flow with ID 128 is dropped by the QQM algorithm after 26 seconds. Audio quality is not affected in the unidirectional flows from the wired to the wireless network.
VIII. CONCLUSION
The simulation results show that the theoretical model presented can be used to predict traffic and to estimate the probabilities associated with transmission, collision and idle events for the handover traffic on wireless and small cell networks. They also provided compelling evidence of the effectiveness of QQM in the management of this traffic. The QQM algorithm can be used in handover decision making to ensure that real-time traffic for on-demand services is only passed to small cell and wireless networks when they can provide quality guarantees that meet service requirements.
REFERENCES
[1] C. V. Forecast, “Cisco Visual Networking Index: Global Mobile Data Traffic Forecast Update, 20152020 White Paper,”Cisco Public Informa-tion, February, 2016.
[2] C. Mc Goldrick, V. Rabsatt, and M. Gerla, “Independent Active Ageing - the Role of 5G and Autonomous Vehicles,”IEEE COMSOC MMTC, vol. July, 2015.
[3] R. Shreevastav, C. McGoldrick, and M. Huggard, “Delivering improved qos and cell throughput in umts based hsdpa networks,” in2009 IEEE International Symposium on a World of Wireless, Mobile and Multimedia Networks Workshops, June 2009, pp. 1–9.
[4] “ITU-T recommendation E.800: Definitions of terms related to quality of service,” Sep. 2008.
[5] R. Stankiewicz, P. Cholda, and A. Jajszczyk, “QoX: What is it really?” IEEE Communications Magazine, vol. 49, no. 4, pp. 148–158, April 2011.
[6] “ITU-T recommendation P.10/G.100: Vocabulary for performance and quality of service,” Jul. 2006.
[7] G. Pibiri, C. M. Goldrick, and M. Huggard, “Enhancing AQM perfor-mance on wireless networks,” inWireless Days (WD), 2012 IFIP, Nov 2012, pp. 1–3.
[8] P. Barham, S. Crosby, T. Granger, N. Stratford, M. Huggard, and F. Toomey, “Measurement-based resource allocation for multimedia applications,” inPhotonics West’98 Electronic Imaging. International Society for Optics and Photonics, 1997, pp. 69–82.
[9] “ITU-T recommendation BS.1387: Method for objective measurements of perceived audio quality,” 11 2001.
[10] V. Misra, W. Gong, and D. Towsley, “Fluid-based analysis of a network of AQM routers supporting TCP flows with an application to RED,” ACM SIGCOMM Computer Communication Review, vol. 30, no. 4, p. 160, 2000.
[11] G. Bianchi, “Performance analysis of the IEEE 802.11 distributed coor-dination function,”IEEE Journal on Selected Areas in Communications, vol. 18, no. 3, pp. 535–547, March 2000.
[12] I. Inan, F. Keceli, and E. Ayanoglu, “Performance Analysis of the IEEE 802.11e Enhanced Distributed Coordination Function Using Cycle Time Approach,” inIEEE GLOBECOM 2007 - IEEE Global Telecommunica-tions Conference, Nov 2007, pp. 2552–2557.
[13] P. Rajmic, J. Hoˇsek, M. Fusek, S. Andreev, and J. Stec´ık, “Simplified Probabilistic Modelling and Analysis of Enhanced Distributed Coordina-tion Access in IEEE 802.11,”The Computer Journal, p. bxu081, 2014. [14] F. Bouabdallah and N. Bouabdallah, “The tradeoff between maximizing the sensor network lifetime and the fastest way to report reliably an event using reporting nodes’ selection,”Computer Communications, vol. 31, no. 9, pp. 1763–1776, 2008.
[15] E. Simon Carbajo, R. Simon Carbajo, C. Mc Goldrick, and B. Basu, “Asdah: An automated structural change detection algorithm based on hilbert-huang transform,” Mechanical Systems and Signal Processing, vol. 47, no. 1-2, pp. 78–93, 2014.
[16] S. Floyd and V. Jacobson, “Random early detection gateways for congestion avoidance,”Networking, IEEE/ACM Transactions on, vol. 1, no. 4, pp. 397–413, 1993.
[17] A. Bitorika, M. Robin, and M. Huggard, “A framework for evaluating active queue management schemes,”Department of Computer Science, Trinity College, Dublin, Ireland, Tech. Rep, 2003.
[18] S. Athuraliya, S. H. Low, V. H. Li, and Q. Yin, “REM: active queue management,”IEEE Network, vol. 15, no. 3, pp. 48–53, May 2001. [19] G. Pibiri, C. Mc Goldrick, and M. Huggard, “Using Active
Queue Management to Enhance Performance in IEEE802.11,” in Proc. 4th ACM Workshop on Performance Monitoring and Measurement of Heterogeneous Wireless and Wired Networks (PM2HW2N), 2009, pp. 70–77. [Online]. Available: http://doi.acm.org/10.1145/1641913.1641923
[20] M. Huggard, M. Robin, A. Bitorika, and C. McGoldrick, “Performance evaluation of fairness-oriented active queue management schemes,” in Proc. the IEEE Computer Society’s 12th Annual International Sympo-sium on Modeling, Analysis, and Simulation of Computer and Telecom-munications Systems (MASCOTS), 2004, pp. 105–112.
[21] A. Bitorika, M. Robin, M. Huggard, and C. Mc Goldrick, “A comparative study of active queue management schemes,” in http://citeseerx.ist.psu.edu/viewdoc/summary?doi=10.1.1.2.6899, 2004. [22] S. Leghmizi and S. Liu, “A survey of fuzzy control for stabilized
platforms,”arXiv preprint arXiv:1109.0428, 2011.
[23] M. I. H. Nour, J. Ooi, and K. Y. Chan, “Fuzzy logic control vs. conventional PID control of an inverted pendulum robot,” inIntelligent and Advanced Systems, 2007. ICIAS 2007. International Conference on, Nov 2007, pp. 209–214.
[24] Y. Hadjadj Aoul, A. Mehaoua, and C. Skianis, “A fuzzy logic-based AQM for real-time traffic over internet,”Computer Networks, vol. 51, no. 16, pp. 4617–4633, 2007.
[25] F. Yanfei, R. Fengyuan, and L. Chuang, “Design of an active queue management algorithm based fuzzy logic decision,” inCommunication Technology Proceedings, 2003. ICCT 2003. International Conference on, vol. 1, April 2003, pp. 286–289 vol.1.
[26] A. Bitorika, M. Robin, and M. Huggard, “An evaluation framework for active queue management schemes,” inProc. the IEEE Computer Society’s 11th International Symposium on Modeling, Analysis and Sim-ulation of Computer Telecommunications Systems (MASCOTS), 2003, pp. 200–206.
IEEE International Conference on Emerging Technologies and Factory Automation, Sept 2008, pp. 1193–1196.
[28] “IEEE Standard for Information technology– Telecommunications and information exchange between systemsLocal and metropolitan area networks– Specific requirements–Part 11: Wireless LAN Medium Access Control (MAC) and Physical Layer (PHY) Specifications– Amendment 4: Enhancements for Very High Throughput for Operation in Bands below 6 GHz.”IEEE Std 802.11ac-2013 (Amendment to IEEE Std 802.11-2012, as amended by IEEE Std 802.11ae-2012, IEEE Std 802.11aa-2012, and IEEE Std 802.11ad-2012), pp. 1–425, Dec 2013. [29] “IEEE Standard for Information technology–Local and metropolitan area
networks–Specific requirements–Part 11: Wireless LAN Medium Access Control (MAC) and Physical Layer (PHY) Specifications - Amendment 8: Medium Access Control (MAC) Quality of Service Enhancements,” IEEE Std 802.11e-2005 (Amendment to IEEE Std 802.11, 1999 Edition (Reaff 2003), pp. 1–212, Nov 2005.
[30] G. Pibiri, “Quality Queue Management for Future Wireless Networks,” Ph.D. dissertation, Trinity College Dublin, 2017.
[31] R. Ruggles and H. Brodie, “An empirical approach to economic intelli-gence in World War II,”Journal of the American Statistical Association, vol. 42, no. 237, pp. 72–91, 1947.
[32] “ITU-T recommendation G.729 : Coding of speech at 8 kbit/s us-ing conjugate-structure algebraic-code-excited linear prediction (CS-ACELP),” Jan 2007.
[33] S. kak Kwon, A. Tamhankar, and K. Rao, “Overview of H.264/MPEG-4 part 10,”Journal of Visual Communication and Image Representation, vol. 17, no. 2, pp. 186 – 216, 2006. [Online]. Available: http://www.sciencedirect.com/science/article/pii/S1047320305000696 [34] H. Schwarz, D. Marpe, and T. Wiegand, “Overview of the Scalable
H.264/MPEG4-AVC Extension,” in2006 International Conference on Image Processing, Oct 2006, pp. 161–164.
[35] T. Szigeti and C. Hattingh, “Quality of service design overview,”Cisco, San Jose, CA, Dec, 2004.
[36] S. McCanne, S. Floyd, K. Fall, K. Varadhanet al., “Network simulator ns-2,” 1997.
[37] MATLAB,version 7.10.0.499 (R2010a). Natick, Massachusetts: The MathWorks Inc., 2010.
[38] M. Schwartz,Mobile wireless communications. Cambridge University Press, 2005.
[39] J. Klaue, B. Rathke, and A. Wolisz, “Evalvid-A framework for video transmission and quality evaluation,”Computer Performance Evaluation. Modelling Techniques and Tools, pp. 255–272, 2003.
[40] ——, “EvalVid-A Video Quality Evaluation Tool-set,” Telecommunica-tion Networks, 2011.
[41] C. Ke, C. Shieh, W. Hwang, and A. Ziviani, “An evaluation framework for more realistic simulations of mpeg video transmission,”Journal of information science and engineering, vol. 24, no. 2, pp. 425–440, 2008. [42] J. Gross, J. Klaue, H. Karl, and A. Wolisz, “Cross-layer optimization of OFDM transmission systems for MPEG-4 video streaming,”Computer Communications, vol. 27, no. 11, pp. 1044–1055, 2004.
[43] A. Lie and J. Klaue, “Evalvid-RA: trace driven simulation of rate adaptive MPEG-4 VBR video,”Multimedia Systems, vol. 14, no. 1, pp. 33–50, 2008.
[44] S. Wieth¨olter and C. Hoene, “Design and verification of an IEEE 802.11e EDCF simulation model in ns-2.26,” inTechnische Universit¨at Berlin, Tech. Rep. TKN-03-019, November 2003.
[45] C. Hoene, “Simulating playout schedulers for VoIP-software package,” 2004.
[46] J. Padhye, V. Firoiu, D. Towsley, and J. Kurose, “Modeling TCP throughput: A simple model and its empirical validations,” in ACM SIGCOMM Computer Communication Review, vol. 28, no. 4. ACM, 1998, pp. 303–314.