Evaluation
o
f
Framework
Programme 6
In Ireland
Evaluation of Framework Programme 6 in Ireland
Acknowledgments
This report is substantially based on research carried out by Technopolis Group on behalf of Forfás. Forfás would like to fully acknowledge the quality of their work.
Many people and organisations contributed to the production of this report. Particular thanks are due to all the questionnaire respondents and to the FP6 participants and members of the Irish science and technology policy community who agreed to be interviewed. Thanks are also due to many of the staff of public sector bodies such as Forfás; the Office of Science and Technology; the Department of Enterprise, Trade and Employment; Enterprise Ireland; and the European
Table of Contents
Table of Contents
ii
Executive Summary
iv
1. Introduction
1
2. Methodology
2
2.1 Study terms of reference 2
2.2 Methodological approach 2
3. Results
6
3.1 Introduction 6
3.2 The relevance of FP6 to Irish researchers 6
3.3 Ireland’s participation in FP6 proposals 6
3.4 Ireland’s success rates in applying to FP6 7
3.5 Ireland’s participation in FP6 9
3.6 Funding received by Irish organisations 10
3.7 Patterns of participation 12
3.8 The drivers and motives for FP6 participation 17
3.9 Collaboration patterns within Ireland’s FP6 projects 18
3.10 Outputs delivered through FP6 projects 19
3.11 Benefits realised through FP6 projects 20
3.12 Wider impacts of FP6 projects 22
3.13 Costs and benefits of participation in FP6 projects 23
3.14 Satisfaction with FP6 administrative processes 24
3.15 Use of FP6 support 25
3.16 Preliminary findings with regard to FP7 26
3.17 The new National Support Network for FP7 27
4. Conclusions and recommendations
34
4.1 Conclusions 34
4.2 Recommendations 35
Appendix 1
38
Steering Committee 38
Appendix 2
39
Terminology 39
Appendix 3
40
Glossary 40
Executive Summary
This report sets out the results of an evaluation of Ireland’s involvement in Framework Programme 6 (FP6), carried out by Technopolis Group. The study was contracted and managed by Forfás and was overseen by a steering group representing the Office of Science and Technology (OST), Enterprise Ireland (EI), Industrial Development Agency - IDA Ireland (IDA), Higher Education Authority (HEA), Irish Universities’ Association (IUA), Irish Research Council for the Humanities and Social Sciences (IRCHSS), Science Foundation Ireland (SFI) and Forfás.
The results of the study have shown that Ireland’s participation in FP6 was strong overall, and that its public and private research communities have played an active role in the Programme, deriving significant benefit as a result. FP6 was considered to be of high relevance to Irish researchers. The programme’s Priority Areas and Instruments were rated as an improvement on those employed in FP5, and proved a good fit with most researchers’ requirements. However, demand for
participation as measured by Irish participation in proposals was lower than might have been hoped, particularly within the Life sciences Priority Area.
Success rates within the competition were well above FP6 averages overall, and were particularly high in the Food quality and safety, Sustainable development, Research infrastructures and Euratom areas. Irish research institutes and public sector bodies enjoyed the highest success rates, while industry’s were much lower than for the other main groups of actors. Unsuccessful applicants have gained a good understanding of why their proposals were not supported, and many have taken steps to take their ideas forward through other support mechanisms or subsequent FP calls.
Irish participants were awarded a total of €199 million in FP6 funding, an increase in real terms but the same share of the total that was achieved in FP5. The share of FP6 funding awarded to Irish participants was in line with Ireland’s share of GDP and its contribution to the EU budget, was significantly above its share of GNP and was very high in relation to the size of its population. Funding allocations to Irish participants were above the average amounts awarded during FP6 as a whole, driven mainly by higher than average levels of funding being achieved by Ireland’s Higher Education Institutes (HEIs).
Participant numbers and participation levels were slightly lower in FP6 than in FP5. A combination of high success rates but falling levels of participation suggests that there is scope for further increasing demand among Irish research communities for participation in the Framework
Programmes. Significant increases in national funding issued by the HEA, SFI and other agencies during the course of FP6 appear to have strengthened some actors’ desire and ability to participate. However, it is clear that in other cases national funding has (understandably) diverted attention away from FP participation in the short term, with some research teams giving greater priority to the setting up of national research infrastructure and projects than to FP6 participation. It is
expected, however, that the increased capacity and capabilities developed through national funding can and will strengthen participation in future Framework Programmes among all groups of actors.
Irish organisations took part in all priority areas of FP6, and made use of all of the main instruments. In absolute terms participation levels and funding were highest in the Information society
technologies (IST) and Human resources & mobility (HRM) areas. However, in comparison with other countries Ireland performed most strongly in the Food quality & safety, HRM, and Horizontal
research involving Small & Medium-sized Enterprises (SMEs) areas.
administrative processes and procedures, and the balance of opinion was that these were better in FP6 than in FP5. Irish participants made good use of the support available during FP6 and rated the assistance received very highly.
A comparison of the motives for participation in Framework and the results achieved has shown that the Framework Programmes are effective at delivering the kinds of outputs and benefits that participants have sought. The formation of new networks and the exchange of knowledge and expertise were the primary motives for participation, along with a desire to access research funding. The primary benefits came in the form of improved relationships and networks, increased knowledge and capabilities (both scientific and technological), and enhanced reputation and image. FP
participation has helped to strengthen and support participants’ own research strategies, enabling them to extend their capabilities and pursue new lines of research. As a result, the benefits of FP6 participation have outweighed the costs for the vast majority of Irish participants.
The evaluation of FP6 has investigated early views on FP7, and the results are also positive, with most Irish actors considering FP7 priorities and instruments to be as relevant or of higher relevance than those of FP6. Ireland’s new National Support Network (NSN) introduced for FP7 has attracted significant praise, and the research communities appear to be making good use of the support on offer. Ratings of the main service providers and the assistance received are extremely positive, and there are some early indications to suggest that Ireland’s participation rates may be higher under FP7 than FP6.
Ireland’s success rates are already high, and so the major challenge in the short term is to increase the extent of demand for FP participation. While the significant increases in national funding issued by the HEA, SFI and other agencies during the course of FP6 have undoubtedly helped to strengthen national Research & Technological Development (RTD) capabilities and capacity, it was perhaps unreasonable to expect to see an ‘immediate’ increase in Framework participation at the same time as the national funding was being absorbed. However, it is essential that in the longer-term, national investments in infrastructure and capabilities are used as a platform for strengthened participation in international RTD initiatives.
We therefore recommend that the national funding agencies reaffirm the importance of FP participation and ensure that all of the major recipients of national funding are aware of and take seriously their responsibilities to leverage national money against other funding sources1. As a
priority the non-involvement of key research groups and companies in FP proposals should be targeted. In parallel, the national funding agencies should ensure that appropriate incentive systems are in place, which encourage and give sufficient credit for FP participation. This would appear to be most needed in the Life sciences area where Irish participations in proposals was much lower than we might have expected.
We also recommend that the national funding agencies and their key constituents begin to develop strategies with regard to FP participation, assessing national research strengths and priorities and linking these to FP priorities and opportunities. It seems that some of the key players within the research base and the NSN already have a good understanding of where Ireland has been making the
1 Some national funding programmes such as the Programme for Research in Third-Level Institutions (PRTL)I
underpinned by a more formal analysis, and then converted into a series of documented strategies as to how and where FP participation can be enhanced in the future. These strategies should form the basis for improved ‘positioning’ of the Irish research and industrial communities with respect to Framework participation, the establishment of EU partnerships and the influencing of future policy directions.
The Commission itself is moving to take more of a policymaking role, increasingly setting wider RTD priorities and agendas in cooperation with the member states. As such there is increasing ‘policy space’ for countries like Ireland to interact with and influence overall EU-level RTD strategies. New programming instruments provide opportunities for Ireland to take a stronger role in policy
coordination and to influence more of the European agenda. The findings in this report suggest that Ireland is already beginning to play such a role, but a more concerted effort may be needed to ensure that the strategies of other actors do not crowd out Ireland’s national interests. Active participation in the Joint Technology Initiatives (JTIs)and Joint Programming Initiatives (JPIs) and the negotiation of RTD agendas with other Member States is therefore essential if Ireland is to build on the recent investments it has made in its RTD base.
In addition, we make the following more specific recommendations for strengthening Ireland’s participation in the Framework Programmes, most of which should be taken up by the national funding agencies through the NSN:
Increase efforts to influence and provide early warnings of FP calls, with a stronger role in ‘behind the scenes’ negotiations in relation to FP priorities, and with National Delegates occupying a more central role within the NSN
Provide increased support for identifying partners and building consortia, with increased help in building links with established EU players and increased incentives for intra-Ireland
collaboration, particularly where Irish participants are in a coordinating role
Provide increased levels of support from ‘experienced campaigners’ in reviewing draft proposals and advising on critical success factors
Encourage increased levels of participation by Irish researchers within the FP evaluation process, in order to enable an improved understanding of how it operates and how to maximise chances of success
Increase the use of dedicated (professional) management support, to assist in the
development of proposals, drawing up of contracts, and management of large-scale projects
Improve the balance of support provision, with a better regional distribution and a greater focus on support to industry
Provide more flexible forms of financial assistance, including the option to claim travel grants retrospectively and selective provision of matched funding in strategically important areas to support FP participation
Strengthen the promotion of the support available, particularly to less established and new participants in order to ensure that the assistance is given to those who most need it
Evaluate on an ongoing basis the effectiveness of the support provision, in order to
understand whether the increased investment is producing the desired results, overall and at the level of the different elements, particularly the financial supports
1. Introduction
This is the short version from an Evaluation of Framework Programme 6 (FP6) in Ireland report, which was carried out by Technopolis Group on behalf of Forfás.
The overall aims of the study were to assess Ireland’s performance in relation to FP6, identifying the extent to which Irish organisations were involved and the benefits they have derived. The study was also asked to canvass early views on FP7 and on the new National Support Network (NSN).
Particular emphasis was placed on the relevance of FP6 to Irish organisations, the extent to which new actors engaged in the programme, the leverage from Irish research organisations in assisting other Irish actors to become involved, the added value of FP6 in contributing to national research, development and innovation (RD&I) output, and the suitability of support mechanisms in place at national and EU levels.
The report provides a summary of the main findings from the evaluation and is organised into three further sections as follows:
Section 2 describes the methodology employed in carrying out the evaluation. It sets
out briefly the main requirements for the study as set out in the terms of reference issued by Forfás. We then go on to describe the principle methods used to carry out the evaluation
Section 3 presents the main findings from the study. We report on the relevance of
FP6 to Irish researchers, the strength of demand for FP6 participation, and Ireland’s success rates in securing FP6 funding support. Ireland’s participation levels in different areas of the programme are analysed and discussed, as are its patterns of collaboration with other countries. We then go on to report on the drivers and motives for FP participation, the outputs and benefits delivered, and the wider impacts of FP6
projects. Participants’ ratings of the costs and benefits of participation are presented, and Irish researchers’ satisfaction with FP6 administrative processes and FP6 support structures are discussed. We then present early feedback on FP7, focusing on the relevance of the programme and the operations of the new National Support Network (NSN). Finally, we discuss Irish FP participation in the EU policy context, discussing the implications of evolving EU and national policy changes over recent years
Section 4 presents our main conclusions and recommendations
2. Methodology
2.1 Study terms of reference
The terms of reference for the study set out the objectives of the evaluation, which were as follows:
To assess the added value of FP6 in contributing to national research, development and innovation (RD&I) output
To assess the relevance of FP6 to Irish organisations, and the extent to which new actors engaged in the programme
To assess the leverage (or lack thereof) from Irish organisations in encouraging and assisting participation in FP6
To assess the suitability for participants of support mechanisms in place at national and EU levels
It was also required that the evaluation address a range of other issues, including patterns of participation, the relative performance of Ireland and the benefits derived, plus views on the relevance of instruments, awareness of support and feedback on administrative procedures. The study was also required to provide recommendations on enhancing Ireland’s participation in future FPs and the benefits obtained.
2.2 Methodological approach
2.2.1 Analysis of Irish participation in FP6 projects
The data used for the analysis of Ireland’s participation in FP6 was extracted by Forfás from the European Commission’s e-corda database and supplied to the study team. This data was compared with published data on FP6 participation to confirm that the analyses presented are consistent, and some data cleaning (standardising names, filling information gaps, etc.) was required in order to improve the accuracy of results. A range of analyses was then
undertaken to describe the nature and extent of Irish participation in FP6, focusing on the questions set out in the terms of reference.
2.2.2 Analysis of Irish participation in FP6 proposals and success rates
2.2.3 Questionnaire survey of FP6 participants
Technopolis developed a questionnaire to be sent to Irish participants in FP6 projects. The questionnaire was designed to address the various requirements of the study terms of reference, and focused on areas that could not be answered through the analysis of participation data or that would not be better addressed through the programme of
interviews (see below). It included questions on the relevance of FP6, the impact of national funding on participation levels, participants’ motives for becoming involved, delivery of outputs, benefits and impacts realised, and use and views on FP6 and FP7 support.
The FP6 database provided data on 524 individual participants, of which 423 had participated in one project and 101 had participated in multiple projects2. In addition, Forfás was able to
identify contact names and email addresses for a further 29 participants. The initial sample of participants targeted by the survey was therefore 553.
The questionnaire was implemented on-line using a professional survey facility and a request email was sent to participants in early February 2009. We estimate that this failed to reach 29 people (due to undeliverable messages and ‘opt-outs’), leaving us with a pool of 524 possible respondents. A total of 153 respondents provided a useable return, giving an overall response rate of 29%. Responses provided a reliable sample from which to draw conclusions, notwithstanding a slightly lower level of feedback from industry and a slight
over-representation of projects with Irish coordinators. Data was analysed in order to determine the pattern of responses for each question and, where appropriate, separate analyses were carried out by organisation type or by other sub-groups.
2.2.4 Questionnaire survey of unsuccessful FP6 applicants
Technopolis also developed a questionnaire to be sent to unsuccessful FP6 applicants. The questionnaire was designed to collect information on Irish participants’ roles in the unsuccessful proposals, the reasons why the proposals were not successful, the fate of the unsuccessful ideas, and the impact of failure in the competition on subsequent application rates. The questionnaire also explored unsuccessful applicants’ use and views on FP6 and FP7 support mechanisms.
The European Commission data on unsuccessful proposals with Irish involvement contained 3,846 records (after duplicates and non-Irish applicants were removed), within which we identified 1,224 unique individuals with properly formed email addresses that we believed, based on a cross-check with the main FP6 participation database, had not participated in FP6. The survey of unsuccessful applicants was launched in May 2009, with email requests sent to all of the identified individuals. Taking into account undeliverable messages, the final pool of unsuccessful applicants targeted was ~1150.
In total, 110 useable responses were received, representing a response rate of ~10%. Due to data limitations, the overall profile of unsuccessful applicants and the extent to which respondents are representative of all applicants cannot be reliably determined. However, the spread of responses by organisation type is a close enough match to the overall FP6 participation profile to be considered a sufficiently balanced sample from which to draw conclusions. The pattern of responses were analysed for each question, with comparisons in some cases being made between those who were unsuccessful with all of their proposals and those who had been unsuccessful with only some.
2 It was agreed that those involved in more than one project would be asked only to complete one copy
2.2.5 Interviews with key actors
It was agreed that the evaluators would interview 30 key individuals from within the Irish research and innovation system. Forfás developed a preliminary list of 26 interview targets, including senior researchers, representatives of public funding agencies and FP6/7 support providers. In addition, key FP6 participants, Higher Education Institute (HEI) research office representatives and other individuals were identified from participation and applicant databases and steering group suggestions. The final list included ~20 support providers /representatives of national research funding agencies and ~30 key researchers /FP participants.
The interviews were intended to be semi-structured and an interview guide was developed based around the key questions to be addressed by the study, and focused on issues that could not easily be addressed through the participation analysis and surveys.
In the final event we interviewed 30 individuals, of which 13 were support providers /
representatives of national research funding / policy agencies and 17 were senior researchers / FP6 participants from HEIs, research institutes and industry. Notes were taken during interviews and then transferred to a central database for analysis. Due to the semi-structured nature of the interviews, it was not the intention to analyse the results in any quantitative way. Instead the views and suggestions put forward on each broad issue were compiled into an overall response and presented at various points in our report to support other data and evidence.
2.2.6 Interviews with major beneficiaries of national research funding
Although not part of the formal terms of reference for the study, it was agreed that the study team would seek to establish the extent to which the major recipients of national research funding in the period 2000-6 had participated in FP6, in order to help understand the relationship between this funding and FP participation. It was also agreed that we would attempt to speak with some researchers that had been identified as major recipients of national research funding, but who did not appear in the FP6 participant database, in order to establish whether they had participated in FP6, to determine the reasons why not (if not) and to determine whether national funding had acted as a barrier. Each major national funding agency provided information on the main recipients of research funding in the period and we identified those researchers (~10 per funding body) that had received the major awards or greatest overall shares.
Most of the beneficiaries were confirmed as having participated in FP6, but those who could not be matched with the FP6 database were approached in order to clarify the situation. We were only able to reach a small number of these individuals, but all confirmed that they either: (i) had participated, but were not (for whatever reason) named within the database, (ii) had applied but were unsuccessful, (iii) are employed at a senior (director) level and no longer named as PIs on proposals, or (iv) were out of the country during the application stages of FP6. All of the people we spoke with confirmed that they or (for directors) their
institution have applied to FP7.
2.2.7 Analysis and reporting
Analysis of results was carried out throughout the study. An interim report setting out
3. Results
3.1 Introduction
In this section we present a summary of the main results of the evaluation. The full, detailed results from the study are presented in a separate report, which can be obtained from the Forfás website, www.forfas.ie.
3.2 The relevance of FP6 to Irish researchers
Interviews carried out with key FP6 participants, support providers and funding agencies confirmed FP6 as having been of high or good relevance to Irish participants. The FP6 priorities and instruments were a good fit with most researchers’ requirements and have helped to facilitate their involvement (rather than act as a barrier to it). The FP6 priority areas were considered to be both a little broader and easier to understand than FP5 priorities (which were based more around socio-economic objectives than research areas) and this has helped to ensure that most project ideas have been able to find a suitable home within the overall FP6 structure. As we might expect, the changes introduced in FP6 did have a negative impact on some participants, but on the whole the changes were viewed positively rather than negatively.
Our survey of Irish participants in FP6 confirmed that in the majority of cases FP6 priority areas and instruments were as relevant or more relevant than those employed in FP5. Of those that expressed an opinion, 58% rated FP6 research topics to be more relevant than those in FP5 and 54% rated the FP6 instruments to be more relevant than those employed in FP5. Even the new large-scale instruments Networks of Excellence (NoEs) and Integrated Projects (IPs) introduced for FP6 were rated as more likely to have increased researchers’ ability to participate than to have decreased it.
3.3 Ireland’s participation in FP6 proposals
European Commission data on Ireland’s participation in proposals submitted to FP6 indicated that levels of demand have been reasonable, with almost 700 Irish organisations being named in just over 3,000 proposals. Ireland participated in 5.4% of all proposals submitted to FP6, accounting for 1% of the participations in proposals overall.
An analysis of Ireland’s participation in proposals by FP6 Priority Area reveals that Irish demand was highest in the Human resources and mobility (HRM), Support for the coordination of activities, Information society technologies (IST), and Food quality and safety areas. Proposal participation rates were lowest in the Euratom, Specific measures in support of international cooperation, Aeronautics and space, Life sciences and Sustainable development areas. The low demand for participation in the Life sciences area is notable given Ireland’s recent investment in this field.
Irish applicants and accounted for 6% of proposal participations, while ‘Other’ organisations (mainly public sector bodies) made up 27% of the applicant organisations but only 12% of the participations in proposals. These data reflect the different scale of demand from different types of organisations, with the Irish HEIs submitting an average of 65 proposals each, while Irish companies submitted just two each on average.
Most FP6 participants (52% of those that responded) indicated that their organisation or research group had increased the number of proposals submitted to FP6 in comparison with FP5, while a significant minority (38%) stated that there had been no change. Only 10% signalled that they had decreased the number of applications submitted. These data appear to suggest that demand for FP participation by Irish organisations is increasing, but they do not tell us anything about trends in demand among organisations that (i) participated in FP5 but chose not to apply to FP6 or (ii) applied to FP6 but were unsuccessful with their
proposals. In the absence of data on Irish involvement in FP5 proposals (which was not available) it is hard to determine whether Irish demand increased or decreased from FP5 to FP6 in absolute terms.
3.4 Ireland’s success rates in applying to FP6
3.4.1 Ireland’s success rates
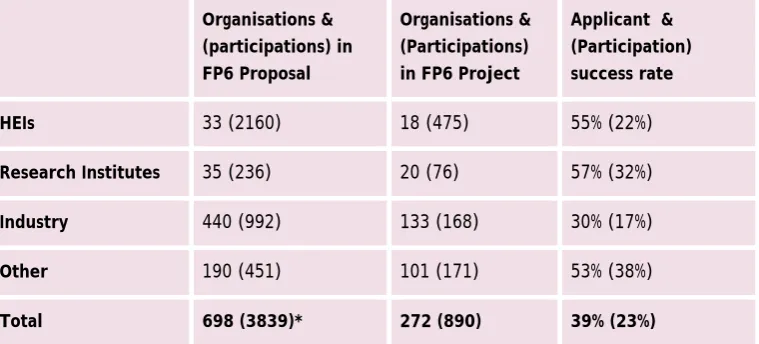
[image:17.595.91.471.513.685.2]Based on the numbers of proposals submitted and the numbers of these that were supported, Ireland’s overall proposal-level success rate in FP6 was calculated at 23%, significantly above the average success rate for FP6 proposals as a whole (18%). Ireland’s participation-level success rate was also 23%, again significantly above the overall average for FP6 (19%). These figures confirm the strong performance of Irish proposals within the competition as a whole.
Table 1 – Ireland’s application & participation success rate in FP6, by organisation type
Organisations & (participations) in FP6 Proposal
Organisations & (Participations) in FP6 Project
Applicant & (Participation) success rate HEIs 33 (2160) 18 (475) 55% (22%)
Research Institutes 35 (236) 20 (76) 57% (32%)
Industry 440 (992) 133 (168) 30% (17%)
Other 190 (451) 101 (171) 53% (38%)
Total 698 (3839)* 272 (890) 39% (23%)
participations, a success rate of just one in six. (Table 1) Further analysis has shown that while over half of the HEIs, research institutes and ‘other’ types of organisation that applied were successful in securing at least one project, less than a third of the industry applicants had any success at all within the competition. Unfortunately the European Commission has not published any data on success rates by type of participating organisation so it is not possible to determine whether, for example, Irish industry’s FP6 proposal success rates were above or below those of industry as a whole (i.e. all countries).
Irish proposal success rates were above the FP6 average in 12 of the 17 FP6 Priority Areas, with Ireland performing particularly well in the Food quality and safety, Sustainable development, Research infrastructures and Euratom areas, where Irish success rates were more than double the FP6 averages. Irish proposal success rates were well below average in the Support for international collaboration, Research and innovation and Science and society areas.
3.4.2 Reasons for unsuccessful proposals
Our survey of unsuccessful applicants revealed a very broad range of reasons as to why their FP6 proposals were not successful in obtaining support. The most significant reason for
proposals not succeeding was simply an insufficient budget to support all proposals that passed the required quality threshold, an issue that affected almost a third of the failed
proposals. The next most significant reason was a lack of detailed information and
explanation; something which if addressed may have helped the proposal over the threshold. A significant minority of proposals fell down on their overall written quality, or suffered from issues relating to the end-use or exploitation of project results. Other proposals failed due to problems with the team - either the strength of the consortium, the quality of the team, having too many partners, having too few partners, or the overall management structure.
Most of the reasons behind non-success of proposals are to a large extent within the control of the consortium preparing the proposal, with the possible exceptions of a lack of available budget and duplication with another proposal. However, even in these cases preparing a higher quality proposal, with a strong team, clear goals, and which fits squarely within the scope of the call will increase the chances that the proposal wins out over other competing offers. There appears therefore to be scope for Ireland to further increase its proposal success rates, building on what is already a very strong position.
3.4.3 The fate of unsuccessful FP6 proposals
3.5 Ireland’s participation in FP6
3.5.1 Numbers of participants
A total of 272 Irish organisations were involved in funded FP6 projects, constituting approximately 1.3% of all FP6 participants. This was 14% below the number of Irish organisations involved in FP5 (n=318) and 42% below the number involved in FP4 (n=467). This downward trend in participant numbers is a concern, though it is hard to determine whether the decline reflects a wider trend in FP participation overall. Participant numbers are hard to calculate accurately due to problems with how organisation names are coded in the FP databases, with the same organisation often being listed under multiple different names.
As we have found in other national FP evaluations, the level of ‘churn’ or turnover in Ireland’s FP participant base appears to be high from one FP to the next. Only around a quarter of the Irish organisations involved in FP5 participated in FP6, and only around a third of Ireland’s FP6 participants were involved in FP5. This means (in real terms) that 242 FP5 participants either did not apply or were not successful in FP6 and 182 ‘new’ organisations came into FP6 to take their place, obviously leading to a net fall overall.
The highest level of churn was found within the long tail of mainly industry and ‘other’ participants that typically have only one or two participations in any given FP and either struggle or decide not to participate again. We identified just 88 Irish organisations that participated in both FP5 and FP6, and within this set there was a ‘core’ group of 33
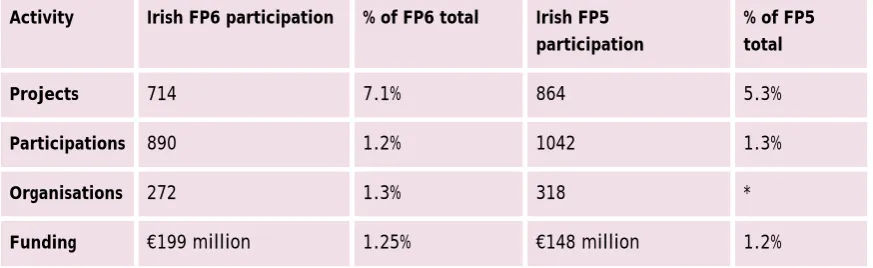
[image:19.595.86.523.535.669.2]organisations that had five or more participations across the two programmes. Ireland’s FP6 participations (and indeed its FP6 funding) are very highly concentrated within this ‘core’ group of organisations, collectively accounting for two-thirds of Irish participations and over three-quarters of FP6 funding. Table 2 below summarises the comparison of Irish FP6 participation to FP5 participation.
Table 2: Comparison of Irish FP6 participation to FP5
Activity Irish FP6 participation % of FP6 total Irish FP5 participation
% of FP5 total Projects 714 7.1% 864 5.3%
Participations 890 1.2% 1042 1.3%
Organisations 272 1.3% 318 *
Funding €199 million 1.25% €148 million 1.2%
3.5.2 Numbers of participations
again we see a general downward trend, with a sharp fall in participations from FP4 to FP5 (down by 30%) and a smaller but still significant fall from FP5 to FP6 (down by 15%).
While the falls in Irish participation numbers appear to be significant, the data do not reveal anything about the more general trends in FP participation from FP4 to FP5 and then to FP6. Ireland secured 2.1% of all FP4 participations, 1.3% of all FP5 participations, and 1.2% of all FP6 participations. The fall from FP4 to FP5 was therefore highly significant, but the fall from FP5 to FP6 was much smaller in proportionate terms, and may be largely accounted for by an increase in the number of countries participating and in particular by a growing involvement by some of the new Member States.
It should be noted that Ireland’s fortunes over successive FPs have been influenced by a range of factors, in particular the ‘Objective 1’ (developing country) status that was lost in 2001 as the Irish economy strengthened. The objective 1 status had made Ireland a favoured partner, particularly during FP4 when the Commission was trying to ensure strong participation on the part of the less well-developed economies. Participants from other EU countries expected that inclusion of Irish partners would help to enhance their chances of success within the competition, and at the same time the continued low levels of national funding meant that EU funding remained very important to Irish researchers. This resulted in a ‘spike’ in Irish participations during FP4 that remains unsurpassed to this day. However, most interviewees consider FP4 involvement levels to have been ‘artificially’ high and not a true reflection of Ireland’s ‘natural’ research strengths or ability to participate more generally in the FPs. The integration of new Member States and the loss of the ‘Objective 1’ status are seen by some to have been the primary reasons as to why FP5 and FP6 participation levels have not been the same as those enjoyed in FP4, although increases in national funding over the same period may also have diverted attention away from FP participation in the short term.
3.5.3 Involvement in FP6 projects
Irish organisations were involved in 714 projects, out of a total of 10,058, so Ireland
participated in 7.1% of all FP6 projects. Ireland was involved in 1,187 FP4 projects and 864 FP5 projects, so once again we see a general downward trend, with a sharp fall in project involvement rates from FP4 to FP5 (down by 27%) and a smaller but still significant fall from FP5 to FP6 (down by 17%).
However, when Ireland’s project involvement rate is expressed in proportionate terms a somewhat different picture emerges. Ireland participated in 7.1% of all FP4 projects, 5.3% of all FP5 projects and 7.1% of all FP6 projects, so while there was a downward trend in
Ireland’s project involvement rate from FP4 to FP5 this fall was fully reversed in FP6, with Ireland again participating in 7.1% of the projects. There has been a general downward trend in the numbers of projects supported by successive FPs, but with increased ‘average’ numbers of partners within each project (and increased volumes of funding per project). This trend helps to explain why Ireland’s project involvement rate (from FP5 to FP6) has increased even though its share of participations has declined.
3.6 Funding received by Irish organisations
3.6.1 Amount of EC funding received
The total funding allocation equates to an average of just over €720k per participant, which is 14% higher than the average received by all organisations across FP6 as a whole. The
average volume of funding awarded per Irish participation was just over €220k, almost exactly the same as the overall EU average.
The absolute volume of FP6 funding received by Irish organisations was 34% higher than the amount secured from FP5 (€148 million) and also slightly higher than the amount received through FP4 (€191 million). However, changes to the scale of successive FPs mean that in proportionate terms the share of FP funding allocated to Irish organisations has remained static over the last two FPs (1.2% in both cases), and significantly below the 1.9% share of the total received under FP4.
3.6.2 FP6 funding in comparison with Ireland’s contribution to the EU budget
Each country contributes to the general EU budget in proportion to its Gross Domestic Product (GDP). Taking Ireland’s share of EU-25 GDP (2005) as a proxy for its contribution to the EU budget revealed that Ireland’s ‘target’ level of income from FP6 would have been €209 million or 1.38% of EU-25 funding, calculated on a juste retour basis. Ireland in fact received €199 million, or 1.32% of EU-25 funding, slightly below the target figure but only very
marginally so. However, this level of performance placed Ireland only 15th out of the EU-25 in
[image:21.595.92.455.434.656.2]terms of its FP6 funding to GDP ratio, arguably lower than the level that Ireland would have hoped to obtain.
Figure 1: Ireland’s FP6 income to GDP, GNP and Population ratio as a % for selected countries.
Other performance metrics, however, suggest that Ireland’s performance has actually been rather strong. For example, we know that Ireland’s GDP figures have been boosted over the past two decades by foreign direct investment in manufacturing and international services, with a large number of foreign-owned multinational companies (MNCs) setting up operations in Ireland. While these MNCs contribute to Ireland’s GDP figures, many have not, heretofore, carried out research and development (R&D) operations in Ireland and so have not
participated in the Framework Programmes. For this reason, some commentators suggest
0 50 100 150 200 250
Ratio FP6 income to GDP
%
Ratio FP6 income to GNP
%
Ratio FP6 income to
that the share of FP funding realised by Ireland in comparison with its Gross National Product is a more suitable measure of performance, as this limits the effects of the MNCs. Ireland’s ‘target figure’ for FP6 income if it were to have been in direct proportion to its GNP contribution would have been €168 million, so Ireland has in fact received a funding share significantly greater (i.e. 18% higher) than expected. Based on the ratio of FP6 funding received to GNP share, Ireland was ranked 11th out of the EU-25, a much better performance
than obtained when considering GDP.
We have also considered Ireland’s performance in FP6 relative to the size of its population. Ireland’s population in 2004 was 0.89% of the EU-25 total, meaning that its ‘target’ income from FP6 based on its share of the population would have been close to €135 million. Ireland’s total allocation of €199 million is clearly well above this figure (47% higher), again suggesting that Ireland’s performance overall can be considered to be strong. Ireland was ranked 7th out of the EU-25 in terms of the ratio of its share of FP6 funding allocations to its
share of EU-25 population. Figure 1 above highlights Ireland’s funding in comparison to a selected number of EU-25 countries. The full report has the details for all 25 countries.
3.6.3 Amount of EC funding by type of organisation
Irish HEIs received €135 million in funding, 68% of Ireland’s total and far higher than the overall share of FP6 funding allocated to HEIs across FP6 as a whole (37%). Research institutes received just 6% of the funding (~ €13 million), which is well below the share assigned to research institutes through FP6 as a whole (32%). This finding is explained by the small number of research institutes within the Irish innovation system in comparison with most other EU countries. Industry received just over €27 million in funding, 14% of Ireland’s total and below the FP6 average of 18%. The other types of participants received €23 million in funding, 12% of Ireland’s total, which is in line with the share allocated to ‘Others’ across FP6 as a whole.
These figures suggest that there has been a concentration of Ireland’s FP6 funding within the HEIs, with this group accounting for more than two-thirds of the funding despite accounting for only around half of the participations. The funding per HEI participation was found to be 23% higher in Ireland than the average assigned to HEIs across FP6 as a whole. This ‘gain’ has been offset by lower than average allocations to Irish research institutes, industry and ‘other’ participants, with funding amounts per participation that were 34%, 25% and 21% below the FP6 averages for each of those groups respectively. These findings provide a strong indication that the HEIs have occupied more central roles in the FP6 projects than the other groups.
3.7 Patterns of participation
3.7.1 Participation by different types of actor
HEIs and research institutes have each constituted 7% of Irish participants, lower than the FP6 averages of 14% and 19% respectively. Irish industry accounted for 49% of Ireland’s
to be closer to 59% and ‘others’ closer to 28%. This indicates a very good level of involvement by Irish companies, as compared to FP6 averages.
Analysis of the number of FP6 participations accounted for by each group paints a rather different picture, with Irish HEIs accounting for 53% of Ireland’s participations, well above the FP6 average of 36%. Research institute participations accounted for just 9% of Ireland’s total, well below the FP6 average of 28%. Industry participations accounted for 19% of Ireland’s total, the same share as the FP6 average. However, it should be noted that misclassification of Irish industry as ‘Others’ within the FP6 database may mean that industry participations constituted a higher share of Ireland’s total than is witnessed more generally across FP6. ‘Other’ actors made up 19% of Ireland’s participations, slightly above the FP6 average of 17%. These figures further support the conclusion that Ireland’s participations are highly
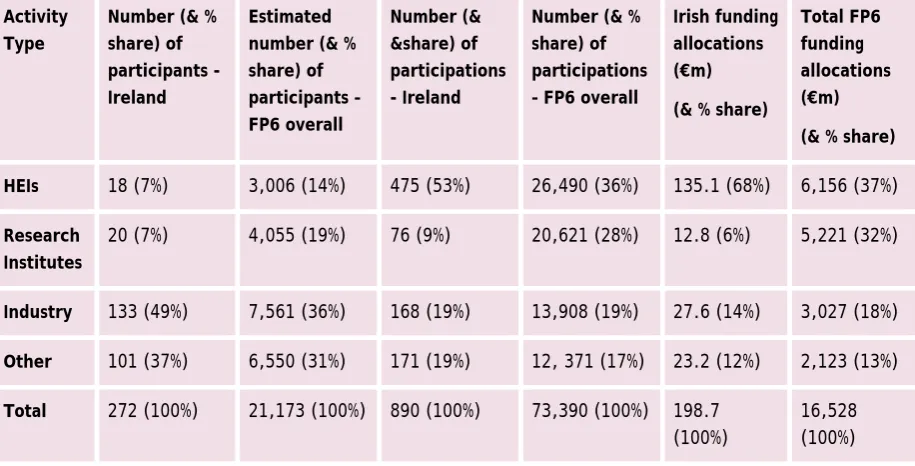
[image:23.595.89.547.377.610.2]concentrated within the HEI sector, though participation by HEIs and research institutes in combination has been very close to average EU levels. Participation rates by industry and ‘other’ types of organisation have been at or slightly above FP6 averages for all countries. Table 3 below summarises the breakdown by organisation type for participant, participation and funding.
Table 3: Breakdown of Ireland's share in FP6 by organisation type
Activity Type
Number (& % share) of participants - Ireland
Estimated number (& % share) of participants – FP6 overall Number (& &share) of participations - Ireland
Number (& % share) of participations – FP6 overall
Irish funding allocations (€m) (& % share)
Total FP6 funding allocations (€m) (& % share) HEIs 18 (7%) 3,006 (14%) 475 (53%) 26,490 (36%) 135.1 (68%) 6,156 (37%)
Research Institutes
20 (7%) 4,055 (19%) 76 (9%) 20,621 (28%) 12.8 (6%) 5,221 (32%)
Industry 133 (49%) 7,561 (36%) 168 (19%) 13,908 (19%) 27.6 (14%) 3,027 (18%)
Other 101 (37%) 6,550 (31%) 171 (19%) 12, 371 (17%) 23.2 (12%) 2,123 (13%)
Total 272 (100%) 21,173 (100%) 890 (100%) 73,390 (100%) 198.7 (100%)
16,528 (100%)
These findings suggest that there is no particular problem with any of the four group’s participation levels in FP6, when structural differences are taken into account. It is notable that Irish industry’s share of Irish participations is at or above the FP6 average level, so any concern about low levels of industry involvement need to be applied to Framework as a whole rather than to Ireland’s participation within it.
3.7.2 Irish participation in FP6 Priority Areas
Human resources and mobility (HRM) areas, with over 100 projects, over 150 participations and in excess of €40 million in funding achieved by Ireland in each area.
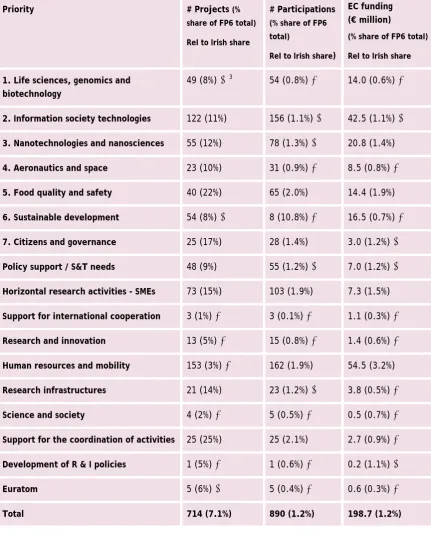
Table 4: Projects, participations and EC funding by Priority Area
Priority # Projects (% share of FP6 total)
Rel to Irish share
# Participations
(% share of FP6 total)
Rel to Irish share)
EC funding (€ million)
(% share of FP6 total)
Rel to Irish share
1. Life sciences, genomics and biotechnology
49 (8%) 3 54 (0.8%) 14.0 (0.6%)
2. Information society technologies 122 (11%) 156 (1.1%) 42.5 (1.1%)
3. Nanotechnologies and nanosciences 55 (12%) 78 (1.3%) 20.8 (1.4%)
4. Aeronautics and space 23 (10%) 31 (0.9%) 8.5 (0.8%)
5. Food quality and safety 40 (22%) 65 (2.0%) 14.4 (1.9%)
6. Sustainable development 54 (8%) 8 (10.8%) 16.5 (0.7%)
7. Citizens and governance 25 (17%) 28 (1.4%) 3.0 (1.2%)
Policy support / S&T needs 48 (9%) 55 (1.2%) 7.0 (1.2%)
Horizontal research activities - SMEs 73 (15%) 103 (1.9%) 7.3 (1.5%)
Support for international cooperation 3 (1%) 3 (0.1%) 1.1 (0.3%)
Research and innovation 13 (5%) 15 (0.8%) 1.4 (0.6%)
Human resources and mobility 153 (3%) 162 (1.9%) 54.5 (3.2%)
Research infrastructures 21 (14%) 23 (1.2%) 3.8 (0.5%)
Science and society 4 (2%) 5 (0.5%) 0.5 (0.7%)
Support for the coordination of activities 25 (25%) 25 (2.1%) 2.7 (0.9%)
Development of R & I policies 1 (5%) 1 (0.6%) 0.2 (1.1%)
Euratom 5 (6%) 5 (0.4%) 0.6 (0.3%)
Total 714 (7.1%) 890 (1.2%) 198.7 (1.2%)
3 Arrows () have been used to symbolise Ireland’s performance in each area compared to its overall
A comparison was made between the profile of Irish participation and funding allocations in each FP6 priority area and overall FP6 participation and funding profiles. It showed that Ireland has performed most strongly in the following areas: (i) Food quality and safety, boosted by very high performance by Irish research institutes and ‘other’ public sector organisations, (ii) Horizontal research involving SMEs (small & medium-sized enterprises), with strong performance by Irish industry, research institutes and ‘Others’, and (iii) Human resources and mobility, with a very strong performance by Irish HEIs and industry. The areas of weakest performance were (i) Life sciences, (ii) Aeronautics and space, (iii) Sustainable development, and (iv) Support for International cooperation.
Given Ireland’s ambitions over the past decade to significantly expand its capabilities in the Life sciences and Information Society Technologies (IST) areas, a stronger (comparative) performance in these two priorities, especially the former, might have been expected. Our analyses indicate that the main reason for low performance in the Life science area was limited demand, as success rates for Irish applicants were above average for that area. A different situation exists for the IST area, where demand was high but success rates were low, leading to an ‘average’ level of participation. The impact of Science Foundation Ireland (SFI) funding on FP involvement in these two areas remains unclear, and participation levels in FP7 should provide a better indication of the growing strength of Ireland’s research capabilities in these two domains.
Further analysis of participation data revealed that Irish HEIs performed particularly strongly in the Nanotechnologies and Nanosciences area, and in the Human resources and mobility programme. Irish industry performed extremely well in the Horizontal research activities – SMEs area, and also in Human resources and mobility. Irish research institutes performed exceptionally well in the Food quality and safety area, and strongly in the Policy support / S&T needs area, the Horizontal research activities – SMEs area, and the Support for the coordination of activities area. ‘Other’ Irish organisations did well in Food quality and safety, Citizens and governance, Policy support / S&T (science & technology) needs, the Support for coordination of activities and Horizontal research activities – SMEs areas.
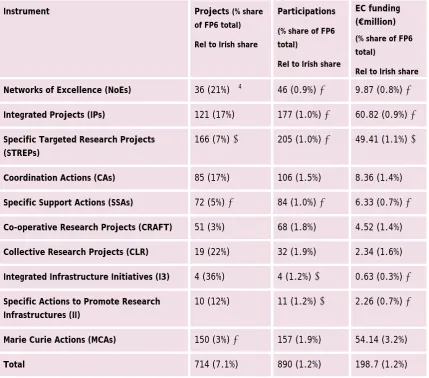
3.7.3 Irish participation in FP6 Instruments
Ireland participated in all (10) main FP6 instruments. (Table 5) In terms of numbers alone Irish participation was highest for Specific Targeted Research Projects (STREPs), Marie Curie Actions (MCAs), and Integrated Projects (IPs), with over 100 projects, over 150 participations and in excess of €40 million in funding achieved by Ireland for each type of instrument.
In comparative terms (i.e. compared to overall FP6 participation profiles) Ireland has performed most strongly in relation to the following Instruments: (i) Co-operative Research Projects (CRAFT), boosted by high levels of Industry, research institute and ‘Others’, (ii) Marie Curie Actions (MCAs), with Irish Industry and to a lesser extent HEIs performing very well, (iii) Collective Research Projects, due to high levels of industry and ‘Other’
participations, and (iv) Coordination Actions, with Irish research institutes and ‘Others’ performing strongly.
Table 5: Projects, participations and EC funding, by Type of Instrument
Instrument Projects (% share of FP6 total)
Rel to Irish share
Participations
(% share of FP6 total)
Rel to Irish share
EC funding (€million)
(% share of FP6 total)
Rel to Irish share
Networks of Excellence (NoEs) 36 (21%) 4 46 (0.9%) 9.87 (0.8%)
Integrated Projects (IPs) 121 (17%) 177 (1.0%) 60.82 (0.9%)
Specific Targeted Research Projects (STREPs)
166 (7%) 205 (1.0%) 49.41 (1.1%)
Coordination Actions (CAs) 85 (17%) 106 (1.5%) 8.36 (1.4%)
Specific Support Actions (SSAs) 72 (5%) 84 (1.0%) 6.33 (0.7%)
Co-operative Research Projects (CRAFT) 51 (3%) 68 (1.8%) 4.52 (1.4%)
Collective Research Projects (CLR) 19 (22%) 32 (1.9%) 2.34 (1.6%)
Integrated Infrastructure Initiatives (I3) 4 (36%) 4 (1.2%) 0.63 (0.3%)
Specific Actions to Promote Research Infrastructures (II)
10 (12%) 11 (1.2%) 2.26 (0.7%)
Marie Curie Actions (MCAs) 150 (3%) 157 (1.9%) 54.14 (3.2%)
Total 714 (7.1%) 890 (1.2%) 198.7 (1.2%)
3.7.4 Irish participants’ roles in the FP6 projects
Irish participants took on the role of coordinator in 25% of the projects in which they were involved and occupied the role of coordinator in 20% of their participations, well above the FP6 average of 14%. This is a very good level of performance, albeit one that is boosted by strong performance in the Marie Curie (mobility) actions where there is a high ratio of coordinators to participants. Irish HEIs were mainly responsible for boosting Irish coordinator rates, taking on this role in 28% of their participations. Other groups were coordinators for between 10% and 14% of their participations.
Irish coordination rates were higher than the FP6 averages in the Nanotechnologies and nanosciences, Food quality and safety, Sustainable development, and Human Resources and mobility areas. Irish coordination to participation rates were higher than the FP6 averages in several other areas too, but the numbers of projects and coordinator roles was relatively
4 Arrows () have been used to symbolise Ireland’s performance for each Instrument compared to its
small so the ratios are not a very reliable indicator of performance in those other areas. In terms of the different FP6 instruments, Irish coordination rates were highest (in relative terms) for the Marie Curie Actions, STREPs, Specific Support Actions and Integrated Projects. Coordination rates were lowest for the CRAFT (Co-operative research projects) and
Infrastructure-related Instruments (II (Specific Actions to Promote Research Infrastructures) and I3 (Integrated Infrastructure Initiatives)).
The majority of Irish participants in FP6 projects have indicated through our survey that they occupied either a primary role or a major role with regard to most elements of the FP6 projects in which they were involved. Irish participants’ roles were greatest in relation to (i) carrying out the research, (ii) disseminating the results, and (iii) defining the content and scope of the project. Irish participants have also in most cases played a full role in planning or coordinating future research. In comparison Irish participants in most cases played only a minor role in defining the size and membership of the consortium, negotiating the IPR (Intellectual Property Rights) arrangements, and research training.
3.8 The drivers and motives for FP6 participation
3.8.1 Motives and drivers
The primary motives for Framework participation as revealed by our survey of participants are to develop new or improved relationships or networks, to develop and extend internal knowledge and capabilities, and to access research funding. Other motives rated as
important or very important for most respondents are (i) to develop new or improved tools, methods or techniques, (ii) to solve specific scientific or technical questions, (iii) to tackle problems that have a European or international dimension, and (iv) to access capabilities that do not exist in Ireland.
There is a good degree of alignment as to the most important motives across the four main participant groups, with all considering the development of new networks and relationships and the extension of knowledge and capabilities as a ‘top 3’ motive for participation.
Accessing research funding was the primary motive for the HEIs, and was a ‘top 5’ motive for research institutes and industry, but was ranked as less important by ‘Other’ participants. We also identified that industry rated the development of new or improved commercial products and services as a primary motive, but this appears well down the list of important motives for other groups.
3.8.2 The impact of national funding in leveraging FP involvement
FP6 coincided with a period of rapid expansion in the levels of national research funding in Ireland, and our survey of FP6 participants revealed that in almost all cases the national funding situation has either had no impact or a positive impact on these participants’ desire and ability to become involved in Framework. In most cases respondents indicated that national funds have significantly enhanced their capacity to perform research, and some mentioned that the infrastructure and equipment provided through national funding, as well as the increased numbers of researchers, has enhanced their ability to become involved in European projects.
continuing downward trend in the number of Irish participants from FP4 to FP5 to FP6. The impact of the new money has therefore not heralded any significant increase in FP
participation, but it has also not led to any significant decrease.
Interviews with some of Ireland’s key researchers have confirmed that national funding has in some cases led to a decreased desire to apply to the Framework Programmes, but the extent to which this has happened cannot easily be determined. Some interviewees indicated that national funding has been easier to access than FP funding in recent years, and that it has taken time to establish national research groups and projects, leaving less time to pursue FP involvement. For some researchers this has meant no FP participation while for others it has meant a more reactive approach, with less likelihood of leading projects but a willingness to still become involved. Therefore national funding increases over recent years appear to have exerted both positive and negative effects on demand for FP participation among Irish researchers.
While the ‘net’ influence of national funding on FP6 participation is difficult to discern at the present time, there is a reasonably broad consensus that national funding will in the future enable higher levels of FP involvement, due to the enhanced research capabilities and capacity that it has brought to Ireland. With the right signals, incentives and strategies it is expected that national funding and FP funding will become more closely linked, with the former building the capacity and capabilities that can be used to leverage funding and other benefits from the latter.
3.9 Collaboration patterns within Ireland’s FP6 projects
Irish participants in FP6 have ‘officially’ collaborated with over 6,700 non-Irish partners within the scope of the projects, though we believe that the true figure is closer to 5,000 due to problems with the coding of organisation names in the FP6 database. The average number of partners in which Irish organisations was involved was 16, which is broadly in line with other comparable countries.
3.9.1 Intra-Ireland collaboration
Irish participants collaborated with other Irish organisations within 18% of their projects. Ireland-Ireland links constituted 2.1% of Ireland’s total links to EU-25 countries within FP6 projects, placing it 18th out of the EU-25 in terms of its proportion of ‘intra-country’ links.
The data suggests that the larger countries perform best on this measure, with Germany, France, the UK, Italy and Spain heading the list, but even so there is clearly room for improvement in terms of Ireland’s intra-country collaborations within FP projects.
The level of intra-Ireland collaboration was highest in absolute terms in the Information society technologies area, which accounted for ~20% of all intra-Ireland links. In
proportionate terms the areas with the highest level of intra-Ireland collaborations within projects were Food quality and safety (38% of projects), Nanotechnologies and nanosciences (31%) and Horizontal research activities – SMEs (27%).
It might have been anticipated that the highest level of intra-Ireland collaboration would take place within the IPs and NoEs, due to the larger numbers of partners involved in those
Co-operative Research Projects and Coordination Actions were also associated with relatively high levels of intra-Ireland collaboration (24% and 21% respectively).
Our analyses have shown that while HEIs account for 53% of Ireland’s participations, they only account for 38% of the participations in projects with intra-Ireland collaboration. We have also found that HEIs’ intra-country collaborations are just as likely to be with other HEIs as with other types of organisation. Industry is the group that has performed best in terms of Ireland’s intra-country collaborations, accounting for 31% of the participations in projects with intra-Ireland collaboration but only 19% of Ireland’s FP6 participations overall. Research institutes and Others’ share of participations in projects with intra-Ireland collaboration is in rough proportion to their overall share of FP6 participations.
3.9.2 North-South collaboration
Irish participants had 60 participation-level collaborations with partners from Northern Ireland across a total of 53 FP6 projects. This ‘North-South’ collaboration has mainly been with Queen’s University Belfast and the University of Ulster, though there have also been collaborations with companies from Northern Ireland (x8 participations), research institutes (x3) and public agencies (x2). It is not easy to determine whether this level of collaboration is higher or lower than might be expected or deemed desirable, but it does stand as a benchmark against which future levels of North-South collaboration can be judged.
3.9.3 Collaboration with actors from different countries
Ireland has collaborated with partners from 84 different countries within FP6. In volume terms the greatest number of collaborations took place with partners in the UK and Germany (~13% of collaborations), followed by France (~10%) and Italy (~9%). However, this reflects mainly the high levels of participation in FP6 by these countries as a whole. Looking at the ratio of each country’s share of participations in Irish projects to their overall share of FP6 participations revealed that Ireland’s most active ‘Member State’ collaboration partners during FP6 were Luxembourg, Portugal and Finland and the least active were the Czech republic, France and Germany.
3.9.4 Collaboration with the stable core of European S&T organisations
Our analyses have shown that Irish organisations have had significant levels of collaboration in FP6 with the ten identified (non-Irish) organisations that were the most active ‘network’ partners in FP5. It is considered important that Irish organisations have strong links to the stable ‘core’ of major FP participants, and the results from this study indicate that they do.
3.10 Outputs delivered through FP6 projects
The outputs produced most regularly and widely by FP6 projects were also rated by participants as the most important types of output, which suggests that in most cases the projects are successfully producing the kinds of outputs that the participants expect and need. Some significant differences between the four main groups were identified, with, for example, the HEIs and research institutes rating publications and trained personnel more highly than did industrial and ‘other’ (mainly public sector) participants. The latter two groups rated new or improved tools, methods and techniques and new or improved
commercial products and services as most important, and while these were also rated fairly highly by the research institutes they figure as less significant overall for the HEIs. It seems that while there are some important differences in the priority given to different types of output by the different groups, there is a sufficient degree of alignment between them to ensure that all participants are able to realise the kinds of outputs they are seeking.
The study has found that all types of participants – including industry - place some of the more ‘commercially’ oriented outputs, i.e. those relating to invention disclosures, license agreements, patent applications and patents granted towards the bottom of their
‘importance’ list. New or improved tools, methods and techniques, and to a lesser extent new or improved commercial products and services are rated much more highly and widely in terms of their importance, and tend to be delivered through a larger number of FP6 projects. We believe that this is because inventions, licences and patents tend to involve IPR
arrangements that are difficult to assign within the context of collaborative (pre-competitive) research projects.
3.11 Benefits realised through FP6 projects
3.11.1 The main benefits of FP participation
The main positive benefits realised by FP6 participants come in the form of (i) improved relationships and networks, (ii) increased understanding and knowledge, (iii) enhanced reputation and image and (iv) increased scientific capabilities. The FP6 projects also bestow significant benefits in related areas such as increased technological capabilities, improved planning of research, improved ability / capacity to carry out research / training, and improved competitive position nationally and internationally. There is accordingly a good degree of alignment between participants’ motives for FP6 participation and the kinds of benefits they are realising, with new and improved networks and new knowledge and
capabilities figuring as the key motives for participation and also as the areas of greatest and most widespread impact. This suggests strongly that FP participants are becoming involved in order to realise the kinds of benefits that the FP projects are able to deliver, ensuring
reasonably high levels of success as judged by the participants themselves. Relatively few differences were noted between the four main participant groups concerning the kinds of benefits they realise through FP participation.
abroad, and the collaborative projects also play a significant role in exchanging knowledge between academic and industrial participants, with researchers gaining a greater depth of insight into industrial problems and industry gaining improved understanding of the
opportunities provided by new research developments. These ‘symbiotic’ processes are at the centre of the ‘added value’ that the European collaborations can bring, and for most participants bring benefits that significantly outweigh the additional costs that are inevitably associated with multi-partner, multi-country collaborative projects.
Individual interviewees have provided fairly compelling accounts of the considerable benefits they have enjoyed in term of their international reputation and image, their capacity and capabilities to carry out research, and their networks and connections to other players within the industrial and academic communities. There is a sense of a growing maturity within the research community as to how to extract value from the Framework Programmes, and an increased likelihood that participants are becoming involved for the right reasons, looking for and valuing the kinds of benefits that tend to flow. The benefits, particularly in terms of research profile, networks and reputation and image appear to be strongest when Irish partners coordinate projects.
3.11.2 The role of FP6 in supporting and reinforcing participants’ research strategies
The vast majority of FP6 participants reported that FP6 had exerted a positive impact on their research strategies, with around half stating that it had supported and reinforced it to a large extent and almost half stating that FP6 had supported and reinforced their R&D strategy to a small extent. Only 5% of respondents indicated that FP6 had not had any role in
supporting or reinforcing their R&D strategies.
Feedback from interviewees has confirmed that those involved do indeed in most cases see a strong natural alignment between their own research priorities and the opportunities
available within the FPs. The impact of FP participation on participants’ individual research strategies is generally seen to be a strongly positive one, with the collaborations bringing new ideas, new capabilities and new infrastructure to bear on existing research areas, questions and problems. The FPs have impacted on national strategies by influencing the direction of participants’ work, increasing the range of methods and tools available and opening up new lines of enquiry.
While there is a good alignment in most areas, it is clear that the relationship between national and EU-level priorities has become more complex and varies significantly across the different research and industrial fields. During the early FPs (1-4) national research
strategies were much more strongly influenced by the FPs, as EU funding vastly outweighed the volume of funds available at national level. However, the advent of significant levels of national funding has brought with it a new sense of national priorities as distinct from EU ones, and the relationship between the two are at present much less clear. There is certainly the possibility that national funding will, at least in the short term, have created a
divergence between national priorities and those of the FPs within some parts of the community, and it is necessary for funding agencies and research performers to investigate further the extent to which this is happening, particularly in the IST and Life sciences areas, where SFI funding has altered significantly the pattern of funding and the status of national research agendas.
3.11.3 The role of FP6 in supporting the internationalisation of research
some other international programmes such as COST (European Cooperation in Science and Technology) and EUREKA5 also help to facilitate network development and mobility of
researchers, each instrument occupies its own space and there is limited direct overlap between them. There is no other international collaborative funding scheme with the same scale as the FPs and which provides such significant amounts of funding from a centralised pot. As such, FP remains the most important instrument for international collaborative research and networking.
The FPs were not generally considered to be playing a major role in extending collaborative networks outside of the EU, though this does happen to some degree. However, the FPs have been effective in acting as a stepping-stone for other, related European initiatives such as the Competitiveness and Innovation Programme (CIP). Experience and profile gained through the Framework Programmes helps to further the opportunities available within other EU-level support mechanisms. In addition, good levels of FP participation and inclusion in the key networks is considered to be crucial for involvement in the European Technology Platforms, Joint Technology Initiatives and Joint Programming Initiatives that are developing roadmaps for future EU research. Such planning initiatives are seen as both reflective of and conducive to FP involvement more generally, as they bring together the recognised major